3SBio Business Model Canvas

Unlock the strategic blueprint of a biopharma's growth and therapeutic focus
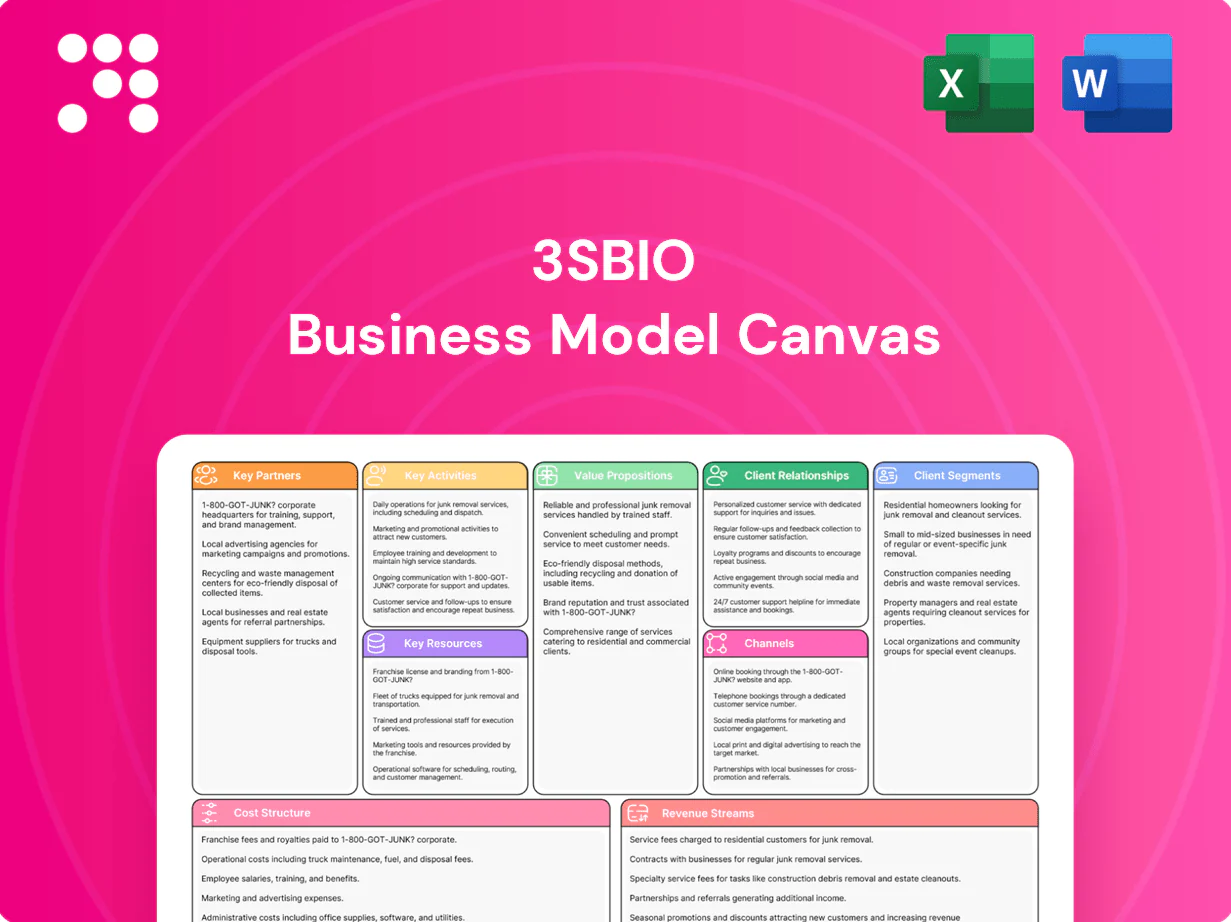
Unlock the strategic blueprint behind 3SBio’s growth and therapeutic focus with this Business Model Canvas preview. It outlines customer segments, value propositions, key partners, and revenue streams to show how the company scales and sustains margins. Purchase the full, editable Canvas (Word & Excel) for a section-by-section analysis and actionable insights for investors, strategists, and founders.
Partnerships

Academic R&D alliances
Academic R&D alliances with universities and institutes accelerate discovery in oncology, nephrology and immunology by supplying disease biology, target validation and translational models; joint grants and peer‑reviewed publications de‑risk early science and broaden pipeline options, while clear IP frameworks establish ownership and option rights to enable downstream licensing and co‑development.
Clinical sites & KOL networks
Hospital networks and KOL networks accelerate patient enrollment and bolster trial credibility, with NMPA emphasis on real-world evidence expanded in 2024 driving closer hospital-regulator alignment. KOLs shape protocol design and endpoints to match standards of care, while advisory boards guide label strategy and market access. Co-authored clinical data consistently increases clinician confidence and adoption.

CRO/CMO and technology vendors
Specialized CROs streamline preclinical, clinical ops and biometrics, with the global CRO market estimated at ~$64 billion in 2024, accelerating time-to-clinic and reducing fixed headcount. CMOs provide surge biologics, fill-finish and QC capacity—outsourcing now represents about 40% of global biologics manufacturing in 2024. Platform vendors supply single-use systems (>60% adoption), advanced bioanalytics and digital QMS, improving speed, quality and cost flexibility.

Distribution and market access partners
Specialty distributors expand 3SBios reach into hospital pharmacies and regional tenders, supporting penetration in over 2,000 tertiary and secondary hospitals across China in 2024 and boosting hospital formulary listings.
Market access consultants prepared HTA dossiers and price negotiations in 2024, contributing to faster NRDL and provincial reimbursement entries; pharmacoeconomic collaborators produced cost-effectiveness models that improved payer acceptance rates by double digits.
Together these partners increased formulary wins and product availability, translating into measurable uplift in hospital sales and tender success during 2024.
- Distribution: coverage >2,000 hospitals (2024)
- Market access: HTA dossiers driving NRDL/provincial listings (2024)
- Pharmacoeconomics: cost-effectiveness evidence improving payer approvals
Licensing and co-development partners
In-licensing complements 3SBio’s internal pipeline with differentiated assets while out-licensing monetizes non-core geographies and indications; co-development deals share pivotal study costs and risk, with milestones and royalties providing diversified revenue streams. Royalty rates typically range mid-single to low-double digits; recent partnerships have accelerated late-stage portfolio expansion in 2024.
- In-licensing: fills pipeline gaps
- Out-licensing: monetizes non-core markets
- Co-dev: shares cost/risk
- Milestones/royalties: diversify revenue (mid-single to low-double digit royalties)
Academic R&D to market: >2,000 hospitals, ~$64B CRO, ~40% biologics outsourced
3SBio leverages academic R&D, hospital/KOL networks, CROs/CMOs and specialty distributors to accelerate discovery, trials and market access; 2024 KPIs include >2,000 hospital coverage, CRO market ~$64B and ~40% biologics outsourced. In-licensing and co-dev deals fill pipelines and de-risk costs, with royalties mid-single to low-double digits.
| Partner | 2024 Metric |
|---|---|
| Hospitals/distribution | >2,000 hospitals |
| CRO market | ~$64B |
| Biologics outsourcing | ~40% |
| Single-use systems | >60% adoption |
| Royalties | mid-single to low-double % |
What is included in the product
 Detailed Word Document
A comprehensive Business Model Canvas tailored to 3SBio, detailing customer segments, value propositions, channels, revenue streams and cost structure across the 9 BMC blocks; includes competitive advantages, SWOT-linked insights and investor-ready narrative for strategic decisions and funding discussions.

 Customizable Excel Spreadsheet
Condenses 3SBio’s biotech and specialty-pharma strategy into a one-page, editable canvas to speed due diligence and align stakeholders; ideal for quick comparisons, board briefings, and collaborative updates.
Activities

Biologic R&D and pipeline management
Discovery, lead optimization and candidate selection drive 3SBios pipeline flow, with 2024 efforts focused on accelerating IND-enabling studies. Biomarker and mechanism studies in 2024 sharpen patient selection to improve trial readouts and attrition rates. Regular portfolio reviews balance risk across modalities and stages, reallocating resources toward high-value assets. Aggressive IP filing in 2024 protects future commercial value and licensing opportunities.
Clinical development and medical affairs
Designing and running Phase I–III trials generates registration-grade evidence; industry averages show ~10% overall approval probability from Phase I and mean development time ~10–12 years with estimated total cost around $2.6 billion (widely cited 2020–2024 estimates).
Medical affairs publishes and presents data at major congresses and CME programs, often supporting >100 abstracts per year across global oncology and biologics portfolios.
Investigator-initiated studies extend insights into real-world settings, complementing randomized data with larger observational cohorts and registry analyses.
Post-approval studies and real-world evidence programs drive label expansions and market access, frequently underpinning supplementary approvals and payer negotiations.

GMP manufacturing of biologics
GMP manufacturing at 3SBio integrates upstream cell culture (typical fed‑batch mAb yields 1–5 g/L) and downstream purification with recoveries around 60–80% to ensure consistent quality. Process validation and comparability are performed per ICH Q5E/Q6B to sustain regulatory compliance. Fill‑finish and cold‑chain logistics (storage ranges from −80°C to 2–8°C) protect product integrity. Continuous improvement programs target COGS reductions in the order of ~10–20% over time.

Regulatory and pharmacovigilance
Preparation of CTAs, NDAs/BLAs and lifecycle submissions is core, following PDUFA review timelines (standard BLA 10 months, priority 6 months) and ICH dossier formats. Safety monitoring aggregates signals from trials and commercial use via spontaneous reports and periodic analyses. Risk management plans and PSURs (initial 6-month cadence then annual per ICH) maintain compliance; proactive agency interactions keep pathways predictable.
- CTAs/NDAs/BLAs: regulatory dossier readiness
- Safety: trial + post-market signal capture
- RMP/PSUR: 6-month then annual
- Agency engagement: predictable timelines (PDUFA 10/6 mo)
Commercialization and market access
Tendering and competitive pricing secure hospital inclusion and formulary placement, while health-economics dossiers quantify cost-effectiveness for payers; patient-support initiatives target adherence in China’s ~1.41 billion population (2024 est.).
Key-account managers focus uptake in priority centers and provincial hospitals, and patient-support programs reduce access barriers through copay assistance, education and logistics coordination.
- Tendering: formulary access
- Health economics: HEOR dossiers
- Key accounts: priority centers
- Patient support: adherence & access
2024 IND push: 12+ programs, ~10% approval
Discovery to IND with 2024 focus on IND-enabling studies; portfolio reviews reallocate resources across 12+ programs. Clinical development runs Phase I–III (industry approval ~10%, avg timeline 10–12 yrs). GMP yields 1–5 g/L, recoveries 60–80%; COGS reductions target 10–20%.
| Metric | Value |
|---|---|
| Programs | 12+ |
| Approval rate | ~10% |
| Yield | 1–5 g/L |
Preview Before You Purchase
Business Model Canvas
The document you're previewing is the exact 3SBio Business Model Canvas you will receive after purchase, not a mockup. Upon completing your order you'll get the full, editable file formatted as shown—ready for presentation, editing and sharing in Word and Excel formats. No surprises.

Unlock the strategic blueprint of a biopharma's growth and therapeutic focus
Unlock the strategic blueprint behind 3SBio’s growth and therapeutic focus with this Business Model Canvas preview. It outlines customer segments, value propositions, key partners, and revenue streams to show how the company scales and sustains margins. Purchase the full, editable Canvas (Word & Excel) for a section-by-section analysis and actionable insights for investors, strategists, and founders.
Partnerships
Academic R&D alliances
Academic R&D alliances with universities and institutes accelerate discovery in oncology, nephrology and immunology by supplying disease biology, target validation and translational models; joint grants and peer‑reviewed publications de‑risk early science and broaden pipeline options, while clear IP frameworks establish ownership and option rights to enable downstream licensing and co‑development.
Clinical sites & KOL networks
Hospital networks and KOL networks accelerate patient enrollment and bolster trial credibility, with NMPA emphasis on real-world evidence expanded in 2024 driving closer hospital-regulator alignment. KOLs shape protocol design and endpoints to match standards of care, while advisory boards guide label strategy and market access. Co-authored clinical data consistently increases clinician confidence and adoption.
CRO/CMO and technology vendors
Specialized CROs streamline preclinical, clinical ops and biometrics, with the global CRO market estimated at ~$64 billion in 2024, accelerating time-to-clinic and reducing fixed headcount. CMOs provide surge biologics, fill-finish and QC capacity—outsourcing now represents about 40% of global biologics manufacturing in 2024. Platform vendors supply single-use systems (>60% adoption), advanced bioanalytics and digital QMS, improving speed, quality and cost flexibility.
Distribution and market access partners
Specialty distributors expand 3SBios reach into hospital pharmacies and regional tenders, supporting penetration in over 2,000 tertiary and secondary hospitals across China in 2024 and boosting hospital formulary listings.
Market access consultants prepared HTA dossiers and price negotiations in 2024, contributing to faster NRDL and provincial reimbursement entries; pharmacoeconomic collaborators produced cost-effectiveness models that improved payer acceptance rates by double digits.
Together these partners increased formulary wins and product availability, translating into measurable uplift in hospital sales and tender success during 2024.
- Distribution: coverage >2,000 hospitals (2024)
- Market access: HTA dossiers driving NRDL/provincial listings (2024)
- Pharmacoeconomics: cost-effectiveness evidence improving payer approvals
Licensing and co-development partners
In-licensing complements 3SBio’s internal pipeline with differentiated assets while out-licensing monetizes non-core geographies and indications; co-development deals share pivotal study costs and risk, with milestones and royalties providing diversified revenue streams. Royalty rates typically range mid-single to low-double digits; recent partnerships have accelerated late-stage portfolio expansion in 2024.
- In-licensing: fills pipeline gaps
- Out-licensing: monetizes non-core markets
- Co-dev: shares cost/risk
- Milestones/royalties: diversify revenue (mid-single to low-double digit royalties)
Academic R&D to market: >2,000 hospitals, ~$64B CRO, ~40% biologics outsourced
3SBio leverages academic R&D, hospital/KOL networks, CROs/CMOs and specialty distributors to accelerate discovery, trials and market access; 2024 KPIs include >2,000 hospital coverage, CRO market ~$64B and ~40% biologics outsourced. In-licensing and co-dev deals fill pipelines and de-risk costs, with royalties mid-single to low-double digits.
| Partner | 2024 Metric |
|---|---|
| Hospitals/distribution | >2,000 hospitals |
| CRO market | ~$64B |
| Biologics outsourcing | ~40% |
| Single-use systems | >60% adoption |
| Royalties | mid-single to low-double % |
What is included in the product
Detailed Word Document
A comprehensive Business Model Canvas tailored to 3SBio, detailing customer segments, value propositions, channels, revenue streams and cost structure across the 9 BMC blocks; includes competitive advantages, SWOT-linked insights and investor-ready narrative for strategic decisions and funding discussions.
Customizable Excel Spreadsheet
Condenses 3SBio’s biotech and specialty-pharma strategy into a one-page, editable canvas to speed due diligence and align stakeholders; ideal for quick comparisons, board briefings, and collaborative updates.
Activities
Biologic R&D and pipeline management
Discovery, lead optimization and candidate selection drive 3SBios pipeline flow, with 2024 efforts focused on accelerating IND-enabling studies. Biomarker and mechanism studies in 2024 sharpen patient selection to improve trial readouts and attrition rates. Regular portfolio reviews balance risk across modalities and stages, reallocating resources toward high-value assets. Aggressive IP filing in 2024 protects future commercial value and licensing opportunities.
Clinical development and medical affairs
Designing and running Phase I–III trials generates registration-grade evidence; industry averages show ~10% overall approval probability from Phase I and mean development time ~10–12 years with estimated total cost around $2.6 billion (widely cited 2020–2024 estimates).
Medical affairs publishes and presents data at major congresses and CME programs, often supporting >100 abstracts per year across global oncology and biologics portfolios.
Investigator-initiated studies extend insights into real-world settings, complementing randomized data with larger observational cohorts and registry analyses.
Post-approval studies and real-world evidence programs drive label expansions and market access, frequently underpinning supplementary approvals and payer negotiations.
GMP manufacturing of biologics
GMP manufacturing at 3SBio integrates upstream cell culture (typical fed‑batch mAb yields 1–5 g/L) and downstream purification with recoveries around 60–80% to ensure consistent quality. Process validation and comparability are performed per ICH Q5E/Q6B to sustain regulatory compliance. Fill‑finish and cold‑chain logistics (storage ranges from −80°C to 2–8°C) protect product integrity. Continuous improvement programs target COGS reductions in the order of ~10–20% over time.
Regulatory and pharmacovigilance
Preparation of CTAs, NDAs/BLAs and lifecycle submissions is core, following PDUFA review timelines (standard BLA 10 months, priority 6 months) and ICH dossier formats. Safety monitoring aggregates signals from trials and commercial use via spontaneous reports and periodic analyses. Risk management plans and PSURs (initial 6-month cadence then annual per ICH) maintain compliance; proactive agency interactions keep pathways predictable.
- CTAs/NDAs/BLAs: regulatory dossier readiness
- Safety: trial + post-market signal capture
- RMP/PSUR: 6-month then annual
- Agency engagement: predictable timelines (PDUFA 10/6 mo)
Commercialization and market access
Tendering and competitive pricing secure hospital inclusion and formulary placement, while health-economics dossiers quantify cost-effectiveness for payers; patient-support initiatives target adherence in China’s ~1.41 billion population (2024 est.).
Key-account managers focus uptake in priority centers and provincial hospitals, and patient-support programs reduce access barriers through copay assistance, education and logistics coordination.
- Tendering: formulary access
- Health economics: HEOR dossiers
- Key accounts: priority centers
- Patient support: adherence & access
2024 IND push: 12+ programs, ~10% approval
Discovery to IND with 2024 focus on IND-enabling studies; portfolio reviews reallocate resources across 12+ programs. Clinical development runs Phase I–III (industry approval ~10%, avg timeline 10–12 yrs). GMP yields 1–5 g/L, recoveries 60–80%; COGS reductions target 10–20%.
| Metric | Value |
|---|---|
| Programs | 12+ |
| Approval rate | ~10% |
| Yield | 1–5 g/L |
Preview Before You Purchase
Business Model Canvas
The document you're previewing is the exact 3SBio Business Model Canvas you will receive after purchase, not a mockup. Upon completing your order you'll get the full, editable file formatted as shown—ready for presentation, editing and sharing in Word and Excel formats. No surprises.
Original: $10.00
-65%$10.00
$3.50Description
Unlock the strategic blueprint of a biopharma's growth and therapeutic focus
Unlock the strategic blueprint behind 3SBio’s growth and therapeutic focus with this Business Model Canvas preview. It outlines customer segments, value propositions, key partners, and revenue streams to show how the company scales and sustains margins. Purchase the full, editable Canvas (Word & Excel) for a section-by-section analysis and actionable insights for investors, strategists, and founders.
Partnerships
Academic R&D alliances
Academic R&D alliances with universities and institutes accelerate discovery in oncology, nephrology and immunology by supplying disease biology, target validation and translational models; joint grants and peer‑reviewed publications de‑risk early science and broaden pipeline options, while clear IP frameworks establish ownership and option rights to enable downstream licensing and co‑development.
Clinical sites & KOL networks
Hospital networks and KOL networks accelerate patient enrollment and bolster trial credibility, with NMPA emphasis on real-world evidence expanded in 2024 driving closer hospital-regulator alignment. KOLs shape protocol design and endpoints to match standards of care, while advisory boards guide label strategy and market access. Co-authored clinical data consistently increases clinician confidence and adoption.
CRO/CMO and technology vendors
Specialized CROs streamline preclinical, clinical ops and biometrics, with the global CRO market estimated at ~$64 billion in 2024, accelerating time-to-clinic and reducing fixed headcount. CMOs provide surge biologics, fill-finish and QC capacity—outsourcing now represents about 40% of global biologics manufacturing in 2024. Platform vendors supply single-use systems (>60% adoption), advanced bioanalytics and digital QMS, improving speed, quality and cost flexibility.
Distribution and market access partners
Specialty distributors expand 3SBios reach into hospital pharmacies and regional tenders, supporting penetration in over 2,000 tertiary and secondary hospitals across China in 2024 and boosting hospital formulary listings.
Market access consultants prepared HTA dossiers and price negotiations in 2024, contributing to faster NRDL and provincial reimbursement entries; pharmacoeconomic collaborators produced cost-effectiveness models that improved payer acceptance rates by double digits.
Together these partners increased formulary wins and product availability, translating into measurable uplift in hospital sales and tender success during 2024.
- Distribution: coverage >2,000 hospitals (2024)
- Market access: HTA dossiers driving NRDL/provincial listings (2024)
- Pharmacoeconomics: cost-effectiveness evidence improving payer approvals
Licensing and co-development partners
In-licensing complements 3SBio’s internal pipeline with differentiated assets while out-licensing monetizes non-core geographies and indications; co-development deals share pivotal study costs and risk, with milestones and royalties providing diversified revenue streams. Royalty rates typically range mid-single to low-double digits; recent partnerships have accelerated late-stage portfolio expansion in 2024.
- In-licensing: fills pipeline gaps
- Out-licensing: monetizes non-core markets
- Co-dev: shares cost/risk
- Milestones/royalties: diversify revenue (mid-single to low-double digit royalties)
Academic R&D to market: >2,000 hospitals, ~$64B CRO, ~40% biologics outsourced
3SBio leverages academic R&D, hospital/KOL networks, CROs/CMOs and specialty distributors to accelerate discovery, trials and market access; 2024 KPIs include >2,000 hospital coverage, CRO market ~$64B and ~40% biologics outsourced. In-licensing and co-dev deals fill pipelines and de-risk costs, with royalties mid-single to low-double digits.
| Partner | 2024 Metric |
|---|---|
| Hospitals/distribution | >2,000 hospitals |
| CRO market | ~$64B |
| Biologics outsourcing | ~40% |
| Single-use systems | >60% adoption |
| Royalties | mid-single to low-double % |
What is included in the product
Detailed Word Document
A comprehensive Business Model Canvas tailored to 3SBio, detailing customer segments, value propositions, channels, revenue streams and cost structure across the 9 BMC blocks; includes competitive advantages, SWOT-linked insights and investor-ready narrative for strategic decisions and funding discussions.
Customizable Excel Spreadsheet
Condenses 3SBio’s biotech and specialty-pharma strategy into a one-page, editable canvas to speed due diligence and align stakeholders; ideal for quick comparisons, board briefings, and collaborative updates.
Activities
Biologic R&D and pipeline management
Discovery, lead optimization and candidate selection drive 3SBios pipeline flow, with 2024 efforts focused on accelerating IND-enabling studies. Biomarker and mechanism studies in 2024 sharpen patient selection to improve trial readouts and attrition rates. Regular portfolio reviews balance risk across modalities and stages, reallocating resources toward high-value assets. Aggressive IP filing in 2024 protects future commercial value and licensing opportunities.
Clinical development and medical affairs
Designing and running Phase I–III trials generates registration-grade evidence; industry averages show ~10% overall approval probability from Phase I and mean development time ~10–12 years with estimated total cost around $2.6 billion (widely cited 2020–2024 estimates).
Medical affairs publishes and presents data at major congresses and CME programs, often supporting >100 abstracts per year across global oncology and biologics portfolios.
Investigator-initiated studies extend insights into real-world settings, complementing randomized data with larger observational cohorts and registry analyses.
Post-approval studies and real-world evidence programs drive label expansions and market access, frequently underpinning supplementary approvals and payer negotiations.
GMP manufacturing of biologics
GMP manufacturing at 3SBio integrates upstream cell culture (typical fed‑batch mAb yields 1–5 g/L) and downstream purification with recoveries around 60–80% to ensure consistent quality. Process validation and comparability are performed per ICH Q5E/Q6B to sustain regulatory compliance. Fill‑finish and cold‑chain logistics (storage ranges from −80°C to 2–8°C) protect product integrity. Continuous improvement programs target COGS reductions in the order of ~10–20% over time.
Regulatory and pharmacovigilance
Preparation of CTAs, NDAs/BLAs and lifecycle submissions is core, following PDUFA review timelines (standard BLA 10 months, priority 6 months) and ICH dossier formats. Safety monitoring aggregates signals from trials and commercial use via spontaneous reports and periodic analyses. Risk management plans and PSURs (initial 6-month cadence then annual per ICH) maintain compliance; proactive agency interactions keep pathways predictable.
- CTAs/NDAs/BLAs: regulatory dossier readiness
- Safety: trial + post-market signal capture
- RMP/PSUR: 6-month then annual
- Agency engagement: predictable timelines (PDUFA 10/6 mo)
Commercialization and market access
Tendering and competitive pricing secure hospital inclusion and formulary placement, while health-economics dossiers quantify cost-effectiveness for payers; patient-support initiatives target adherence in China’s ~1.41 billion population (2024 est.).
Key-account managers focus uptake in priority centers and provincial hospitals, and patient-support programs reduce access barriers through copay assistance, education and logistics coordination.
- Tendering: formulary access
- Health economics: HEOR dossiers
- Key accounts: priority centers
- Patient support: adherence & access
2024 IND push: 12+ programs, ~10% approval
Discovery to IND with 2024 focus on IND-enabling studies; portfolio reviews reallocate resources across 12+ programs. Clinical development runs Phase I–III (industry approval ~10%, avg timeline 10–12 yrs). GMP yields 1–5 g/L, recoveries 60–80%; COGS reductions target 10–20%.
| Metric | Value |
|---|---|
| Programs | 12+ |
| Approval rate | ~10% |
| Yield | 1–5 g/L |
Preview Before You Purchase
Business Model Canvas
The document you're previewing is the exact 3SBio Business Model Canvas you will receive after purchase, not a mockup. Upon completing your order you'll get the full, editable file formatted as shown—ready for presentation, editing and sharing in Word and Excel formats. No surprises.











