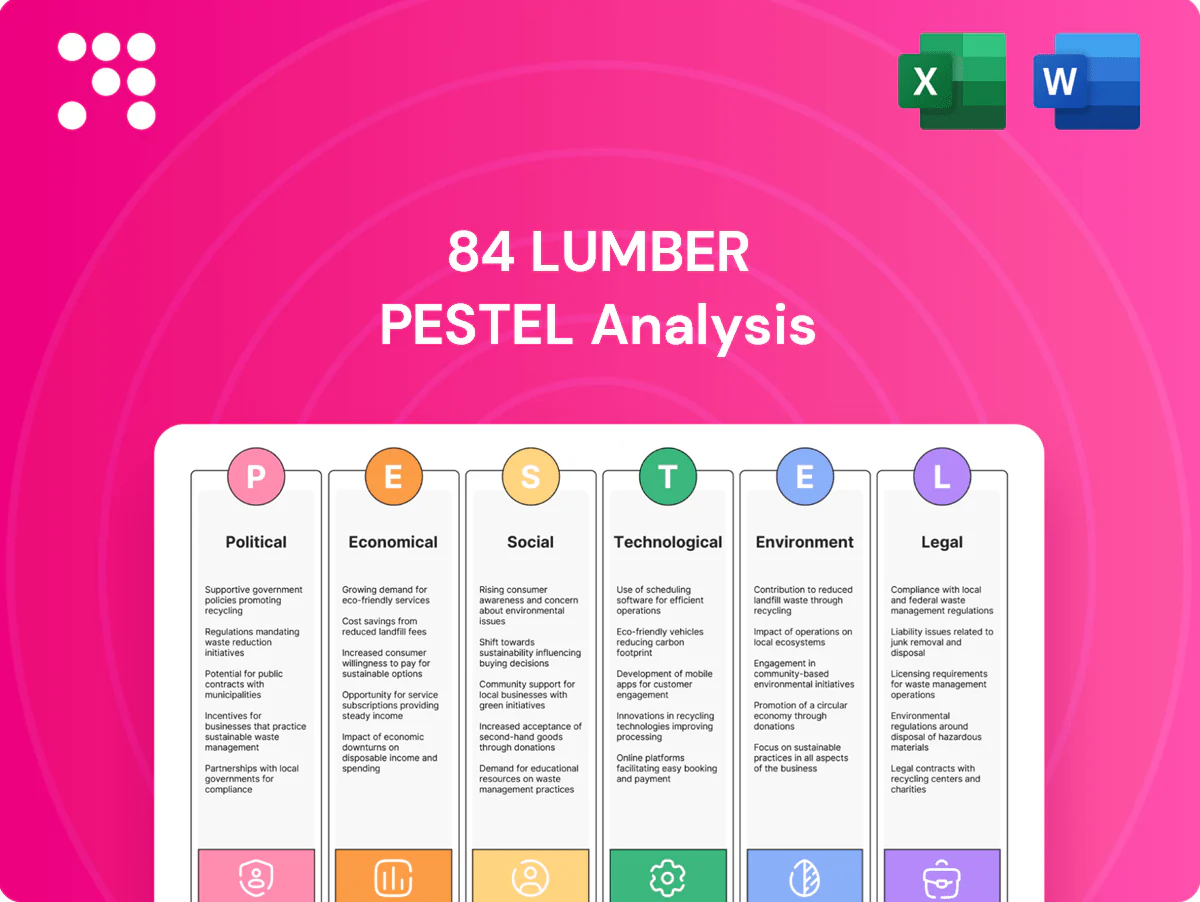
84 Lumber PESTLE Analysis

Your Shortcut to Market Insight Starts Here
Discover how political, economic, social, technological, legal and environmental forces are reshaping 84 Lumber’s strategy and performance. Our concise PESTLE highlights key risks and opportunities you need to know. Ready for boardroom use and investor briefs—purchase the full analysis for detailed, actionable insights now.
Political factors

Federal housing and infrastructure policy
Federal shifts such as the 1.2 trillion Infrastructure Investment and Jobs Act and the 369 billion Inflation Reduction Act materially drive construction demand and project pipelines, affecting 84 Lumber sales volumes. Tax incentives from the IRA for energy-efficient homes push demand toward higher-margin, sustainable SKUs. Appropriations delays cause order volatility and cash-flow pressure. 84 Lumber must align bids and inventory with policy timelines to mitigate risk.
Trade policy and tariffs on wood products
Import duties on Canadian softwood—historically ranging roughly 9–20% per US Commerce rulings—and tariffs on building inputs such as steel and aluminum (often adding 10–25% cost) drive higher lumber costs and price instability; Random Lengths data show lumber spot swings exceeding 50–70% year‑over‑year in volatile periods. Volatility can compress 84 Lumber margins when selling price hikes lag; strategic multi‑source procurement and futures/options hedging have reduced exposure in 2023–24. Transparent, formulaic pass‑through pricing to pro customers preserves sales volumes and margin recovery.

State and local permitting regimes
Permitting speed and zoning decisions directly control project start rates in core markets, with US single-family starts at about 773,000 units in 2023 (US Census) highlighting sensitivity to approvals. Tighter local regulations reduce sales velocity while streamlined permitting correlates with faster starts and higher demand. 84 Lumber benefits from local advocacy and contractor education to shorten cycles. Regional merchandising must mirror jurisdictional differences.

Workforce and immigration policy
Construction labor supply for 84 Lumber is sensitive to US immigration rules: foreign-born workers make about 30% of the construction workforce, and an AGC 2023 survey found 79% of contractors reporting difficulty hiring craft workers, which tightens timelines and constrains material throughput.
- Immigrant share ~30%
- 79% firms report hiring difficulty (AGC 2023)
- Policy easing could unlock backlogs and boost demand
- Workforce partnerships hedge policy risk
Transportation and logistics regulation
Hours-of-service rules, fuel standards and DOT compliance materially affect 84 Lumber’s delivery costs and reliability; US trucking moves 72.5% of freight by tonnage (2023) and fuel is ~23% of operating costs, so tighter fuel regs and e-logging enforcement (mandatory since 2017) can change route economics by ~5–10%.
- Regulatory cost exposure: fuel ~23%
- Freight reliance: 72.5% tonnage
- E-logging impact: −5–10% route efficiency
- Mitigation: proactive compliance, fleet optimization
$1.2T & $369B boost projects; tariffs, labor, fuel hit
IIJA $1.2T and IRA $369B lift project pipelines and demand for efficient SKUs. Tariffs (softwood 9–20%; steel/aluminum 10–25%) plus lumber volatility (50–70% YoY) pressure margins. Permitting, immigration (~30% workforce; AGC 79% hiring difficulty) and trucking (72.5% tonnage; fuel ~23% costs) affect timing and delivery expense.
| Metric | Value |
|---|---|
| SF starts 2023 | 773,000 |
| Softwood duty | 9–20% |
| Trucking share / fuel | 72.5% / ~23% |
What is included in the product
 Detailed Word Document
Explores how Political, Economic, Social, Technological, Environmental, and Legal forces uniquely affect 84 Lumber, with data-backed trends and industry-specific examples to identify risks and opportunities. Designed for executives, investors, and consultants, it delivers forward-looking insights and clean formatting ready for plans, decks, or scenario planning.

 Customizable Excel Spreadsheet
A concise, visually segmented PESTLE summary for 84 Lumber that can be dropped into presentations, edited with notes by region or business line, and easily shared across teams to support external risk discussions and strategic planning.
Economic factors

Housing cycle sensitivity
New starts, permits and remodeling—US housing starts averaged about 1.46 million units in 2024 and the remodeling market was roughly $450 billion—drive 84 Lumber’s core revenue. Mortgage rates (30-year ~6.9% in 2024) and affordability set the pace of orders and backlog. During downturns 84 must enforce tight inventory and credit control to protect margins. Upswings reward expanded capacity and quick-to-ship assortments.
Interest rates and credit availability
Higher rates — with the Fed funds target at 5.25–5.50% and the 30-year fixed averaging 7.31% in 2024 (Freddie Mac) — dampen residential demand and raise 84 Lumber’s working-capital costs. Tighter builder financing compresses order sizes and extends timelines, affecting backlog and inventory turnover. 84 Lumber must balance customer credit terms with cash conversion cycles. Dynamic pricing and targeted rebate programs can sustain volume without overextending credit.

Commodity price volatility
Lumber, OSB and roofing inputs have exhibited multi-year price swings exceeding 50% (Random Lengths and industry data since 2018), pressuring gross margins for installers and retailers like 84 Lumber. Frequent repricing and index‑linked contracts materially cut exposure, while tighter inventory turns and selective forward buys aligned to market signals limit write‑downs. Data‑driven demand forecasting reduces markdown risk by improving turn timing.

Labor costs and productivity
Wage inflation in distribution and manufacturing is pressuring unit economics—US average hourly earnings rose about 4.2% year-over-year in mid-2024 (BLS), while tight labor markets (unemployment ~3.7% June 2024) constrain capacity at component plants; automation and process improvements are deployed to offset rising payroll and retention programs cut costly churn.
- Wage inflation: +4.2% YoY (mid-2024)
- Unemployment: ~3.7% (June 2024)
- Mitigation: automation/process gains
- Retention: lowers replacement costs and churn
Regional economic disparities
84 Lumber performance tracks local employment, migration and disaster recovery spending—Sunbelt metros have driven the majority of US population and job gains since 2020, supporting store expansion, while slower-growth regions force tighter cost discipline; tailored assortments raise SKU turnover by market and network design should follow population and job flows.
- Focus: Sunbelt expansion
- Action: cost control in slow metros
- Metric: turnover by market
- Plan: align network to population/job flows
$1.2T & $369B boost projects; tariffs, labor, fuel hit
US housing starts ~1.46M (2024) and a ~$450B remodeling market drive 84 Lumber; 30-year mortgage ~7.31% and Fed funds 5.25–5.50% (2024) constrain demand and working capital. Lumber/OSB swings >50% since 2018 squeeze margins; tighter inventory, index pricing and forward buys mitigate risk. Wage inflation ~4.2% (mid-2024) and unemployment ~3.7% (June 2024) raise labor costs; Sunbelt growth guides network decisions.
| Metric | Value (Period) |
|---|---|
| Housing starts | 1.46M (2024) |
| Remodeling market | $450B (2024) |
| 30-year mortgage | 7.31% (2024) |
| Fed funds | 5.25–5.50% (2024) |
| Lumber price swing | >50% since 2018 |
| Wage inflation | +4.2% YoY (mid-2024) |
| Unemployment | 3.7% (June 2024) |
Preview the Actual Deliverable
84 Lumber PESTLE Analysis
The preview shown here is the exact 84 Lumber PESTLE Analysis you’ll receive after purchase—fully formatted and ready to use. It delivers political, economic, social, technological, legal, and environmental insights with professional structure. No placeholders or changes—this is the final document.

Your Shortcut to Market Insight Starts Here
Discover how political, economic, social, technological, legal and environmental forces are reshaping 84 Lumber’s strategy and performance. Our concise PESTLE highlights key risks and opportunities you need to know. Ready for boardroom use and investor briefs—purchase the full analysis for detailed, actionable insights now.
Political factors
Federal housing and infrastructure policy
Federal shifts such as the 1.2 trillion Infrastructure Investment and Jobs Act and the 369 billion Inflation Reduction Act materially drive construction demand and project pipelines, affecting 84 Lumber sales volumes. Tax incentives from the IRA for energy-efficient homes push demand toward higher-margin, sustainable SKUs. Appropriations delays cause order volatility and cash-flow pressure. 84 Lumber must align bids and inventory with policy timelines to mitigate risk.
Trade policy and tariffs on wood products
Import duties on Canadian softwood—historically ranging roughly 9–20% per US Commerce rulings—and tariffs on building inputs such as steel and aluminum (often adding 10–25% cost) drive higher lumber costs and price instability; Random Lengths data show lumber spot swings exceeding 50–70% year‑over‑year in volatile periods. Volatility can compress 84 Lumber margins when selling price hikes lag; strategic multi‑source procurement and futures/options hedging have reduced exposure in 2023–24. Transparent, formulaic pass‑through pricing to pro customers preserves sales volumes and margin recovery.
State and local permitting regimes
Permitting speed and zoning decisions directly control project start rates in core markets, with US single-family starts at about 773,000 units in 2023 (US Census) highlighting sensitivity to approvals. Tighter local regulations reduce sales velocity while streamlined permitting correlates with faster starts and higher demand. 84 Lumber benefits from local advocacy and contractor education to shorten cycles. Regional merchandising must mirror jurisdictional differences.
Workforce and immigration policy
Construction labor supply for 84 Lumber is sensitive to US immigration rules: foreign-born workers make about 30% of the construction workforce, and an AGC 2023 survey found 79% of contractors reporting difficulty hiring craft workers, which tightens timelines and constrains material throughput.
- Immigrant share ~30%
- 79% firms report hiring difficulty (AGC 2023)
- Policy easing could unlock backlogs and boost demand
- Workforce partnerships hedge policy risk
Transportation and logistics regulation
Hours-of-service rules, fuel standards and DOT compliance materially affect 84 Lumber’s delivery costs and reliability; US trucking moves 72.5% of freight by tonnage (2023) and fuel is ~23% of operating costs, so tighter fuel regs and e-logging enforcement (mandatory since 2017) can change route economics by ~5–10%.
- Regulatory cost exposure: fuel ~23%
- Freight reliance: 72.5% tonnage
- E-logging impact: −5–10% route efficiency
- Mitigation: proactive compliance, fleet optimization
$1.2T & $369B boost projects; tariffs, labor, fuel hit
IIJA $1.2T and IRA $369B lift project pipelines and demand for efficient SKUs. Tariffs (softwood 9–20%; steel/aluminum 10–25%) plus lumber volatility (50–70% YoY) pressure margins. Permitting, immigration (~30% workforce; AGC 79% hiring difficulty) and trucking (72.5% tonnage; fuel ~23% costs) affect timing and delivery expense.
| Metric | Value |
|---|---|
| SF starts 2023 | 773,000 |
| Softwood duty | 9–20% |
| Trucking share / fuel | 72.5% / ~23% |
What is included in the product
Detailed Word Document
Explores how Political, Economic, Social, Technological, Environmental, and Legal forces uniquely affect 84 Lumber, with data-backed trends and industry-specific examples to identify risks and opportunities. Designed for executives, investors, and consultants, it delivers forward-looking insights and clean formatting ready for plans, decks, or scenario planning.
Customizable Excel Spreadsheet
A concise, visually segmented PESTLE summary for 84 Lumber that can be dropped into presentations, edited with notes by region or business line, and easily shared across teams to support external risk discussions and strategic planning.
Economic factors
Housing cycle sensitivity
New starts, permits and remodeling—US housing starts averaged about 1.46 million units in 2024 and the remodeling market was roughly $450 billion—drive 84 Lumber’s core revenue. Mortgage rates (30-year ~6.9% in 2024) and affordability set the pace of orders and backlog. During downturns 84 must enforce tight inventory and credit control to protect margins. Upswings reward expanded capacity and quick-to-ship assortments.
Interest rates and credit availability
Higher rates — with the Fed funds target at 5.25–5.50% and the 30-year fixed averaging 7.31% in 2024 (Freddie Mac) — dampen residential demand and raise 84 Lumber’s working-capital costs. Tighter builder financing compresses order sizes and extends timelines, affecting backlog and inventory turnover. 84 Lumber must balance customer credit terms with cash conversion cycles. Dynamic pricing and targeted rebate programs can sustain volume without overextending credit.
Commodity price volatility
Lumber, OSB and roofing inputs have exhibited multi-year price swings exceeding 50% (Random Lengths and industry data since 2018), pressuring gross margins for installers and retailers like 84 Lumber. Frequent repricing and index‑linked contracts materially cut exposure, while tighter inventory turns and selective forward buys aligned to market signals limit write‑downs. Data‑driven demand forecasting reduces markdown risk by improving turn timing.
Labor costs and productivity
Wage inflation in distribution and manufacturing is pressuring unit economics—US average hourly earnings rose about 4.2% year-over-year in mid-2024 (BLS), while tight labor markets (unemployment ~3.7% June 2024) constrain capacity at component plants; automation and process improvements are deployed to offset rising payroll and retention programs cut costly churn.
- Wage inflation: +4.2% YoY (mid-2024)
- Unemployment: ~3.7% (June 2024)
- Mitigation: automation/process gains
- Retention: lowers replacement costs and churn
Regional economic disparities
84 Lumber performance tracks local employment, migration and disaster recovery spending—Sunbelt metros have driven the majority of US population and job gains since 2020, supporting store expansion, while slower-growth regions force tighter cost discipline; tailored assortments raise SKU turnover by market and network design should follow population and job flows.
- Focus: Sunbelt expansion
- Action: cost control in slow metros
- Metric: turnover by market
- Plan: align network to population/job flows
$1.2T & $369B boost projects; tariffs, labor, fuel hit
US housing starts ~1.46M (2024) and a ~$450B remodeling market drive 84 Lumber; 30-year mortgage ~7.31% and Fed funds 5.25–5.50% (2024) constrain demand and working capital. Lumber/OSB swings >50% since 2018 squeeze margins; tighter inventory, index pricing and forward buys mitigate risk. Wage inflation ~4.2% (mid-2024) and unemployment ~3.7% (June 2024) raise labor costs; Sunbelt growth guides network decisions.
| Metric | Value (Period) |
|---|---|
| Housing starts | 1.46M (2024) |
| Remodeling market | $450B (2024) |
| 30-year mortgage | 7.31% (2024) |
| Fed funds | 5.25–5.50% (2024) |
| Lumber price swing | >50% since 2018 |
| Wage inflation | +4.2% YoY (mid-2024) |
| Unemployment | 3.7% (June 2024) |
Preview the Actual Deliverable
84 Lumber PESTLE Analysis
The preview shown here is the exact 84 Lumber PESTLE Analysis you’ll receive after purchase—fully formatted and ready to use. It delivers political, economic, social, technological, legal, and environmental insights with professional structure. No placeholders or changes—this is the final document.
Original: $10.00
-65%$10.00
$3.50Description
Your Shortcut to Market Insight Starts Here
Discover how political, economic, social, technological, legal and environmental forces are reshaping 84 Lumber’s strategy and performance. Our concise PESTLE highlights key risks and opportunities you need to know. Ready for boardroom use and investor briefs—purchase the full analysis for detailed, actionable insights now.
Political factors
Federal housing and infrastructure policy
Federal shifts such as the 1.2 trillion Infrastructure Investment and Jobs Act and the 369 billion Inflation Reduction Act materially drive construction demand and project pipelines, affecting 84 Lumber sales volumes. Tax incentives from the IRA for energy-efficient homes push demand toward higher-margin, sustainable SKUs. Appropriations delays cause order volatility and cash-flow pressure. 84 Lumber must align bids and inventory with policy timelines to mitigate risk.
Trade policy and tariffs on wood products
Import duties on Canadian softwood—historically ranging roughly 9–20% per US Commerce rulings—and tariffs on building inputs such as steel and aluminum (often adding 10–25% cost) drive higher lumber costs and price instability; Random Lengths data show lumber spot swings exceeding 50–70% year‑over‑year in volatile periods. Volatility can compress 84 Lumber margins when selling price hikes lag; strategic multi‑source procurement and futures/options hedging have reduced exposure in 2023–24. Transparent, formulaic pass‑through pricing to pro customers preserves sales volumes and margin recovery.
State and local permitting regimes
Permitting speed and zoning decisions directly control project start rates in core markets, with US single-family starts at about 773,000 units in 2023 (US Census) highlighting sensitivity to approvals. Tighter local regulations reduce sales velocity while streamlined permitting correlates with faster starts and higher demand. 84 Lumber benefits from local advocacy and contractor education to shorten cycles. Regional merchandising must mirror jurisdictional differences.
Workforce and immigration policy
Construction labor supply for 84 Lumber is sensitive to US immigration rules: foreign-born workers make about 30% of the construction workforce, and an AGC 2023 survey found 79% of contractors reporting difficulty hiring craft workers, which tightens timelines and constrains material throughput.
- Immigrant share ~30%
- 79% firms report hiring difficulty (AGC 2023)
- Policy easing could unlock backlogs and boost demand
- Workforce partnerships hedge policy risk
Transportation and logistics regulation
Hours-of-service rules, fuel standards and DOT compliance materially affect 84 Lumber’s delivery costs and reliability; US trucking moves 72.5% of freight by tonnage (2023) and fuel is ~23% of operating costs, so tighter fuel regs and e-logging enforcement (mandatory since 2017) can change route economics by ~5–10%.
- Regulatory cost exposure: fuel ~23%
- Freight reliance: 72.5% tonnage
- E-logging impact: −5–10% route efficiency
- Mitigation: proactive compliance, fleet optimization
$1.2T & $369B boost projects; tariffs, labor, fuel hit
IIJA $1.2T and IRA $369B lift project pipelines and demand for efficient SKUs. Tariffs (softwood 9–20%; steel/aluminum 10–25%) plus lumber volatility (50–70% YoY) pressure margins. Permitting, immigration (~30% workforce; AGC 79% hiring difficulty) and trucking (72.5% tonnage; fuel ~23% costs) affect timing and delivery expense.
| Metric | Value |
|---|---|
| SF starts 2023 | 773,000 |
| Softwood duty | 9–20% |
| Trucking share / fuel | 72.5% / ~23% |
What is included in the product
Detailed Word Document
Explores how Political, Economic, Social, Technological, Environmental, and Legal forces uniquely affect 84 Lumber, with data-backed trends and industry-specific examples to identify risks and opportunities. Designed for executives, investors, and consultants, it delivers forward-looking insights and clean formatting ready for plans, decks, or scenario planning.
Customizable Excel Spreadsheet
A concise, visually segmented PESTLE summary for 84 Lumber that can be dropped into presentations, edited with notes by region or business line, and easily shared across teams to support external risk discussions and strategic planning.
Economic factors
Housing cycle sensitivity
New starts, permits and remodeling—US housing starts averaged about 1.46 million units in 2024 and the remodeling market was roughly $450 billion—drive 84 Lumber’s core revenue. Mortgage rates (30-year ~6.9% in 2024) and affordability set the pace of orders and backlog. During downturns 84 must enforce tight inventory and credit control to protect margins. Upswings reward expanded capacity and quick-to-ship assortments.
Interest rates and credit availability
Higher rates — with the Fed funds target at 5.25–5.50% and the 30-year fixed averaging 7.31% in 2024 (Freddie Mac) — dampen residential demand and raise 84 Lumber’s working-capital costs. Tighter builder financing compresses order sizes and extends timelines, affecting backlog and inventory turnover. 84 Lumber must balance customer credit terms with cash conversion cycles. Dynamic pricing and targeted rebate programs can sustain volume without overextending credit.
Commodity price volatility
Lumber, OSB and roofing inputs have exhibited multi-year price swings exceeding 50% (Random Lengths and industry data since 2018), pressuring gross margins for installers and retailers like 84 Lumber. Frequent repricing and index‑linked contracts materially cut exposure, while tighter inventory turns and selective forward buys aligned to market signals limit write‑downs. Data‑driven demand forecasting reduces markdown risk by improving turn timing.
Labor costs and productivity
Wage inflation in distribution and manufacturing is pressuring unit economics—US average hourly earnings rose about 4.2% year-over-year in mid-2024 (BLS), while tight labor markets (unemployment ~3.7% June 2024) constrain capacity at component plants; automation and process improvements are deployed to offset rising payroll and retention programs cut costly churn.
- Wage inflation: +4.2% YoY (mid-2024)
- Unemployment: ~3.7% (June 2024)
- Mitigation: automation/process gains
- Retention: lowers replacement costs and churn
Regional economic disparities
84 Lumber performance tracks local employment, migration and disaster recovery spending—Sunbelt metros have driven the majority of US population and job gains since 2020, supporting store expansion, while slower-growth regions force tighter cost discipline; tailored assortments raise SKU turnover by market and network design should follow population and job flows.
- Focus: Sunbelt expansion
- Action: cost control in slow metros
- Metric: turnover by market
- Plan: align network to population/job flows
$1.2T & $369B boost projects; tariffs, labor, fuel hit
US housing starts ~1.46M (2024) and a ~$450B remodeling market drive 84 Lumber; 30-year mortgage ~7.31% and Fed funds 5.25–5.50% (2024) constrain demand and working capital. Lumber/OSB swings >50% since 2018 squeeze margins; tighter inventory, index pricing and forward buys mitigate risk. Wage inflation ~4.2% (mid-2024) and unemployment ~3.7% (June 2024) raise labor costs; Sunbelt growth guides network decisions.
| Metric | Value (Period) |
|---|---|
| Housing starts | 1.46M (2024) |
| Remodeling market | $450B (2024) |
| 30-year mortgage | 7.31% (2024) |
| Fed funds | 5.25–5.50% (2024) |
| Lumber price swing | >50% since 2018 |
| Wage inflation | +4.2% YoY (mid-2024) |
| Unemployment | 3.7% (June 2024) |
Preview the Actual Deliverable
84 Lumber PESTLE Analysis
The preview shown here is the exact 84 Lumber PESTLE Analysis you’ll receive after purchase—fully formatted and ready to use. It delivers political, economic, social, technological, legal, and environmental insights with professional structure. No placeholders or changes—this is the final document.











