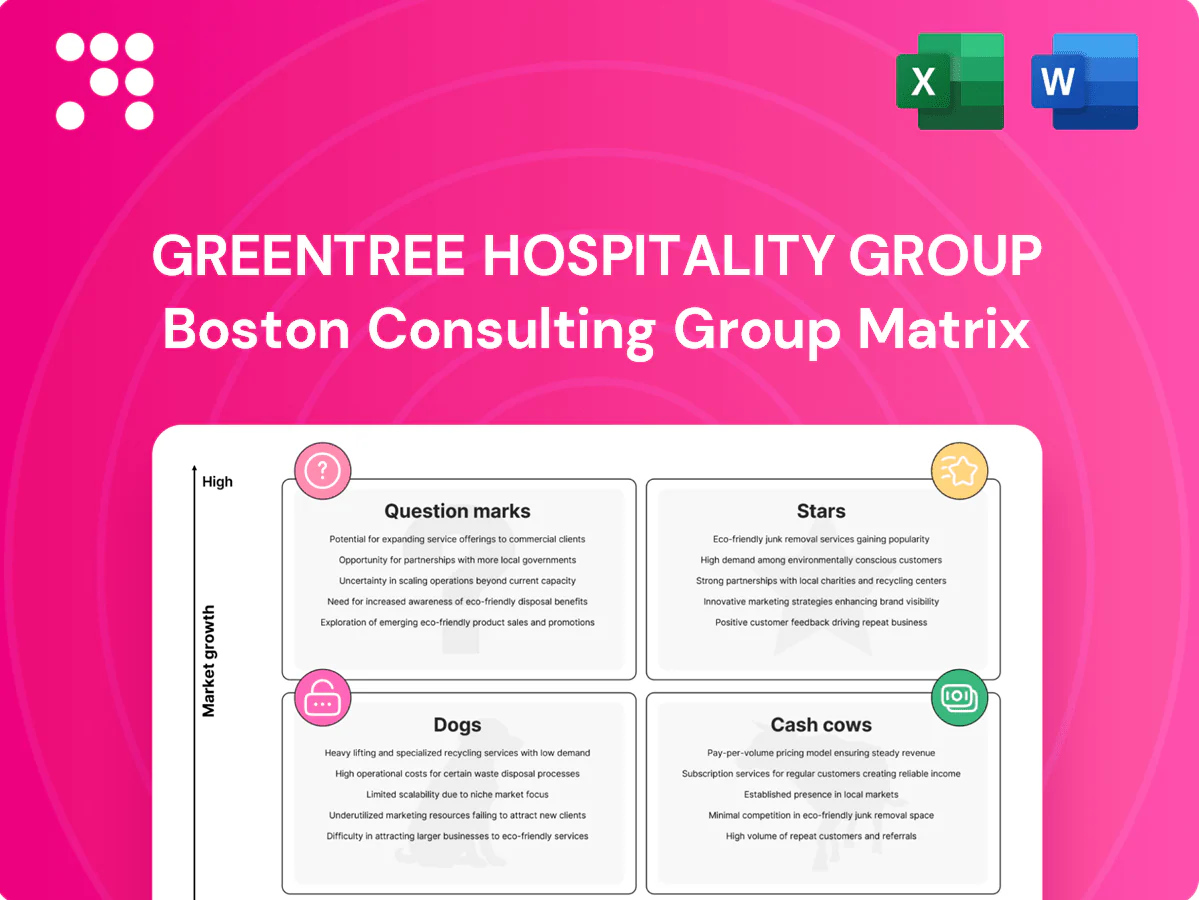
GreenTree Hospitality Group Boston Consulting Group Matrix

See the Bigger Picture
Looking at GreenTree Hospitality Group’s quick BCG snapshot, you’ll spot where their brands are gaining heat, which ones saddle steady cash flow, and which need tough calls — fast. This preview teases quadrant placements and market signals, but the full BCG Matrix gives you the granular placements, revenue and growth figures, and concrete moves to make. Buy the complete report for a Word brief plus an Excel summary and get a ready-to-use strategic tool that saves hours and points you to smart capital allocation. Purchase now and act with clarity.
Stars

Core economy–midscale brands
GreenTree’s flagship economy and midscale brands hold strong share across fast‑growing domestic corridors, supported by a dense network of over 4,000 hotels as of 2024. Standardized operations and unit density keep RevPAR and occupancy competitive versus peers. Management accelerated new signings in 2024 to defend the lead. With scale, these flags can mature into powerhouse cash engines.
Asset‑light franchise model
GreenTree’s asset‑light franchise model drives high‑margin growth with limited capital outlay, putting its network on a compounding path; the group reported over 4,000 hotels across China as of 2024. Owners receive standardized playbooks while GreenTree skims management and franchise fees, enabling rapid footprint expansion. The model scales fast in growth markets but still requires field support and sustained brand marketing. Continued reinvestment is needed to outpace copycats.

Direct digital booking & app
Direct digital booking & app are driving growth as mobile-led bookings now represent roughly half of bookings, reducing OTA take rates (typical 15–25%) and increasing repeat stays by an estimated 10–20%. Product updates and loyalty tie-ins keep conversion high, with in-app users converting at materially better rates. Current strategy burns cash in promotions and engineering but creates a valuable data loop. Maintain momentum while markets expand.

Loyalty program scale
Stars: Loyalty program scale drives lower acquisition cost and smoother seasonality as members fill rooms and shift stays into shoulder periods; cross-brand earn/burn keeps guests within GreenTree’s network as it expands. The model requires ongoing perks and CRM investment to remain sticky, but loyalty consistently lifts both rate and market share.
Tier 2–4 city expansion
Domestic travel demand outside top metros is still climbing; China recorded over 5 billion domestic trips in 2023 and 2024 momentum remains strong, favoring Tier 2–4 city growth for GreenTree in the BCG Stars quadrant.
First-mover density builds local moats and stronger owner economics through cluster effects; this requires aggressive franchise roll-out and hands-on ops coaching early to scale standards and margins.
Lock in these nodes now to capture share before demand normalization reduces unit-level economics.
- Market: rising domestic trips (5+ billion)
- Strategy: cluster-first franchising
- Execution: intensive ops coaching
- Timing: prioritize now to lock in nodes
4,000+ economy/midscale hotels, ~50% mobile bookings and +10–20% repeat lift
GreenTree’s Stars are high‑share, fast‑growing economy/midscale flags with 4,000+ hotels (2024), mobile bookings ~50% (2024) and loyalty-driven lower acquisition; OTA take rates 15–25% and repeat stays +10–20% improve unit economics, supported by 5+ billion domestic trips (2023) that favor Tier 2–4 expansion.
| Metric | Value |
|---|---|
| Hotels (2024) | 4,000+ |
| Mobile bookings (2024) | ~50% |
| Domestic trips (2023) | 5+ billion |
| OTA take rates | 15–25% |
| Repeat stays uplift | +10–20% |
What is included in the product
 Detailed Word Document
BCG Matrix of GreenTree Hospitality: clear quadrant breakdown with strategic moves—invest in Stars, optimize Cash Cows, review Question Marks, divest Dogs.

 Customizable Excel Spreadsheet
One-page BCG Matrix placing GreenTree units in quadrants for quick strategic clarity and export-ready sharing.
Cash Cows

Mature economy flags in saturated hubs
Mature hubs deliver stable occupancy around 70% and predictable ADR near RMB 250 in 2024, requiring low incremental promotions. These properties spin off steady franchise and management fees (typically 6–8% of room revenue) with minimal capex from GreenTree, often under 2% of revenues. High cash conversion (above 85–90%) lets the group milk cash flows while keeping quality audits tight.
Recurring franchise & management fees
Recurring franchise and management fees form contracted, predictable revenue for GreenTree, with delivery costs concentrated in support systems leading to high incremental margins as scale grows. With a network exceeding 2,600 hotels by 2024, centralised support tools have lifted unit economics and improved margins. Cash from these fees covers corporate overhead and funds selective growth bets while strict service SLAs keep churn low.

Centralized procurement programs
As of 2024, centralized procurement at GreenTree cuts owner supply costs by about 10% and generates rebate income roughly 2–3% of spend. Mature categories (linen, F&B staples) require minimal selling to franchisees. Incremental efficiency projects add 1–2 percentage points to yield, producing quiet, dependable cash every month.

Training and ops playbooks
Training and ops playbooks are cash cows: standardized curricula and audits cut operational variance and claims by up to 30% (2024 hospitality benchmark), while refresh costs typically run under 1% of annual revenue versus outsized benefits; fees and ancillary sales drop straight to margin, boosting EBITDA contribution. Keep curricula current but avoid overbuilding to preserve ROI.
- variance_reduction: up to 30% (2024)
- refresh_cost: <1% revenue
- ancillary_margin: direct to EBITDA
- guideline: stay lean, update annually
Corporate accounts & SME contracts
Locked-in corporate and SME contracts deliver weekday volume stability through negotiated rates, lowering revenue volatility and supporting predictable occupancy trends as corporate travel recovered to roughly 80–90% of 2019 levels in 2024 (GBTA).
Renewals carry materially lower acquisition cost than new business, making retention-focused spend more efficient and underpinning base pricing power for GreenTree.
Prioritize relationship management and service KPIs (on-time billing, SLA adherence, NPS) to protect this cash cow.
- locked-volume
- lower-renewal-costs
- weekday-stability
- pricing-support
- service-kpi-driven-retention
Mature hotels: ~70% occ, ADR RMB250, cash 85–90%
Mature hotels yield stable cash: ~70% occupancy, ADR ~RMB250 (2024), franchise/management fees 6–8% of room revenue and cash conversion ~85–90%, funding overhead and selective growth. Central procurement saves ~10% with 2–3% rebate; ops playbooks cut variance up to 30% while refresh costs <1% revenue.
| Metric | 2024 |
|---|---|
| Hotels | 2,600+ |
| Occupancy | ~70% |
| ADR | RMB250 |
| Fees | 6–8% |
| Cash conversion | 85–90% |
| Procurement saving | ~10% |
| Rebate | 2–3% |
| Variance reduction | up to 30% |
What You’re Viewing Is Included
GreenTree Hospitality Group BCG Matrix
The file you're previewing is the exact GreenTree Hospitality Group BCG Matrix you'll receive after purchase. No watermarks, no demo placeholders—just a polished, analysis-ready report built for strategic decision-making. Once bought, the full document is yours to download, edit, print, or present. It's formatted by experts for immediate use—no surprises, no extra work.

See the Bigger Picture
Looking at GreenTree Hospitality Group’s quick BCG snapshot, you’ll spot where their brands are gaining heat, which ones saddle steady cash flow, and which need tough calls — fast. This preview teases quadrant placements and market signals, but the full BCG Matrix gives you the granular placements, revenue and growth figures, and concrete moves to make. Buy the complete report for a Word brief plus an Excel summary and get a ready-to-use strategic tool that saves hours and points you to smart capital allocation. Purchase now and act with clarity.
Stars
Core economy–midscale brands
GreenTree’s flagship economy and midscale brands hold strong share across fast‑growing domestic corridors, supported by a dense network of over 4,000 hotels as of 2024. Standardized operations and unit density keep RevPAR and occupancy competitive versus peers. Management accelerated new signings in 2024 to defend the lead. With scale, these flags can mature into powerhouse cash engines.
Asset‑light franchise model
GreenTree’s asset‑light franchise model drives high‑margin growth with limited capital outlay, putting its network on a compounding path; the group reported over 4,000 hotels across China as of 2024. Owners receive standardized playbooks while GreenTree skims management and franchise fees, enabling rapid footprint expansion. The model scales fast in growth markets but still requires field support and sustained brand marketing. Continued reinvestment is needed to outpace copycats.
Direct digital booking & app
Direct digital booking & app are driving growth as mobile-led bookings now represent roughly half of bookings, reducing OTA take rates (typical 15–25%) and increasing repeat stays by an estimated 10–20%. Product updates and loyalty tie-ins keep conversion high, with in-app users converting at materially better rates. Current strategy burns cash in promotions and engineering but creates a valuable data loop. Maintain momentum while markets expand.
Loyalty program scale
Stars: Loyalty program scale drives lower acquisition cost and smoother seasonality as members fill rooms and shift stays into shoulder periods; cross-brand earn/burn keeps guests within GreenTree’s network as it expands. The model requires ongoing perks and CRM investment to remain sticky, but loyalty consistently lifts both rate and market share.
Tier 2–4 city expansion
Domestic travel demand outside top metros is still climbing; China recorded over 5 billion domestic trips in 2023 and 2024 momentum remains strong, favoring Tier 2–4 city growth for GreenTree in the BCG Stars quadrant.
First-mover density builds local moats and stronger owner economics through cluster effects; this requires aggressive franchise roll-out and hands-on ops coaching early to scale standards and margins.
Lock in these nodes now to capture share before demand normalization reduces unit-level economics.
- Market: rising domestic trips (5+ billion)
- Strategy: cluster-first franchising
- Execution: intensive ops coaching
- Timing: prioritize now to lock in nodes
4,000+ economy/midscale hotels, ~50% mobile bookings and +10–20% repeat lift
GreenTree’s Stars are high‑share, fast‑growing economy/midscale flags with 4,000+ hotels (2024), mobile bookings ~50% (2024) and loyalty-driven lower acquisition; OTA take rates 15–25% and repeat stays +10–20% improve unit economics, supported by 5+ billion domestic trips (2023) that favor Tier 2–4 expansion.
| Metric | Value |
|---|---|
| Hotels (2024) | 4,000+ |
| Mobile bookings (2024) | ~50% |
| Domestic trips (2023) | 5+ billion |
| OTA take rates | 15–25% |
| Repeat stays uplift | +10–20% |
What is included in the product
Detailed Word Document
BCG Matrix of GreenTree Hospitality: clear quadrant breakdown with strategic moves—invest in Stars, optimize Cash Cows, review Question Marks, divest Dogs.
Customizable Excel Spreadsheet
One-page BCG Matrix placing GreenTree units in quadrants for quick strategic clarity and export-ready sharing.
Cash Cows
Mature economy flags in saturated hubs
Mature hubs deliver stable occupancy around 70% and predictable ADR near RMB 250 in 2024, requiring low incremental promotions. These properties spin off steady franchise and management fees (typically 6–8% of room revenue) with minimal capex from GreenTree, often under 2% of revenues. High cash conversion (above 85–90%) lets the group milk cash flows while keeping quality audits tight.
Recurring franchise & management fees
Recurring franchise and management fees form contracted, predictable revenue for GreenTree, with delivery costs concentrated in support systems leading to high incremental margins as scale grows. With a network exceeding 2,600 hotels by 2024, centralised support tools have lifted unit economics and improved margins. Cash from these fees covers corporate overhead and funds selective growth bets while strict service SLAs keep churn low.
Centralized procurement programs
As of 2024, centralized procurement at GreenTree cuts owner supply costs by about 10% and generates rebate income roughly 2–3% of spend. Mature categories (linen, F&B staples) require minimal selling to franchisees. Incremental efficiency projects add 1–2 percentage points to yield, producing quiet, dependable cash every month.
Training and ops playbooks
Training and ops playbooks are cash cows: standardized curricula and audits cut operational variance and claims by up to 30% (2024 hospitality benchmark), while refresh costs typically run under 1% of annual revenue versus outsized benefits; fees and ancillary sales drop straight to margin, boosting EBITDA contribution. Keep curricula current but avoid overbuilding to preserve ROI.
- variance_reduction: up to 30% (2024)
- refresh_cost: <1% revenue
- ancillary_margin: direct to EBITDA
- guideline: stay lean, update annually
Corporate accounts & SME contracts
Locked-in corporate and SME contracts deliver weekday volume stability through negotiated rates, lowering revenue volatility and supporting predictable occupancy trends as corporate travel recovered to roughly 80–90% of 2019 levels in 2024 (GBTA).
Renewals carry materially lower acquisition cost than new business, making retention-focused spend more efficient and underpinning base pricing power for GreenTree.
Prioritize relationship management and service KPIs (on-time billing, SLA adherence, NPS) to protect this cash cow.
- locked-volume
- lower-renewal-costs
- weekday-stability
- pricing-support
- service-kpi-driven-retention
Mature hotels: ~70% occ, ADR RMB250, cash 85–90%
Mature hotels yield stable cash: ~70% occupancy, ADR ~RMB250 (2024), franchise/management fees 6–8% of room revenue and cash conversion ~85–90%, funding overhead and selective growth. Central procurement saves ~10% with 2–3% rebate; ops playbooks cut variance up to 30% while refresh costs <1% revenue.
| Metric | 2024 |
|---|---|
| Hotels | 2,600+ |
| Occupancy | ~70% |
| ADR | RMB250 |
| Fees | 6–8% |
| Cash conversion | 85–90% |
| Procurement saving | ~10% |
| Rebate | 2–3% |
| Variance reduction | up to 30% |
What You’re Viewing Is Included
GreenTree Hospitality Group BCG Matrix
The file you're previewing is the exact GreenTree Hospitality Group BCG Matrix you'll receive after purchase. No watermarks, no demo placeholders—just a polished, analysis-ready report built for strategic decision-making. Once bought, the full document is yours to download, edit, print, or present. It's formatted by experts for immediate use—no surprises, no extra work.
Original: $10.00
-65%$10.00
$3.50Description
See the Bigger Picture
Looking at GreenTree Hospitality Group’s quick BCG snapshot, you’ll spot where their brands are gaining heat, which ones saddle steady cash flow, and which need tough calls — fast. This preview teases quadrant placements and market signals, but the full BCG Matrix gives you the granular placements, revenue and growth figures, and concrete moves to make. Buy the complete report for a Word brief plus an Excel summary and get a ready-to-use strategic tool that saves hours and points you to smart capital allocation. Purchase now and act with clarity.
Stars
Core economy–midscale brands
GreenTree’s flagship economy and midscale brands hold strong share across fast‑growing domestic corridors, supported by a dense network of over 4,000 hotels as of 2024. Standardized operations and unit density keep RevPAR and occupancy competitive versus peers. Management accelerated new signings in 2024 to defend the lead. With scale, these flags can mature into powerhouse cash engines.
Asset‑light franchise model
GreenTree’s asset‑light franchise model drives high‑margin growth with limited capital outlay, putting its network on a compounding path; the group reported over 4,000 hotels across China as of 2024. Owners receive standardized playbooks while GreenTree skims management and franchise fees, enabling rapid footprint expansion. The model scales fast in growth markets but still requires field support and sustained brand marketing. Continued reinvestment is needed to outpace copycats.
Direct digital booking & app
Direct digital booking & app are driving growth as mobile-led bookings now represent roughly half of bookings, reducing OTA take rates (typical 15–25%) and increasing repeat stays by an estimated 10–20%. Product updates and loyalty tie-ins keep conversion high, with in-app users converting at materially better rates. Current strategy burns cash in promotions and engineering but creates a valuable data loop. Maintain momentum while markets expand.
Loyalty program scale
Stars: Loyalty program scale drives lower acquisition cost and smoother seasonality as members fill rooms and shift stays into shoulder periods; cross-brand earn/burn keeps guests within GreenTree’s network as it expands. The model requires ongoing perks and CRM investment to remain sticky, but loyalty consistently lifts both rate and market share.
Tier 2–4 city expansion
Domestic travel demand outside top metros is still climbing; China recorded over 5 billion domestic trips in 2023 and 2024 momentum remains strong, favoring Tier 2–4 city growth for GreenTree in the BCG Stars quadrant.
First-mover density builds local moats and stronger owner economics through cluster effects; this requires aggressive franchise roll-out and hands-on ops coaching early to scale standards and margins.
Lock in these nodes now to capture share before demand normalization reduces unit-level economics.
- Market: rising domestic trips (5+ billion)
- Strategy: cluster-first franchising
- Execution: intensive ops coaching
- Timing: prioritize now to lock in nodes
4,000+ economy/midscale hotels, ~50% mobile bookings and +10–20% repeat lift
GreenTree’s Stars are high‑share, fast‑growing economy/midscale flags with 4,000+ hotels (2024), mobile bookings ~50% (2024) and loyalty-driven lower acquisition; OTA take rates 15–25% and repeat stays +10–20% improve unit economics, supported by 5+ billion domestic trips (2023) that favor Tier 2–4 expansion.
| Metric | Value |
|---|---|
| Hotels (2024) | 4,000+ |
| Mobile bookings (2024) | ~50% |
| Domestic trips (2023) | 5+ billion |
| OTA take rates | 15–25% |
| Repeat stays uplift | +10–20% |
What is included in the product
Detailed Word Document
BCG Matrix of GreenTree Hospitality: clear quadrant breakdown with strategic moves—invest in Stars, optimize Cash Cows, review Question Marks, divest Dogs.
Customizable Excel Spreadsheet
One-page BCG Matrix placing GreenTree units in quadrants for quick strategic clarity and export-ready sharing.
Cash Cows
Mature economy flags in saturated hubs
Mature hubs deliver stable occupancy around 70% and predictable ADR near RMB 250 in 2024, requiring low incremental promotions. These properties spin off steady franchise and management fees (typically 6–8% of room revenue) with minimal capex from GreenTree, often under 2% of revenues. High cash conversion (above 85–90%) lets the group milk cash flows while keeping quality audits tight.
Recurring franchise & management fees
Recurring franchise and management fees form contracted, predictable revenue for GreenTree, with delivery costs concentrated in support systems leading to high incremental margins as scale grows. With a network exceeding 2,600 hotels by 2024, centralised support tools have lifted unit economics and improved margins. Cash from these fees covers corporate overhead and funds selective growth bets while strict service SLAs keep churn low.
Centralized procurement programs
As of 2024, centralized procurement at GreenTree cuts owner supply costs by about 10% and generates rebate income roughly 2–3% of spend. Mature categories (linen, F&B staples) require minimal selling to franchisees. Incremental efficiency projects add 1–2 percentage points to yield, producing quiet, dependable cash every month.
Training and ops playbooks
Training and ops playbooks are cash cows: standardized curricula and audits cut operational variance and claims by up to 30% (2024 hospitality benchmark), while refresh costs typically run under 1% of annual revenue versus outsized benefits; fees and ancillary sales drop straight to margin, boosting EBITDA contribution. Keep curricula current but avoid overbuilding to preserve ROI.
- variance_reduction: up to 30% (2024)
- refresh_cost: <1% revenue
- ancillary_margin: direct to EBITDA
- guideline: stay lean, update annually
Corporate accounts & SME contracts
Locked-in corporate and SME contracts deliver weekday volume stability through negotiated rates, lowering revenue volatility and supporting predictable occupancy trends as corporate travel recovered to roughly 80–90% of 2019 levels in 2024 (GBTA).
Renewals carry materially lower acquisition cost than new business, making retention-focused spend more efficient and underpinning base pricing power for GreenTree.
Prioritize relationship management and service KPIs (on-time billing, SLA adherence, NPS) to protect this cash cow.
- locked-volume
- lower-renewal-costs
- weekday-stability
- pricing-support
- service-kpi-driven-retention
Mature hotels: ~70% occ, ADR RMB250, cash 85–90%
Mature hotels yield stable cash: ~70% occupancy, ADR ~RMB250 (2024), franchise/management fees 6–8% of room revenue and cash conversion ~85–90%, funding overhead and selective growth. Central procurement saves ~10% with 2–3% rebate; ops playbooks cut variance up to 30% while refresh costs <1% revenue.
| Metric | 2024 |
|---|---|
| Hotels | 2,600+ |
| Occupancy | ~70% |
| ADR | RMB250 |
| Fees | 6–8% |
| Cash conversion | 85–90% |
| Procurement saving | ~10% |
| Rebate | 2–3% |
| Variance reduction | up to 30% |
What You’re Viewing Is Included
GreenTree Hospitality Group BCG Matrix
The file you're previewing is the exact GreenTree Hospitality Group BCG Matrix you'll receive after purchase. No watermarks, no demo placeholders—just a polished, analysis-ready report built for strategic decision-making. Once bought, the full document is yours to download, edit, print, or present. It's formatted by experts for immediate use—no surprises, no extra work.











