A10 Porter's Five Forces Analysis

From Overview to Strategy Blueprint
A10’s Porter's Five Forces snapshot highlights competitive intensity, supplier and buyer leverage, substitute risks, and entry barriers shaping its market position. This brief overview teases strategic risks and opportunities—buy the full analysis for force-by-force ratings, visuals, and actionable recommendations to inform investment or strategy.
Suppliers Bargaining Power

Concentrated semiconductor and NIC providers
Specialized chips, NICs and high-performance components come from a concentrated set of vendors, with the top three NIC/switch silicon suppliers supplying over half the market in 2024, boosting supplier leverage on pricing and lead times. Supply disruptions in 2024 continued to delay appliance deliveries and compress margins by weeks to months. Long-term agreements and multi-sourcing help, but switching core silicon remains costly and slows product refresh cycles.
Contract manufacturers and ODM dependencies
A10 depends on contract manufacturers and ODMs for appliance assembly, exposing it to capacity allocation and MOQ constraints that can delay shipments. Quality, yield and logistics performance at partners directly affect customer SLA compliance and return costs. Dual-sourcing and standardized designs lower dependency but requalification and ramping add time and cost. Geographic concentration of suppliers heightens geopolitical and freight risks.

Cloud infrastructure and marketplace partners
Delivering multi-cloud solutions requires alignment with AWS (≈31% IaaS market share 2024), Azure (≈23%) and GCP (≈11%), which control APIs, roadmap pace and marketplace commissions often up to ~20%, concentrating supplier power. Rapid cloud-native feature changes can compress pricing and erode differentiation, while co-selling with platform partners expands reach but makes vendors vulnerable to sudden policy shifts that increase partner leverage. Maintaining certifications (SOC 2, ISO 27001, cloud vendor certs) adds recurring compliance costs often in the low five-figure range annually, sustaining supplier dependence.

Threat intelligence and software stack suppliers
Third-party threat feeds, SDKs, and libraries determine security efficacy and time-to-market; in 2024 the threat intelligence market was roughly USD 5 billion, making license terms, data quality, and update cadence major cost and performance levers. Vendor consolidation among feed providers has tightened pricing power, while building in-house intelligence requires significant engineering investment and specialist expertise.
- Feeds: data quality & cadence
- Licenses: cost exposure
- Consolidation: pricing pressure
- In-house: high CAPEX/OPEX
Proprietary firmware and support tooling
Specialized diagnostics, testing, and firmware toolchains are often owned by niche vendors, creating limited alternatives that raise switching costs and recurring support fees; deprecation of a toolchain can force costly redesigns or extended support contracts, so negotiating enterprise-wide agreements helps cap escalation and ensure predictable pricing.
- Vendor lock-in
- Higher switching costs
- Support fee exposure
- Contract negotiation mitigates risk
Concentrated silicon >50% and top cloud share 31% squeeze margins
Concentrated silicon/NIC suppliers (top-3 >50% share in 2024) and ODM capacity constraints give suppliers strong pricing and lead-time leverage, compressing margins. Cloud dependence (AWS 31%, Azure 23%, GCP 11% in 2024) adds platform fee and roadmap risk. Threat-intel market ~$5B (2024) and niche toolchains raise switching costs and recurring support spend.
| Supplier | 2024 metric | Impact |
|---|---|---|
| Silicon/NIC | Top-3 >50% share | Price/lead-time power |
| Cloud | AWS31%/AZ23%/GCP11% | Fee/roadmap risk |
| Threat intel | $5B market | Licensing cost |
| Toolchains | Niche vendors | High switch cost |
What is included in the product
 Detailed Word Document
Tailored Porter's Five Forces for A10, uncovering competitive intensity, buyer/supplier power, threat of new entrants and substitutes, plus disruptive risks and protective market dynamics—ready for inclusion in reports or editable Word templates.

 Customizable Excel Spreadsheet
Clear, one-sheet Porter's Five Forces tailored to A10—instantly pinpoints competitive pain points and strategic levers for faster decisions. Customize pressure levels, swap data and export clean visuals for decks or dashboards without macros or finance jargon.
Customers Bargaining Power

Large enterprises and service providers with scale
Major buyers run competitive RFPs, demanding 10–30% volume discounts, published feature roadmaps and stringent SLAs (99.9–99.99% uptime); consolidation among carriers and large enterprises compresses margins and forces custom integrations. Multi-year deals (commonly 3–5 years) provide revenue predictability but require concessions, while referenceability and upsell typically boost lifetime value by ~15–25%, partly offsetting price pressure.
High switching costs but multi-vendor strategies
Configurations, security policies, and operational playbooks create strong switching friction for A10 customers. Yet 2024 Flexera data shows 92% of enterprises run multi-cloud/multi-vendor strategies, so many keep dual vendors for resilience and leverage. Migration services and API compatibility reduce churn barriers. Renewal cycles become key pricing pressure points.

Performance and compliance sensitivity
Buyers of A10’s solutions prioritize low latency and high throughput plus certified compliance for regulated workloads, which in 2024 kept price elasticity low as many regulated customers accepted premiums to avoid risk. Proof-of-value testing and benchmarks can commoditize features when rivals meet thresholds, driving buying decisions toward measurable metrics. Strong third-party audits and published benchmarks—cited in 2024 vendor comparisons—increase switching costs and bolster A10’s negotiating leverage.

Preference for flexible consumption models
Customers increasingly demand subscriptions, term licenses and cloud marketplace billing; by 2024 roughly 85% of enterprises prioritized OPEX-smoothed models, shifting elastic scaling and metered usage risk onto vendors and compressing vendor margins. Transparent TCO analyses and migration credits became purchase drivers; misaligned pricing models amplify buyer power and increase churn and negotiation leverage.
- Subscription preference: 85% enterprises (2024)
- Elastic/metered risk shifts to vendors
- Transparent TCO & migration credits influence deals
- Pricing misalignment elevates buyer bargaining power
Influence of channel and MSPs
Resellers and MSPs aggregate end-customer demand and package A10 solutions into bundles; their recommendations can decisively tilt vendor selection and pricing. IDC 2024 finds channel influence around 70% of enterprise tech buys, amplifying partner sway over procurement. A10’s margin structures, enablement and deal registration terms directly shape partner access and competitiveness; robust partner programs reduce downstream buyer leverage.
- Partner-driven bundles steer vendor choice
- ~70% channel influence (IDC 2024)
- Margins, enablement, deal registration = access levers
- Strong partner programs lower buyer bargaining power
Buyers extract 10-30% discounts, insist on 99.9-99.99% SLAs
Major buyers run RFPs demanding 10–30% discounts and 99.9–99.99% SLAs; multi-year deals (3–5 yrs) give predictability but force concessions.
Switching friction from configs and audits exists, yet 92% of enterprises use multi-cloud (Flexera 2024), preserving dual vendors and buyer leverage.
Subscription preference (~85% enterprises 2024) and channel influence (~70% IDC 2024) shift pricing power toward buyers.
| Metric | 2024 Value |
|---|---|
| Multi-cloud | 92% |
| Subscription preference | 85% |
| Channel influence | 70% |
Same Document Delivered
A10 Porter's Five Forces Analysis
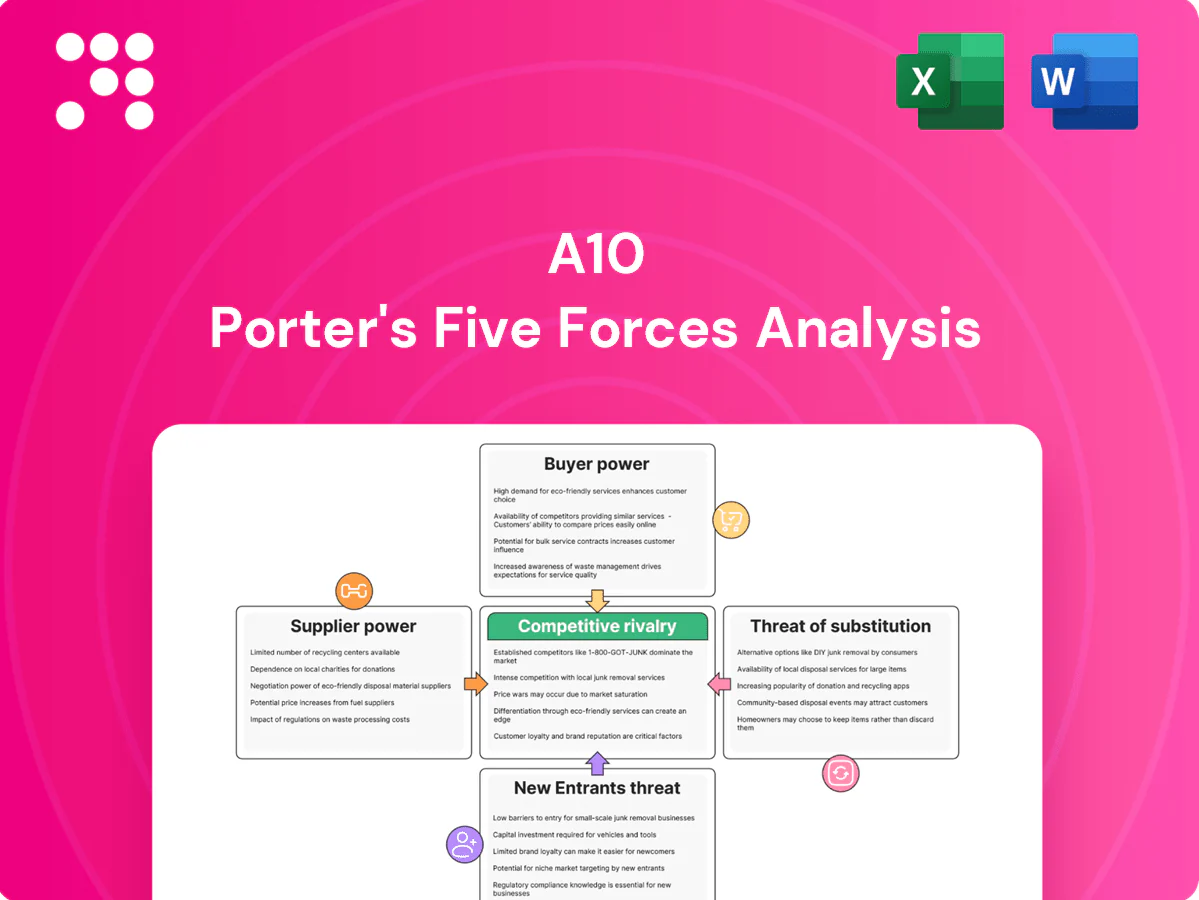
This preview shows the exact A10 Porter's Five Forces Analysis you'll receive—fully formatted, professionally written, and ready for immediate use. No placeholders, mockups, or samples—what you see is the deliverable. After purchase you’ll get instant access to this same complete file.

From Overview to Strategy Blueprint
A10’s Porter's Five Forces snapshot highlights competitive intensity, supplier and buyer leverage, substitute risks, and entry barriers shaping its market position. This brief overview teases strategic risks and opportunities—buy the full analysis for force-by-force ratings, visuals, and actionable recommendations to inform investment or strategy.
Suppliers Bargaining Power
Concentrated semiconductor and NIC providers
Specialized chips, NICs and high-performance components come from a concentrated set of vendors, with the top three NIC/switch silicon suppliers supplying over half the market in 2024, boosting supplier leverage on pricing and lead times. Supply disruptions in 2024 continued to delay appliance deliveries and compress margins by weeks to months. Long-term agreements and multi-sourcing help, but switching core silicon remains costly and slows product refresh cycles.
Contract manufacturers and ODM dependencies
A10 depends on contract manufacturers and ODMs for appliance assembly, exposing it to capacity allocation and MOQ constraints that can delay shipments. Quality, yield and logistics performance at partners directly affect customer SLA compliance and return costs. Dual-sourcing and standardized designs lower dependency but requalification and ramping add time and cost. Geographic concentration of suppliers heightens geopolitical and freight risks.
Cloud infrastructure and marketplace partners
Delivering multi-cloud solutions requires alignment with AWS (≈31% IaaS market share 2024), Azure (≈23%) and GCP (≈11%), which control APIs, roadmap pace and marketplace commissions often up to ~20%, concentrating supplier power. Rapid cloud-native feature changes can compress pricing and erode differentiation, while co-selling with platform partners expands reach but makes vendors vulnerable to sudden policy shifts that increase partner leverage. Maintaining certifications (SOC 2, ISO 27001, cloud vendor certs) adds recurring compliance costs often in the low five-figure range annually, sustaining supplier dependence.
Threat intelligence and software stack suppliers
Third-party threat feeds, SDKs, and libraries determine security efficacy and time-to-market; in 2024 the threat intelligence market was roughly USD 5 billion, making license terms, data quality, and update cadence major cost and performance levers. Vendor consolidation among feed providers has tightened pricing power, while building in-house intelligence requires significant engineering investment and specialist expertise.
- Feeds: data quality & cadence
- Licenses: cost exposure
- Consolidation: pricing pressure
- In-house: high CAPEX/OPEX
Proprietary firmware and support tooling
Specialized diagnostics, testing, and firmware toolchains are often owned by niche vendors, creating limited alternatives that raise switching costs and recurring support fees; deprecation of a toolchain can force costly redesigns or extended support contracts, so negotiating enterprise-wide agreements helps cap escalation and ensure predictable pricing.
- Vendor lock-in
- Higher switching costs
- Support fee exposure
- Contract negotiation mitigates risk
Concentrated silicon >50% and top cloud share 31% squeeze margins
Concentrated silicon/NIC suppliers (top-3 >50% share in 2024) and ODM capacity constraints give suppliers strong pricing and lead-time leverage, compressing margins. Cloud dependence (AWS 31%, Azure 23%, GCP 11% in 2024) adds platform fee and roadmap risk. Threat-intel market ~$5B (2024) and niche toolchains raise switching costs and recurring support spend.
| Supplier | 2024 metric | Impact |
|---|---|---|
| Silicon/NIC | Top-3 >50% share | Price/lead-time power |
| Cloud | AWS31%/AZ23%/GCP11% | Fee/roadmap risk |
| Threat intel | $5B market | Licensing cost |
| Toolchains | Niche vendors | High switch cost |
What is included in the product
Detailed Word Document
Tailored Porter's Five Forces for A10, uncovering competitive intensity, buyer/supplier power, threat of new entrants and substitutes, plus disruptive risks and protective market dynamics—ready for inclusion in reports or editable Word templates.
Customizable Excel Spreadsheet
Clear, one-sheet Porter's Five Forces tailored to A10—instantly pinpoints competitive pain points and strategic levers for faster decisions. Customize pressure levels, swap data and export clean visuals for decks or dashboards without macros or finance jargon.
Customers Bargaining Power
Large enterprises and service providers with scale
Major buyers run competitive RFPs, demanding 10–30% volume discounts, published feature roadmaps and stringent SLAs (99.9–99.99% uptime); consolidation among carriers and large enterprises compresses margins and forces custom integrations. Multi-year deals (commonly 3–5 years) provide revenue predictability but require concessions, while referenceability and upsell typically boost lifetime value by ~15–25%, partly offsetting price pressure.
High switching costs but multi-vendor strategies
Configurations, security policies, and operational playbooks create strong switching friction for A10 customers. Yet 2024 Flexera data shows 92% of enterprises run multi-cloud/multi-vendor strategies, so many keep dual vendors for resilience and leverage. Migration services and API compatibility reduce churn barriers. Renewal cycles become key pricing pressure points.
Performance and compliance sensitivity
Buyers of A10’s solutions prioritize low latency and high throughput plus certified compliance for regulated workloads, which in 2024 kept price elasticity low as many regulated customers accepted premiums to avoid risk. Proof-of-value testing and benchmarks can commoditize features when rivals meet thresholds, driving buying decisions toward measurable metrics. Strong third-party audits and published benchmarks—cited in 2024 vendor comparisons—increase switching costs and bolster A10’s negotiating leverage.
Preference for flexible consumption models
Customers increasingly demand subscriptions, term licenses and cloud marketplace billing; by 2024 roughly 85% of enterprises prioritized OPEX-smoothed models, shifting elastic scaling and metered usage risk onto vendors and compressing vendor margins. Transparent TCO analyses and migration credits became purchase drivers; misaligned pricing models amplify buyer power and increase churn and negotiation leverage.
- Subscription preference: 85% enterprises (2024)
- Elastic/metered risk shifts to vendors
- Transparent TCO & migration credits influence deals
- Pricing misalignment elevates buyer bargaining power
Influence of channel and MSPs
Resellers and MSPs aggregate end-customer demand and package A10 solutions into bundles; their recommendations can decisively tilt vendor selection and pricing. IDC 2024 finds channel influence around 70% of enterprise tech buys, amplifying partner sway over procurement. A10’s margin structures, enablement and deal registration terms directly shape partner access and competitiveness; robust partner programs reduce downstream buyer leverage.
- Partner-driven bundles steer vendor choice
- ~70% channel influence (IDC 2024)
- Margins, enablement, deal registration = access levers
- Strong partner programs lower buyer bargaining power
Buyers extract 10-30% discounts, insist on 99.9-99.99% SLAs
Major buyers run RFPs demanding 10–30% discounts and 99.9–99.99% SLAs; multi-year deals (3–5 yrs) give predictability but force concessions.
Switching friction from configs and audits exists, yet 92% of enterprises use multi-cloud (Flexera 2024), preserving dual vendors and buyer leverage.
Subscription preference (~85% enterprises 2024) and channel influence (~70% IDC 2024) shift pricing power toward buyers.
| Metric | 2024 Value |
|---|---|
| Multi-cloud | 92% |
| Subscription preference | 85% |
| Channel influence | 70% |
Same Document Delivered
A10 Porter's Five Forces Analysis
This preview shows the exact A10 Porter's Five Forces Analysis you'll receive—fully formatted, professionally written, and ready for immediate use. No placeholders, mockups, or samples—what you see is the deliverable. After purchase you’ll get instant access to this same complete file.
Description
From Overview to Strategy Blueprint
A10’s Porter's Five Forces snapshot highlights competitive intensity, supplier and buyer leverage, substitute risks, and entry barriers shaping its market position. This brief overview teases strategic risks and opportunities—buy the full analysis for force-by-force ratings, visuals, and actionable recommendations to inform investment or strategy.
Suppliers Bargaining Power
Concentrated semiconductor and NIC providers
Specialized chips, NICs and high-performance components come from a concentrated set of vendors, with the top three NIC/switch silicon suppliers supplying over half the market in 2024, boosting supplier leverage on pricing and lead times. Supply disruptions in 2024 continued to delay appliance deliveries and compress margins by weeks to months. Long-term agreements and multi-sourcing help, but switching core silicon remains costly and slows product refresh cycles.
Contract manufacturers and ODM dependencies
A10 depends on contract manufacturers and ODMs for appliance assembly, exposing it to capacity allocation and MOQ constraints that can delay shipments. Quality, yield and logistics performance at partners directly affect customer SLA compliance and return costs. Dual-sourcing and standardized designs lower dependency but requalification and ramping add time and cost. Geographic concentration of suppliers heightens geopolitical and freight risks.
Cloud infrastructure and marketplace partners
Delivering multi-cloud solutions requires alignment with AWS (≈31% IaaS market share 2024), Azure (≈23%) and GCP (≈11%), which control APIs, roadmap pace and marketplace commissions often up to ~20%, concentrating supplier power. Rapid cloud-native feature changes can compress pricing and erode differentiation, while co-selling with platform partners expands reach but makes vendors vulnerable to sudden policy shifts that increase partner leverage. Maintaining certifications (SOC 2, ISO 27001, cloud vendor certs) adds recurring compliance costs often in the low five-figure range annually, sustaining supplier dependence.
Threat intelligence and software stack suppliers
Third-party threat feeds, SDKs, and libraries determine security efficacy and time-to-market; in 2024 the threat intelligence market was roughly USD 5 billion, making license terms, data quality, and update cadence major cost and performance levers. Vendor consolidation among feed providers has tightened pricing power, while building in-house intelligence requires significant engineering investment and specialist expertise.
- Feeds: data quality & cadence
- Licenses: cost exposure
- Consolidation: pricing pressure
- In-house: high CAPEX/OPEX
Proprietary firmware and support tooling
Specialized diagnostics, testing, and firmware toolchains are often owned by niche vendors, creating limited alternatives that raise switching costs and recurring support fees; deprecation of a toolchain can force costly redesigns or extended support contracts, so negotiating enterprise-wide agreements helps cap escalation and ensure predictable pricing.
- Vendor lock-in
- Higher switching costs
- Support fee exposure
- Contract negotiation mitigates risk
Concentrated silicon >50% and top cloud share 31% squeeze margins
Concentrated silicon/NIC suppliers (top-3 >50% share in 2024) and ODM capacity constraints give suppliers strong pricing and lead-time leverage, compressing margins. Cloud dependence (AWS 31%, Azure 23%, GCP 11% in 2024) adds platform fee and roadmap risk. Threat-intel market ~$5B (2024) and niche toolchains raise switching costs and recurring support spend.
| Supplier | 2024 metric | Impact |
|---|---|---|
| Silicon/NIC | Top-3 >50% share | Price/lead-time power |
| Cloud | AWS31%/AZ23%/GCP11% | Fee/roadmap risk |
| Threat intel | $5B market | Licensing cost |
| Toolchains | Niche vendors | High switch cost |
What is included in the product
Detailed Word Document
Tailored Porter's Five Forces for A10, uncovering competitive intensity, buyer/supplier power, threat of new entrants and substitutes, plus disruptive risks and protective market dynamics—ready for inclusion in reports or editable Word templates.
Customizable Excel Spreadsheet
Clear, one-sheet Porter's Five Forces tailored to A10—instantly pinpoints competitive pain points and strategic levers for faster decisions. Customize pressure levels, swap data and export clean visuals for decks or dashboards without macros or finance jargon.
Customers Bargaining Power
Large enterprises and service providers with scale
Major buyers run competitive RFPs, demanding 10–30% volume discounts, published feature roadmaps and stringent SLAs (99.9–99.99% uptime); consolidation among carriers and large enterprises compresses margins and forces custom integrations. Multi-year deals (commonly 3–5 years) provide revenue predictability but require concessions, while referenceability and upsell typically boost lifetime value by ~15–25%, partly offsetting price pressure.
High switching costs but multi-vendor strategies
Configurations, security policies, and operational playbooks create strong switching friction for A10 customers. Yet 2024 Flexera data shows 92% of enterprises run multi-cloud/multi-vendor strategies, so many keep dual vendors for resilience and leverage. Migration services and API compatibility reduce churn barriers. Renewal cycles become key pricing pressure points.
Performance and compliance sensitivity
Buyers of A10’s solutions prioritize low latency and high throughput plus certified compliance for regulated workloads, which in 2024 kept price elasticity low as many regulated customers accepted premiums to avoid risk. Proof-of-value testing and benchmarks can commoditize features when rivals meet thresholds, driving buying decisions toward measurable metrics. Strong third-party audits and published benchmarks—cited in 2024 vendor comparisons—increase switching costs and bolster A10’s negotiating leverage.
Preference for flexible consumption models
Customers increasingly demand subscriptions, term licenses and cloud marketplace billing; by 2024 roughly 85% of enterprises prioritized OPEX-smoothed models, shifting elastic scaling and metered usage risk onto vendors and compressing vendor margins. Transparent TCO analyses and migration credits became purchase drivers; misaligned pricing models amplify buyer power and increase churn and negotiation leverage.
- Subscription preference: 85% enterprises (2024)
- Elastic/metered risk shifts to vendors
- Transparent TCO & migration credits influence deals
- Pricing misalignment elevates buyer bargaining power
Influence of channel and MSPs
Resellers and MSPs aggregate end-customer demand and package A10 solutions into bundles; their recommendations can decisively tilt vendor selection and pricing. IDC 2024 finds channel influence around 70% of enterprise tech buys, amplifying partner sway over procurement. A10’s margin structures, enablement and deal registration terms directly shape partner access and competitiveness; robust partner programs reduce downstream buyer leverage.
- Partner-driven bundles steer vendor choice
- ~70% channel influence (IDC 2024)
- Margins, enablement, deal registration = access levers
- Strong partner programs lower buyer bargaining power
Buyers extract 10-30% discounts, insist on 99.9-99.99% SLAs
Major buyers run RFPs demanding 10–30% discounts and 99.9–99.99% SLAs; multi-year deals (3–5 yrs) give predictability but force concessions.
Switching friction from configs and audits exists, yet 92% of enterprises use multi-cloud (Flexera 2024), preserving dual vendors and buyer leverage.
Subscription preference (~85% enterprises 2024) and channel influence (~70% IDC 2024) shift pricing power toward buyers.
| Metric | 2024 Value |
|---|---|
| Multi-cloud | 92% |
| Subscription preference | 85% |
| Channel influence | 70% |
Same Document Delivered
A10 Porter's Five Forces Analysis
This preview shows the exact A10 Porter's Five Forces Analysis you'll receive—fully formatted, professionally written, and ready for immediate use. No placeholders, mockups, or samples—what you see is the deliverable. After purchase you’ll get instant access to this same complete file.











