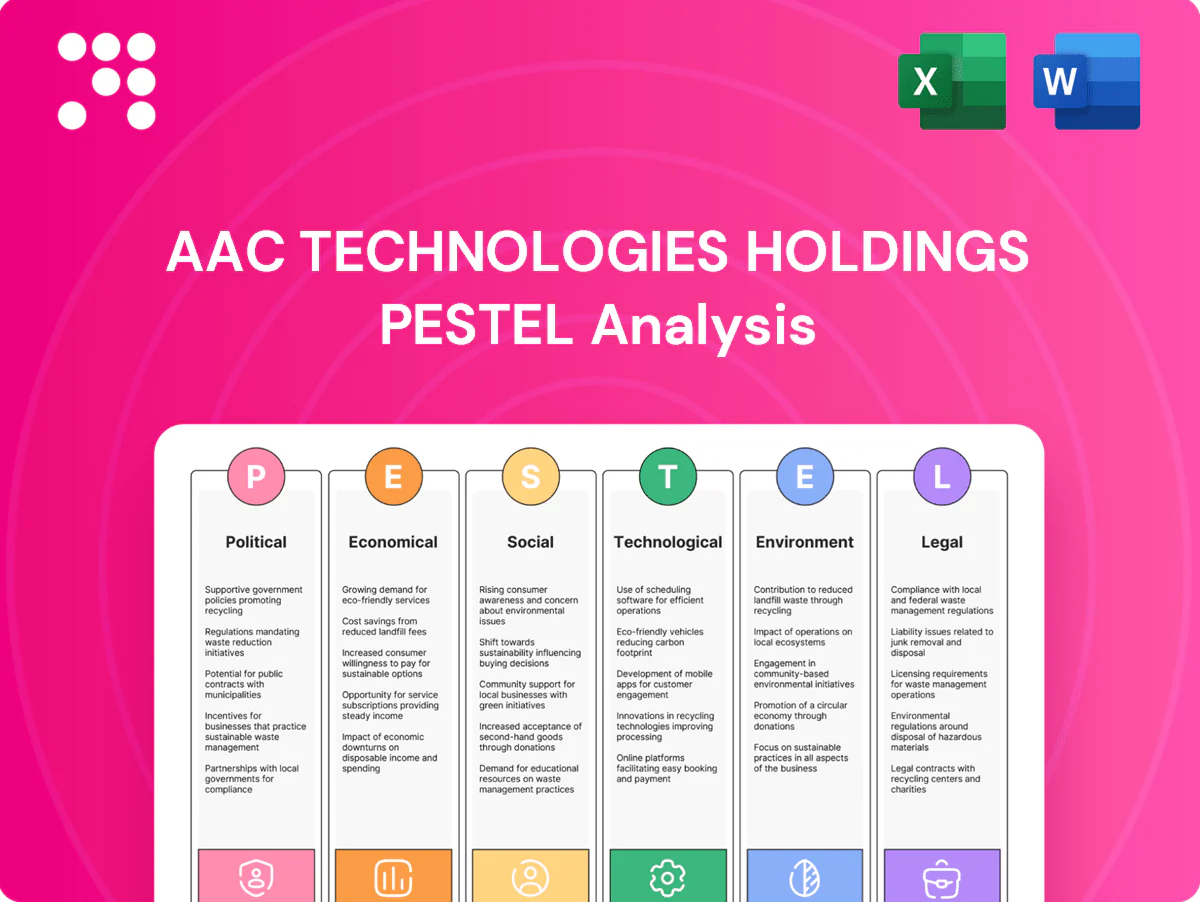
AAC Technologies Holdings PESTLE Analysis

Plan Smarter. Present Sharper. Compete Stronger.
Unlock how political shifts, economic cycles, and rapid tech innovation are reshaping AAC Technologies Holdings and its market position. Our concise PESTLE snapshot highlights regulatory risks, supply-chain pressures, and ESG trends investors and strategists must know. Purchase the full analysis for a detailed, actionable roadmap to inform decisions and spot opportunity.
Political factors

US–China tech tensions
Geopolitical frictions between the US and China risk disrupting AAC Technologies' access to advanced tools, IP, and customers as US-led export controls since 2022 limit advanced semiconductors and equipment. The 2022 CHIPS Act provides about 52 billion USD in US subsidy/backing, and tightened controls in 2022–24 may slow MEMS and optics roadmaps. Clients diversifying supply chains could reallocate orders across regions, while diplomatic shifts can rapidly alter compliance burdens and costs.
Industrial policies and subsidies
China's state and local incentives, involving tens of billions in state-backed funds, alongside the US CHIPS Act's $52.7 billion and the EU Chips Act's ~€43 billion, materially shift site selection for AAC Technologies' MEMS and optics fabs. Grants and tax breaks available under these programs can materially lower upfront capex for new lines. Local content rules in major markets encourage co-location with OEMs. Long-term ROI hinges on policy stability and enforcement.

Tariffs and customs barriers
Variable tariffs, including US Section 301 levies of up to 25% on certain Chinese imports, directly squeeze AAC Technologies’ pricing and gross margins on speaker, mic and actuator components. Rules-of-origin provisions (e.g., EU/US customs regimes) complicate cross-border smartphone and wearable assemblies by determining duty liability for final goods. Customs delays—highlighted by elevated container dwell times in 2021–22 versus pre-pandemic norms—can disrupt OEM just-in-time ramps, so hedging production locations across APAC/EU lowers duty exposure and supply-risk concentration.

Localization and security reviews
Localization and multi-jurisdictional data and supply-chain security reviews increase documentation and audit burdens for AAC Technologies (stock code 2018.HK), raising compliance costs and time to market.
Government procurement often favors domestic suppliers and sensitive acoustic/semiconductor components can trigger national security screenings in key markets.
Robust corporate governance and documented security controls help AAC clear regulatory gates and sustain export access.
- 2018.HK
- increased audits
- procurement bias
- security screenings
- governance mitigates risk
Political stability in manufacturing hubs
Operational continuity for AAC depends on political stability across China and ASEAN manufacturing sites, where unrest or policy shifts can halt production. Changes in labor, energy, and logistics regulation directly alter cost baselines and margin projections. Infrastructure investment levels influence lead times and yield ramp; contingency planning reduces disruption risk.
- Risk: China/ASEAN stability
- Cost drivers: labor, energy, logistics policy
- Supply impact: infrastructure → lead times, yield
- Mitigation: contingency planning
Export controls, CHIPS incentives and tariffs heighten supply-chain and plant continuity risk
Geopolitical US–China frictions and US-led export controls since 2022 risk limiting AAC Technologies (2018.HK) access to advanced tools and customers; US CHIPS Act $52.7B and EU Chips Act ~€43B shift fab incentives. Tariffs (Section 301 up to 25%) and localization rules raise costs and compliance; multi-jurisdiction audits increase time-to-market. Political stability in China/ASEAN affects plant continuity, with contingency planning essential.
| Metric | Value |
|---|---|
| US CHIPS Act | $52.7B |
| EU Chips Act | ~€43B |
| Section 301 Tariff | up to 25% |
| Ticker | 2018.HK |
What is included in the product
 Detailed Word Document
Explores how macro-environmental factors uniquely affect AAC Technologies Holdings across Political, Economic, Social, Technological, Environmental and Legal dimensions, with data-driven trends tied to the consumer electronics supply chain and Greater China market; designed to help executives and investors identify risks, opportunities and scenario-driven strategies.

 Customizable Excel Spreadsheet
A concise, visually segmented PESTLE summary of AAC Technologies Holdings for meetings and presentations—easily editable with notes, shareable across teams, and drop-in ready to align stakeholders on external risks and market positioning.
Economic factors

Smartphone demand cycles
IDC reported global smartphone shipments at about 1.13 billion in 2024, down ~2% year‑on‑year, so handset unit volatility directly drives AAC’s acoustic, haptic and optics order flows. Premium smartphone mix shifts (higher share of foldables and Pro models) lift ASPs and margin capture for components. Weak macro phases lengthen replacement cycles, slowing unit demand and pressuring volumes. Design‑win visibility smooths production planning and reduces order variance.
Consumer electronics diversification
Diversification into wearables, tablets and hearables broadens AAC Technologies revenue beyond smartphones, with wearables shipping about 440 million units globally in 2023 (IDC), supporting new revenue streams. New form factors drive demand for miniaturized MEMS and optics—core AAC competencies—enabling higher ASP components. Automotive and healthcare segments (growing electrification and medtech demand) help offset handset cyclicality, producing a more balanced exposure that reduces earnings volatility.

FX and input cost dynamics
AAC Technologies (2018.HK) faces USD/CNY exposure after USD/CNY traded near 7.30 in mid-2024, pressuring CNY-denominated input costs against USD invoiced sales. Metals, rare earths and semiconductor wafers are key BOM drivers, with market tightness lifting input volatility. Long-term supply contracts and FX hedges have been used to stabilize margins, while procurement scale affords the firm measurable pricing power.

Interest rates and capital access
Higher global policy rates (US fed funds 5.25–5.50% mid‑2024/25; China 1‑yr LPR 3.45%) raise financing costs for AAC Technologies’ capex‑heavy acoustic, haptics and automation lines, while tightening cycles compress DCF valuations and equity multiples. Strong operating cash flow supports sustained R&D and factory automation investment; access to subsidized loans from Chinese policy banks can materially improve project IRRs.
- Higher rates: increased borrowing costs for capex
- DCF impact: valuations compress in tightening cycles
- Liquidity: cash flow funds R&D/automation; subsidized loans improve IRR
OEM consolidation and pricing power
OEM consolidation concentrates pricing power: the top 5 smartphone OEMs accounted for roughly 75% of global shipments in 2024 (IDC), enabling tight cost-down roadmaps and vendor scorecards that tie sourcing share to quality and delivery metrics. AAC’s differentiated MEMS, haptics and acoustic performance help preserve ASPs despite multi-sourcing pressures, while rapid TWS and handset feature growth (TWS shipments +12% in 2024, Canalys) forces continuous innovation and R&D investment to retain wins.
- Top5_OEMs_75%_IDC_2024
- TWS_shipments_+12%_Canalys_2024
- Vendor_scorecards_link_share_to_QoD
- Differentiation_preserves_ASP_amid_multi-sourcing
Export controls, CHIPS incentives and tariffs heighten supply-chain and plant continuity risk
Global handset volatility (IDC: 1.13B units, −2% y/y in 2024) drives AAC’s volumes while premium mix and design wins support ASPs and margins. Diversification into wearables/TWS (+12% Canalys 2024) and auto/health reduces handset cyclicality. FX (USD/CNY ~7.30 mid‑2024) and higher rates (US funds 5.25–5.50% mid‑24/25; China 1yr LPR 3.45%) raise input and financing costs.
| Metric | 2024/25 value |
|---|---|
| Smartphone shipments | 1.13B (−2%) |
| Top‑5 OEM share | 75% |
| TWS growth | +12% |
| USD/CNY | ~7.30 |
| US policy rate | 5.25–5.50% |
Preview the Actual Deliverable
AAC Technologies Holdings PESTLE Analysis
This AAC Technologies Holdings PESTLE Analysis preview is the exact document you’ll receive after purchase—fully formatted and ready to use. The content, layout, and structure shown are identical to the downloadable file. No placeholders or teasers—this is the finished, professional report you’ll own instantly after checkout.

Plan Smarter. Present Sharper. Compete Stronger.
Unlock how political shifts, economic cycles, and rapid tech innovation are reshaping AAC Technologies Holdings and its market position. Our concise PESTLE snapshot highlights regulatory risks, supply-chain pressures, and ESG trends investors and strategists must know. Purchase the full analysis for a detailed, actionable roadmap to inform decisions and spot opportunity.
Political factors
US–China tech tensions
Geopolitical frictions between the US and China risk disrupting AAC Technologies' access to advanced tools, IP, and customers as US-led export controls since 2022 limit advanced semiconductors and equipment. The 2022 CHIPS Act provides about 52 billion USD in US subsidy/backing, and tightened controls in 2022–24 may slow MEMS and optics roadmaps. Clients diversifying supply chains could reallocate orders across regions, while diplomatic shifts can rapidly alter compliance burdens and costs.
Industrial policies and subsidies
China's state and local incentives, involving tens of billions in state-backed funds, alongside the US CHIPS Act's $52.7 billion and the EU Chips Act's ~€43 billion, materially shift site selection for AAC Technologies' MEMS and optics fabs. Grants and tax breaks available under these programs can materially lower upfront capex for new lines. Local content rules in major markets encourage co-location with OEMs. Long-term ROI hinges on policy stability and enforcement.
Tariffs and customs barriers
Variable tariffs, including US Section 301 levies of up to 25% on certain Chinese imports, directly squeeze AAC Technologies’ pricing and gross margins on speaker, mic and actuator components. Rules-of-origin provisions (e.g., EU/US customs regimes) complicate cross-border smartphone and wearable assemblies by determining duty liability for final goods. Customs delays—highlighted by elevated container dwell times in 2021–22 versus pre-pandemic norms—can disrupt OEM just-in-time ramps, so hedging production locations across APAC/EU lowers duty exposure and supply-risk concentration.
Localization and security reviews
Localization and multi-jurisdictional data and supply-chain security reviews increase documentation and audit burdens for AAC Technologies (stock code 2018.HK), raising compliance costs and time to market.
Government procurement often favors domestic suppliers and sensitive acoustic/semiconductor components can trigger national security screenings in key markets.
Robust corporate governance and documented security controls help AAC clear regulatory gates and sustain export access.
- 2018.HK
- increased audits
- procurement bias
- security screenings
- governance mitigates risk
Political stability in manufacturing hubs
Operational continuity for AAC depends on political stability across China and ASEAN manufacturing sites, where unrest or policy shifts can halt production. Changes in labor, energy, and logistics regulation directly alter cost baselines and margin projections. Infrastructure investment levels influence lead times and yield ramp; contingency planning reduces disruption risk.
- Risk: China/ASEAN stability
- Cost drivers: labor, energy, logistics policy
- Supply impact: infrastructure → lead times, yield
- Mitigation: contingency planning
Export controls, CHIPS incentives and tariffs heighten supply-chain and plant continuity risk
Geopolitical US–China frictions and US-led export controls since 2022 risk limiting AAC Technologies (2018.HK) access to advanced tools and customers; US CHIPS Act $52.7B and EU Chips Act ~€43B shift fab incentives. Tariffs (Section 301 up to 25%) and localization rules raise costs and compliance; multi-jurisdiction audits increase time-to-market. Political stability in China/ASEAN affects plant continuity, with contingency planning essential.
| Metric | Value |
|---|---|
| US CHIPS Act | $52.7B |
| EU Chips Act | ~€43B |
| Section 301 Tariff | up to 25% |
| Ticker | 2018.HK |
What is included in the product
Detailed Word Document
Explores how macro-environmental factors uniquely affect AAC Technologies Holdings across Political, Economic, Social, Technological, Environmental and Legal dimensions, with data-driven trends tied to the consumer electronics supply chain and Greater China market; designed to help executives and investors identify risks, opportunities and scenario-driven strategies.
Customizable Excel Spreadsheet
A concise, visually segmented PESTLE summary of AAC Technologies Holdings for meetings and presentations—easily editable with notes, shareable across teams, and drop-in ready to align stakeholders on external risks and market positioning.
Economic factors
Smartphone demand cycles
IDC reported global smartphone shipments at about 1.13 billion in 2024, down ~2% year‑on‑year, so handset unit volatility directly drives AAC’s acoustic, haptic and optics order flows. Premium smartphone mix shifts (higher share of foldables and Pro models) lift ASPs and margin capture for components. Weak macro phases lengthen replacement cycles, slowing unit demand and pressuring volumes. Design‑win visibility smooths production planning and reduces order variance.
Consumer electronics diversification
Diversification into wearables, tablets and hearables broadens AAC Technologies revenue beyond smartphones, with wearables shipping about 440 million units globally in 2023 (IDC), supporting new revenue streams. New form factors drive demand for miniaturized MEMS and optics—core AAC competencies—enabling higher ASP components. Automotive and healthcare segments (growing electrification and medtech demand) help offset handset cyclicality, producing a more balanced exposure that reduces earnings volatility.
FX and input cost dynamics
AAC Technologies (2018.HK) faces USD/CNY exposure after USD/CNY traded near 7.30 in mid-2024, pressuring CNY-denominated input costs against USD invoiced sales. Metals, rare earths and semiconductor wafers are key BOM drivers, with market tightness lifting input volatility. Long-term supply contracts and FX hedges have been used to stabilize margins, while procurement scale affords the firm measurable pricing power.
Interest rates and capital access
Higher global policy rates (US fed funds 5.25–5.50% mid‑2024/25; China 1‑yr LPR 3.45%) raise financing costs for AAC Technologies’ capex‑heavy acoustic, haptics and automation lines, while tightening cycles compress DCF valuations and equity multiples. Strong operating cash flow supports sustained R&D and factory automation investment; access to subsidized loans from Chinese policy banks can materially improve project IRRs.
- Higher rates: increased borrowing costs for capex
- DCF impact: valuations compress in tightening cycles
- Liquidity: cash flow funds R&D/automation; subsidized loans improve IRR
OEM consolidation and pricing power
OEM consolidation concentrates pricing power: the top 5 smartphone OEMs accounted for roughly 75% of global shipments in 2024 (IDC), enabling tight cost-down roadmaps and vendor scorecards that tie sourcing share to quality and delivery metrics. AAC’s differentiated MEMS, haptics and acoustic performance help preserve ASPs despite multi-sourcing pressures, while rapid TWS and handset feature growth (TWS shipments +12% in 2024, Canalys) forces continuous innovation and R&D investment to retain wins.
- Top5_OEMs_75%_IDC_2024
- TWS_shipments_+12%_Canalys_2024
- Vendor_scorecards_link_share_to_QoD
- Differentiation_preserves_ASP_amid_multi-sourcing
Export controls, CHIPS incentives and tariffs heighten supply-chain and plant continuity risk
Global handset volatility (IDC: 1.13B units, −2% y/y in 2024) drives AAC’s volumes while premium mix and design wins support ASPs and margins. Diversification into wearables/TWS (+12% Canalys 2024) and auto/health reduces handset cyclicality. FX (USD/CNY ~7.30 mid‑2024) and higher rates (US funds 5.25–5.50% mid‑24/25; China 1yr LPR 3.45%) raise input and financing costs.
| Metric | 2024/25 value |
|---|---|
| Smartphone shipments | 1.13B (−2%) |
| Top‑5 OEM share | 75% |
| TWS growth | +12% |
| USD/CNY | ~7.30 |
| US policy rate | 5.25–5.50% |
Preview the Actual Deliverable
AAC Technologies Holdings PESTLE Analysis
This AAC Technologies Holdings PESTLE Analysis preview is the exact document you’ll receive after purchase—fully formatted and ready to use. The content, layout, and structure shown are identical to the downloadable file. No placeholders or teasers—this is the finished, professional report you’ll own instantly after checkout.
Original: $10.00
-65%$10.00
$3.50Description
Plan Smarter. Present Sharper. Compete Stronger.
Unlock how political shifts, economic cycles, and rapid tech innovation are reshaping AAC Technologies Holdings and its market position. Our concise PESTLE snapshot highlights regulatory risks, supply-chain pressures, and ESG trends investors and strategists must know. Purchase the full analysis for a detailed, actionable roadmap to inform decisions and spot opportunity.
Political factors
US–China tech tensions
Geopolitical frictions between the US and China risk disrupting AAC Technologies' access to advanced tools, IP, and customers as US-led export controls since 2022 limit advanced semiconductors and equipment. The 2022 CHIPS Act provides about 52 billion USD in US subsidy/backing, and tightened controls in 2022–24 may slow MEMS and optics roadmaps. Clients diversifying supply chains could reallocate orders across regions, while diplomatic shifts can rapidly alter compliance burdens and costs.
Industrial policies and subsidies
China's state and local incentives, involving tens of billions in state-backed funds, alongside the US CHIPS Act's $52.7 billion and the EU Chips Act's ~€43 billion, materially shift site selection for AAC Technologies' MEMS and optics fabs. Grants and tax breaks available under these programs can materially lower upfront capex for new lines. Local content rules in major markets encourage co-location with OEMs. Long-term ROI hinges on policy stability and enforcement.
Tariffs and customs barriers
Variable tariffs, including US Section 301 levies of up to 25% on certain Chinese imports, directly squeeze AAC Technologies’ pricing and gross margins on speaker, mic and actuator components. Rules-of-origin provisions (e.g., EU/US customs regimes) complicate cross-border smartphone and wearable assemblies by determining duty liability for final goods. Customs delays—highlighted by elevated container dwell times in 2021–22 versus pre-pandemic norms—can disrupt OEM just-in-time ramps, so hedging production locations across APAC/EU lowers duty exposure and supply-risk concentration.
Localization and security reviews
Localization and multi-jurisdictional data and supply-chain security reviews increase documentation and audit burdens for AAC Technologies (stock code 2018.HK), raising compliance costs and time to market.
Government procurement often favors domestic suppliers and sensitive acoustic/semiconductor components can trigger national security screenings in key markets.
Robust corporate governance and documented security controls help AAC clear regulatory gates and sustain export access.
- 2018.HK
- increased audits
- procurement bias
- security screenings
- governance mitigates risk
Political stability in manufacturing hubs
Operational continuity for AAC depends on political stability across China and ASEAN manufacturing sites, where unrest or policy shifts can halt production. Changes in labor, energy, and logistics regulation directly alter cost baselines and margin projections. Infrastructure investment levels influence lead times and yield ramp; contingency planning reduces disruption risk.
- Risk: China/ASEAN stability
- Cost drivers: labor, energy, logistics policy
- Supply impact: infrastructure → lead times, yield
- Mitigation: contingency planning
Export controls, CHIPS incentives and tariffs heighten supply-chain and plant continuity risk
Geopolitical US–China frictions and US-led export controls since 2022 risk limiting AAC Technologies (2018.HK) access to advanced tools and customers; US CHIPS Act $52.7B and EU Chips Act ~€43B shift fab incentives. Tariffs (Section 301 up to 25%) and localization rules raise costs and compliance; multi-jurisdiction audits increase time-to-market. Political stability in China/ASEAN affects plant continuity, with contingency planning essential.
| Metric | Value |
|---|---|
| US CHIPS Act | $52.7B |
| EU Chips Act | ~€43B |
| Section 301 Tariff | up to 25% |
| Ticker | 2018.HK |
What is included in the product
Detailed Word Document
Explores how macro-environmental factors uniquely affect AAC Technologies Holdings across Political, Economic, Social, Technological, Environmental and Legal dimensions, with data-driven trends tied to the consumer electronics supply chain and Greater China market; designed to help executives and investors identify risks, opportunities and scenario-driven strategies.
Customizable Excel Spreadsheet
A concise, visually segmented PESTLE summary of AAC Technologies Holdings for meetings and presentations—easily editable with notes, shareable across teams, and drop-in ready to align stakeholders on external risks and market positioning.
Economic factors
Smartphone demand cycles
IDC reported global smartphone shipments at about 1.13 billion in 2024, down ~2% year‑on‑year, so handset unit volatility directly drives AAC’s acoustic, haptic and optics order flows. Premium smartphone mix shifts (higher share of foldables and Pro models) lift ASPs and margin capture for components. Weak macro phases lengthen replacement cycles, slowing unit demand and pressuring volumes. Design‑win visibility smooths production planning and reduces order variance.
Consumer electronics diversification
Diversification into wearables, tablets and hearables broadens AAC Technologies revenue beyond smartphones, with wearables shipping about 440 million units globally in 2023 (IDC), supporting new revenue streams. New form factors drive demand for miniaturized MEMS and optics—core AAC competencies—enabling higher ASP components. Automotive and healthcare segments (growing electrification and medtech demand) help offset handset cyclicality, producing a more balanced exposure that reduces earnings volatility.
FX and input cost dynamics
AAC Technologies (2018.HK) faces USD/CNY exposure after USD/CNY traded near 7.30 in mid-2024, pressuring CNY-denominated input costs against USD invoiced sales. Metals, rare earths and semiconductor wafers are key BOM drivers, with market tightness lifting input volatility. Long-term supply contracts and FX hedges have been used to stabilize margins, while procurement scale affords the firm measurable pricing power.
Interest rates and capital access
Higher global policy rates (US fed funds 5.25–5.50% mid‑2024/25; China 1‑yr LPR 3.45%) raise financing costs for AAC Technologies’ capex‑heavy acoustic, haptics and automation lines, while tightening cycles compress DCF valuations and equity multiples. Strong operating cash flow supports sustained R&D and factory automation investment; access to subsidized loans from Chinese policy banks can materially improve project IRRs.
- Higher rates: increased borrowing costs for capex
- DCF impact: valuations compress in tightening cycles
- Liquidity: cash flow funds R&D/automation; subsidized loans improve IRR
OEM consolidation and pricing power
OEM consolidation concentrates pricing power: the top 5 smartphone OEMs accounted for roughly 75% of global shipments in 2024 (IDC), enabling tight cost-down roadmaps and vendor scorecards that tie sourcing share to quality and delivery metrics. AAC’s differentiated MEMS, haptics and acoustic performance help preserve ASPs despite multi-sourcing pressures, while rapid TWS and handset feature growth (TWS shipments +12% in 2024, Canalys) forces continuous innovation and R&D investment to retain wins.
- Top5_OEMs_75%_IDC_2024
- TWS_shipments_+12%_Canalys_2024
- Vendor_scorecards_link_share_to_QoD
- Differentiation_preserves_ASP_amid_multi-sourcing
Export controls, CHIPS incentives and tariffs heighten supply-chain and plant continuity risk
Global handset volatility (IDC: 1.13B units, −2% y/y in 2024) drives AAC’s volumes while premium mix and design wins support ASPs and margins. Diversification into wearables/TWS (+12% Canalys 2024) and auto/health reduces handset cyclicality. FX (USD/CNY ~7.30 mid‑2024) and higher rates (US funds 5.25–5.50% mid‑24/25; China 1yr LPR 3.45%) raise input and financing costs.
| Metric | 2024/25 value |
|---|---|
| Smartphone shipments | 1.13B (−2%) |
| Top‑5 OEM share | 75% |
| TWS growth | +12% |
| USD/CNY | ~7.30 |
| US policy rate | 5.25–5.50% |
Preview the Actual Deliverable
AAC Technologies Holdings PESTLE Analysis
This AAC Technologies Holdings PESTLE Analysis preview is the exact document you’ll receive after purchase—fully formatted and ready to use. The content, layout, and structure shown are identical to the downloadable file. No placeholders or teasers—this is the finished, professional report you’ll own instantly after checkout.











