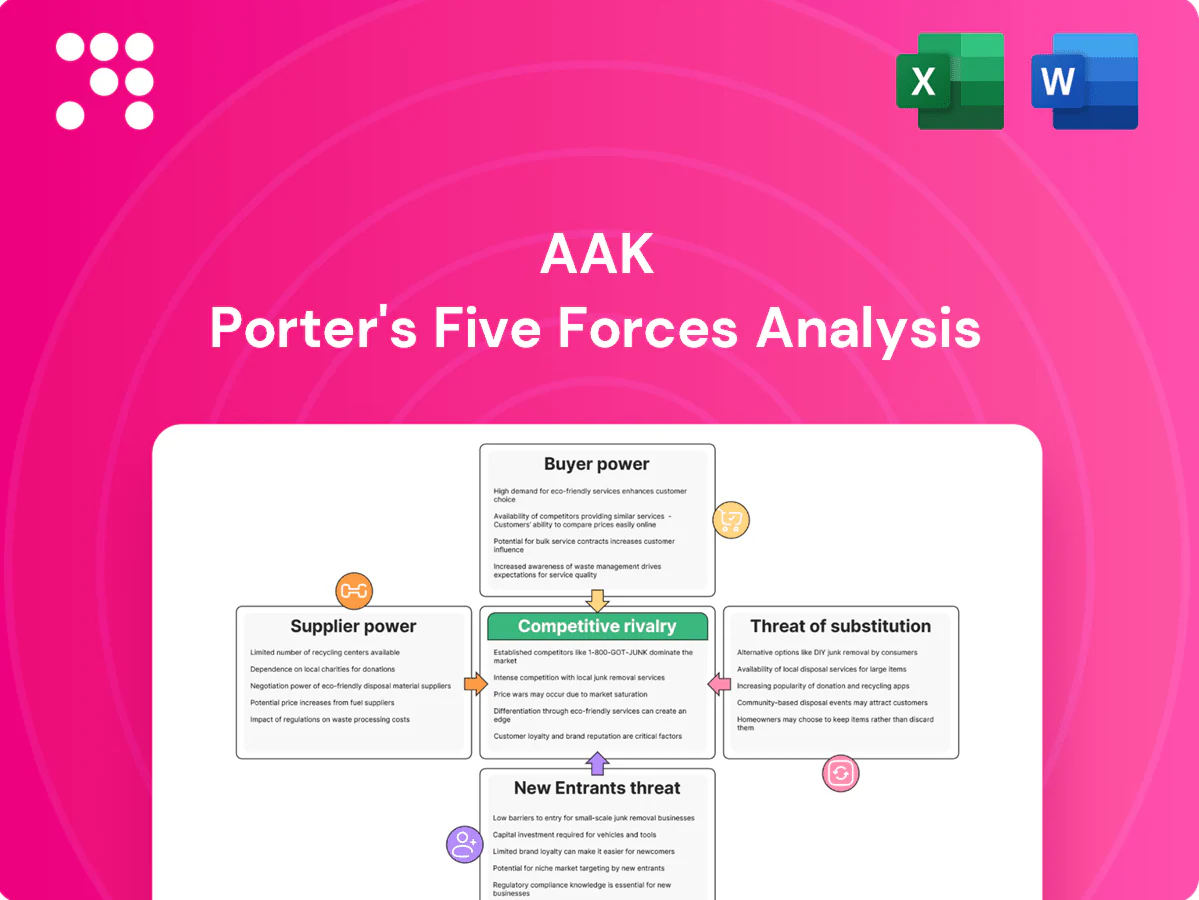
AAK Porter's Five Forces Analysis

Elevate Your Analysis with the Complete Porter's Five Forces Analysis
AAK’s Porter's Five Forces snapshot highlights supplier concentration, buyer bargaining, rivalry intensity, threat of substitutes, and barriers to entry shaping its edible oils and specialty fats market position. The analysis reveals key pressures and strategic levers for margin protection and growth. This brief preview scratches the surface. Unlock the full Porter's Five Forces Analysis to explore AAK’s competitive dynamics and actionable implications.
Suppliers Bargaining Power

Concentrated origin crops
Key feedstocks — palm, shea and cocoa-butter equivalents — originate in concentrated regions: Indonesia and Malaysia supply ~85% of palm oil and global palm output was about 78 Mt in 2023/24, while West Africa provides >80% of shea; seasonal harvests and geopolitics drive volatility. Weather, trade policy and export restrictions can tighten supply and lift supplier leverage. AAK mitigates through multi-oil flexibility and diversified sourcing, but origin concentration periodically strengthens supplier power.
Smallholder dependence
Large portions of supply—around 40% of global palm and over 80% of shea—originate with smallholders and collectors, concentrating supplier power at community level. Aggregators and co-ops can capture premiums linked to quality and sustainability, influencing farmgate prices. AAK’s long-term programs and traceability efforts reduce information asymmetry and stabilize sourcing. Local shocks—poor harvests, price swings, or conflict—can sharply raise bargaining pressure.

Sustainability premiums
RSPO, NDPE and deforestation-free mandates have created premium tiers where certified and specialty grades command higher prices, tightening supplier leverage as certified segregated volumes remain limited versus overall palm oil supply. AAK’s scale and procurement standards strengthen its negotiating position, yet higher compliance and traceability costs are passed upstream, sustaining supplier pricing power. Tight certified availability thus amplifies supplier bargaining clout.

Logistics and energy costs
Refining relies on stable freight, storage and energy inputs; 2024 Brent averaged ~$84/bbl and container spot rates were down ~70% from 2022 peaks, yet port congestion and energy spikes can quickly shift leverage to logistics providers and origin exporters. AAK's presence in 20+ countries offers routing flexibility, moderating exposure; prolonged disruptions, however, increase supplier bargaining power.
- Brent 2024 ~84 USD/bbl
- Container rates -70% vs 2022
- AAK footprint: 20+ countries
- Prolonged disruption = higher supplier leverage
Alternative oil flexibility
AAK’s ability to switch among rapeseed, sunflower, soy, palm fractions and shea reduces dependence on any single supplier and thus weakens supplier bargaining power, though formulation constraints prevent perfect one-to-one substitution and may require R&D or price premiums to maintain functionality.
- Multi-oil sourcing lowers single-supplier risk
- Formulation limits prevent full interchangeability
- 2024: concurrent crop tightness (weather, logistics) can spike supplier power
Palm concentrated supply gives suppliers pricing power: 85% from ID/MY
Suppliers hold moderate-to-high power: key feedstocks are origin-concentrated (palm ~78 Mt 2023/24; ~85% Indonesia/Malaysia; shea >80% West Africa), certification scarcity and local shocks elevate leverage. AAK’s 20+ country footprint and multi-oil flexibility reduce dependency, but formulation limits and certified premiums sustain supplier pricing power.
| Supplier | Concentration | Impact | Key data |
|---|---|---|---|
| Palm | High | Price volatility | 78 Mt; 85% ID/MY |
| Shea | High | Supply tightness | >80% West Africa |
| Logistics | Medium | Disruption risk | Brent 2024 ~$84/bbl |
What is included in the product
 Detailed Word Document
Comprehensive Porter's Five Forces assessment tailored to AAK, revealing competitive intensity, supplier/buyer power, substitution risks, and barriers shaping its profitability and strategic positioning.

 Customizable Excel Spreadsheet
AAK-focused Porter's Five Forces in a clean one-sheet—instantly highlight supplier, buyer, rival and entrant pressures to ease strategic decision-making. Editable radar chart and simple inputs let you tweak scenarios, copy into decks, and integrate with reports—no macros or finance jargon required.
Customers Bargaining Power

Large FMCG buyers
Large FMCG buyers purchase high volumes from AAK and use global tender processes to compress margins; in 2024 AAK reported net sales of SEK 54.9 billion, highlighting scale-driven negotiation stakes. Their procurement scale and tendering often force price concessions, but AAK offsets pressure with application expertise and joint product co-development. Despite this, top accounts—representing roughly 30% of sales—retain notable pricing power over terms and margins.
Switching costs via formulation
Tailored fat systems integrate into taste, texture and process parameters, making product reformulation complex. Requalifying suppliers and validating formulations typically takes 6–12 months, raising practical switching costs and softening buyer power for specialty solutions. Commoditized volumes remain more price sensitive, with buyers retaining stronger leverage on standard bulk fats.

Demand for sustainability
In 2024 buyers increasingly demand traceability, palm-free options and ESG assurances, forcing suppliers into certified chains and detailed audit trails. Compliance creates measurable value and benchmarking comparability across suppliers, and AAK’s 2024 sustainability platform and certifications support price realization through premiums. However, standardized, transparent metrics in 2024 also enable buyers to cross-shop certified suppliers more easily.

Private label and QSR pressure
Retailer private labels (~34% EU grocery share in 2024) and expanding QSR chains push AAK for low-cost, stable supply; volume visibility improves planning but tightens price expectations. Strong service levels and reliability allow modest premiums, yet standardized applications (margarine, frying oils) keep price pressure high. QSR channel growth (~6% global sales increase in 2024) sustains volume but limits margin upside.
- Private label ~34% EU share (2024)
- QSR growth ~6% (2024)
- Volume visibility aids planning
- Standardized uses sustain price pressure
Dual sourcing norms
- Dual-sourced customers: continuity over price
- AAK 2024 net sales: SEK 22.3 billion
- Defensive levers: service, innovation, global footprint
- Renewals face elevated buyer leverage
FMCG price pressure vs specialty-fat lock-in; EU private label 34%
Large FMCG buyers and retailer private labels (EU share ~34% in 2024) exert strong price pressure on AAK (net sales SEK 54.9bn in 2024), though specialty fat systems raise switching costs (requalification 6–12 months) and top accounts (~30% of sales) retain negotiation leverage. ESG/certification demand and QSR growth (~6% in 2024) create premium opportunities yet increase comparability.
| Metric | Value (2024) |
|---|---|
| AAK net sales | SEK 54.9bn |
| Top accounts share | ~30% |
| EU private label | ~34% |
| QSR growth | ~6% |
| Switching time | 6–12 months |
Full Version Awaits
AAK Porter's Five Forces Analysis
This preview shows the exact AAK Porter's Five Forces Analysis you'll receive immediately after purchase—no placeholders or samples. The file is fully formatted, professionally written, and ready for download and use the moment you buy. What you see is what you get, with comprehensive insights into competitive forces affecting AAK.

Elevate Your Analysis with the Complete Porter's Five Forces Analysis
AAK’s Porter's Five Forces snapshot highlights supplier concentration, buyer bargaining, rivalry intensity, threat of substitutes, and barriers to entry shaping its edible oils and specialty fats market position. The analysis reveals key pressures and strategic levers for margin protection and growth. This brief preview scratches the surface. Unlock the full Porter's Five Forces Analysis to explore AAK’s competitive dynamics and actionable implications.
Suppliers Bargaining Power
Concentrated origin crops
Key feedstocks — palm, shea and cocoa-butter equivalents — originate in concentrated regions: Indonesia and Malaysia supply ~85% of palm oil and global palm output was about 78 Mt in 2023/24, while West Africa provides >80% of shea; seasonal harvests and geopolitics drive volatility. Weather, trade policy and export restrictions can tighten supply and lift supplier leverage. AAK mitigates through multi-oil flexibility and diversified sourcing, but origin concentration periodically strengthens supplier power.
Smallholder dependence
Large portions of supply—around 40% of global palm and over 80% of shea—originate with smallholders and collectors, concentrating supplier power at community level. Aggregators and co-ops can capture premiums linked to quality and sustainability, influencing farmgate prices. AAK’s long-term programs and traceability efforts reduce information asymmetry and stabilize sourcing. Local shocks—poor harvests, price swings, or conflict—can sharply raise bargaining pressure.
Sustainability premiums
RSPO, NDPE and deforestation-free mandates have created premium tiers where certified and specialty grades command higher prices, tightening supplier leverage as certified segregated volumes remain limited versus overall palm oil supply. AAK’s scale and procurement standards strengthen its negotiating position, yet higher compliance and traceability costs are passed upstream, sustaining supplier pricing power. Tight certified availability thus amplifies supplier bargaining clout.
Logistics and energy costs
Refining relies on stable freight, storage and energy inputs; 2024 Brent averaged ~$84/bbl and container spot rates were down ~70% from 2022 peaks, yet port congestion and energy spikes can quickly shift leverage to logistics providers and origin exporters. AAK's presence in 20+ countries offers routing flexibility, moderating exposure; prolonged disruptions, however, increase supplier bargaining power.
- Brent 2024 ~84 USD/bbl
- Container rates -70% vs 2022
- AAK footprint: 20+ countries
- Prolonged disruption = higher supplier leverage
Alternative oil flexibility
AAK’s ability to switch among rapeseed, sunflower, soy, palm fractions and shea reduces dependence on any single supplier and thus weakens supplier bargaining power, though formulation constraints prevent perfect one-to-one substitution and may require R&D or price premiums to maintain functionality.
- Multi-oil sourcing lowers single-supplier risk
- Formulation limits prevent full interchangeability
- 2024: concurrent crop tightness (weather, logistics) can spike supplier power
Palm concentrated supply gives suppliers pricing power: 85% from ID/MY
Suppliers hold moderate-to-high power: key feedstocks are origin-concentrated (palm ~78 Mt 2023/24; ~85% Indonesia/Malaysia; shea >80% West Africa), certification scarcity and local shocks elevate leverage. AAK’s 20+ country footprint and multi-oil flexibility reduce dependency, but formulation limits and certified premiums sustain supplier pricing power.
| Supplier | Concentration | Impact | Key data |
|---|---|---|---|
| Palm | High | Price volatility | 78 Mt; 85% ID/MY |
| Shea | High | Supply tightness | >80% West Africa |
| Logistics | Medium | Disruption risk | Brent 2024 ~$84/bbl |
What is included in the product
Detailed Word Document
Comprehensive Porter's Five Forces assessment tailored to AAK, revealing competitive intensity, supplier/buyer power, substitution risks, and barriers shaping its profitability and strategic positioning.
Customizable Excel Spreadsheet
AAK-focused Porter's Five Forces in a clean one-sheet—instantly highlight supplier, buyer, rival and entrant pressures to ease strategic decision-making. Editable radar chart and simple inputs let you tweak scenarios, copy into decks, and integrate with reports—no macros or finance jargon required.
Customers Bargaining Power
Large FMCG buyers
Large FMCG buyers purchase high volumes from AAK and use global tender processes to compress margins; in 2024 AAK reported net sales of SEK 54.9 billion, highlighting scale-driven negotiation stakes. Their procurement scale and tendering often force price concessions, but AAK offsets pressure with application expertise and joint product co-development. Despite this, top accounts—representing roughly 30% of sales—retain notable pricing power over terms and margins.
Switching costs via formulation
Tailored fat systems integrate into taste, texture and process parameters, making product reformulation complex. Requalifying suppliers and validating formulations typically takes 6–12 months, raising practical switching costs and softening buyer power for specialty solutions. Commoditized volumes remain more price sensitive, with buyers retaining stronger leverage on standard bulk fats.
Demand for sustainability
In 2024 buyers increasingly demand traceability, palm-free options and ESG assurances, forcing suppliers into certified chains and detailed audit trails. Compliance creates measurable value and benchmarking comparability across suppliers, and AAK’s 2024 sustainability platform and certifications support price realization through premiums. However, standardized, transparent metrics in 2024 also enable buyers to cross-shop certified suppliers more easily.
Private label and QSR pressure
Retailer private labels (~34% EU grocery share in 2024) and expanding QSR chains push AAK for low-cost, stable supply; volume visibility improves planning but tightens price expectations. Strong service levels and reliability allow modest premiums, yet standardized applications (margarine, frying oils) keep price pressure high. QSR channel growth (~6% global sales increase in 2024) sustains volume but limits margin upside.
- Private label ~34% EU share (2024)
- QSR growth ~6% (2024)
- Volume visibility aids planning
- Standardized uses sustain price pressure
Dual sourcing norms
- Dual-sourced customers: continuity over price
- AAK 2024 net sales: SEK 22.3 billion
- Defensive levers: service, innovation, global footprint
- Renewals face elevated buyer leverage
FMCG price pressure vs specialty-fat lock-in; EU private label 34%
Large FMCG buyers and retailer private labels (EU share ~34% in 2024) exert strong price pressure on AAK (net sales SEK 54.9bn in 2024), though specialty fat systems raise switching costs (requalification 6–12 months) and top accounts (~30% of sales) retain negotiation leverage. ESG/certification demand and QSR growth (~6% in 2024) create premium opportunities yet increase comparability.
| Metric | Value (2024) |
|---|---|
| AAK net sales | SEK 54.9bn |
| Top accounts share | ~30% |
| EU private label | ~34% |
| QSR growth | ~6% |
| Switching time | 6–12 months |
Full Version Awaits
AAK Porter's Five Forces Analysis
This preview shows the exact AAK Porter's Five Forces Analysis you'll receive immediately after purchase—no placeholders or samples. The file is fully formatted, professionally written, and ready for download and use the moment you buy. What you see is what you get, with comprehensive insights into competitive forces affecting AAK.
Description
Elevate Your Analysis with the Complete Porter's Five Forces Analysis
AAK’s Porter's Five Forces snapshot highlights supplier concentration, buyer bargaining, rivalry intensity, threat of substitutes, and barriers to entry shaping its edible oils and specialty fats market position. The analysis reveals key pressures and strategic levers for margin protection and growth. This brief preview scratches the surface. Unlock the full Porter's Five Forces Analysis to explore AAK’s competitive dynamics and actionable implications.
Suppliers Bargaining Power
Concentrated origin crops
Key feedstocks — palm, shea and cocoa-butter equivalents — originate in concentrated regions: Indonesia and Malaysia supply ~85% of palm oil and global palm output was about 78 Mt in 2023/24, while West Africa provides >80% of shea; seasonal harvests and geopolitics drive volatility. Weather, trade policy and export restrictions can tighten supply and lift supplier leverage. AAK mitigates through multi-oil flexibility and diversified sourcing, but origin concentration periodically strengthens supplier power.
Smallholder dependence
Large portions of supply—around 40% of global palm and over 80% of shea—originate with smallholders and collectors, concentrating supplier power at community level. Aggregators and co-ops can capture premiums linked to quality and sustainability, influencing farmgate prices. AAK’s long-term programs and traceability efforts reduce information asymmetry and stabilize sourcing. Local shocks—poor harvests, price swings, or conflict—can sharply raise bargaining pressure.
Sustainability premiums
RSPO, NDPE and deforestation-free mandates have created premium tiers where certified and specialty grades command higher prices, tightening supplier leverage as certified segregated volumes remain limited versus overall palm oil supply. AAK’s scale and procurement standards strengthen its negotiating position, yet higher compliance and traceability costs are passed upstream, sustaining supplier pricing power. Tight certified availability thus amplifies supplier bargaining clout.
Logistics and energy costs
Refining relies on stable freight, storage and energy inputs; 2024 Brent averaged ~$84/bbl and container spot rates were down ~70% from 2022 peaks, yet port congestion and energy spikes can quickly shift leverage to logistics providers and origin exporters. AAK's presence in 20+ countries offers routing flexibility, moderating exposure; prolonged disruptions, however, increase supplier bargaining power.
- Brent 2024 ~84 USD/bbl
- Container rates -70% vs 2022
- AAK footprint: 20+ countries
- Prolonged disruption = higher supplier leverage
Alternative oil flexibility
AAK’s ability to switch among rapeseed, sunflower, soy, palm fractions and shea reduces dependence on any single supplier and thus weakens supplier bargaining power, though formulation constraints prevent perfect one-to-one substitution and may require R&D or price premiums to maintain functionality.
- Multi-oil sourcing lowers single-supplier risk
- Formulation limits prevent full interchangeability
- 2024: concurrent crop tightness (weather, logistics) can spike supplier power
Palm concentrated supply gives suppliers pricing power: 85% from ID/MY
Suppliers hold moderate-to-high power: key feedstocks are origin-concentrated (palm ~78 Mt 2023/24; ~85% Indonesia/Malaysia; shea >80% West Africa), certification scarcity and local shocks elevate leverage. AAK’s 20+ country footprint and multi-oil flexibility reduce dependency, but formulation limits and certified premiums sustain supplier pricing power.
| Supplier | Concentration | Impact | Key data |
|---|---|---|---|
| Palm | High | Price volatility | 78 Mt; 85% ID/MY |
| Shea | High | Supply tightness | >80% West Africa |
| Logistics | Medium | Disruption risk | Brent 2024 ~$84/bbl |
What is included in the product
Detailed Word Document
Comprehensive Porter's Five Forces assessment tailored to AAK, revealing competitive intensity, supplier/buyer power, substitution risks, and barriers shaping its profitability and strategic positioning.
Customizable Excel Spreadsheet
AAK-focused Porter's Five Forces in a clean one-sheet—instantly highlight supplier, buyer, rival and entrant pressures to ease strategic decision-making. Editable radar chart and simple inputs let you tweak scenarios, copy into decks, and integrate with reports—no macros or finance jargon required.
Customers Bargaining Power
Large FMCG buyers
Large FMCG buyers purchase high volumes from AAK and use global tender processes to compress margins; in 2024 AAK reported net sales of SEK 54.9 billion, highlighting scale-driven negotiation stakes. Their procurement scale and tendering often force price concessions, but AAK offsets pressure with application expertise and joint product co-development. Despite this, top accounts—representing roughly 30% of sales—retain notable pricing power over terms and margins.
Switching costs via formulation
Tailored fat systems integrate into taste, texture and process parameters, making product reformulation complex. Requalifying suppliers and validating formulations typically takes 6–12 months, raising practical switching costs and softening buyer power for specialty solutions. Commoditized volumes remain more price sensitive, with buyers retaining stronger leverage on standard bulk fats.
Demand for sustainability
In 2024 buyers increasingly demand traceability, palm-free options and ESG assurances, forcing suppliers into certified chains and detailed audit trails. Compliance creates measurable value and benchmarking comparability across suppliers, and AAK’s 2024 sustainability platform and certifications support price realization through premiums. However, standardized, transparent metrics in 2024 also enable buyers to cross-shop certified suppliers more easily.
Private label and QSR pressure
Retailer private labels (~34% EU grocery share in 2024) and expanding QSR chains push AAK for low-cost, stable supply; volume visibility improves planning but tightens price expectations. Strong service levels and reliability allow modest premiums, yet standardized applications (margarine, frying oils) keep price pressure high. QSR channel growth (~6% global sales increase in 2024) sustains volume but limits margin upside.
- Private label ~34% EU share (2024)
- QSR growth ~6% (2024)
- Volume visibility aids planning
- Standardized uses sustain price pressure
Dual sourcing norms
- Dual-sourced customers: continuity over price
- AAK 2024 net sales: SEK 22.3 billion
- Defensive levers: service, innovation, global footprint
- Renewals face elevated buyer leverage
FMCG price pressure vs specialty-fat lock-in; EU private label 34%
Large FMCG buyers and retailer private labels (EU share ~34% in 2024) exert strong price pressure on AAK (net sales SEK 54.9bn in 2024), though specialty fat systems raise switching costs (requalification 6–12 months) and top accounts (~30% of sales) retain negotiation leverage. ESG/certification demand and QSR growth (~6% in 2024) create premium opportunities yet increase comparability.
| Metric | Value (2024) |
|---|---|
| AAK net sales | SEK 54.9bn |
| Top accounts share | ~30% |
| EU private label | ~34% |
| QSR growth | ~6% |
| Switching time | 6–12 months |
Full Version Awaits
AAK Porter's Five Forces Analysis
This preview shows the exact AAK Porter's Five Forces Analysis you'll receive immediately after purchase—no placeholders or samples. The file is fully formatted, professionally written, and ready for download and use the moment you buy. What you see is what you get, with comprehensive insights into competitive forces affecting AAK.











