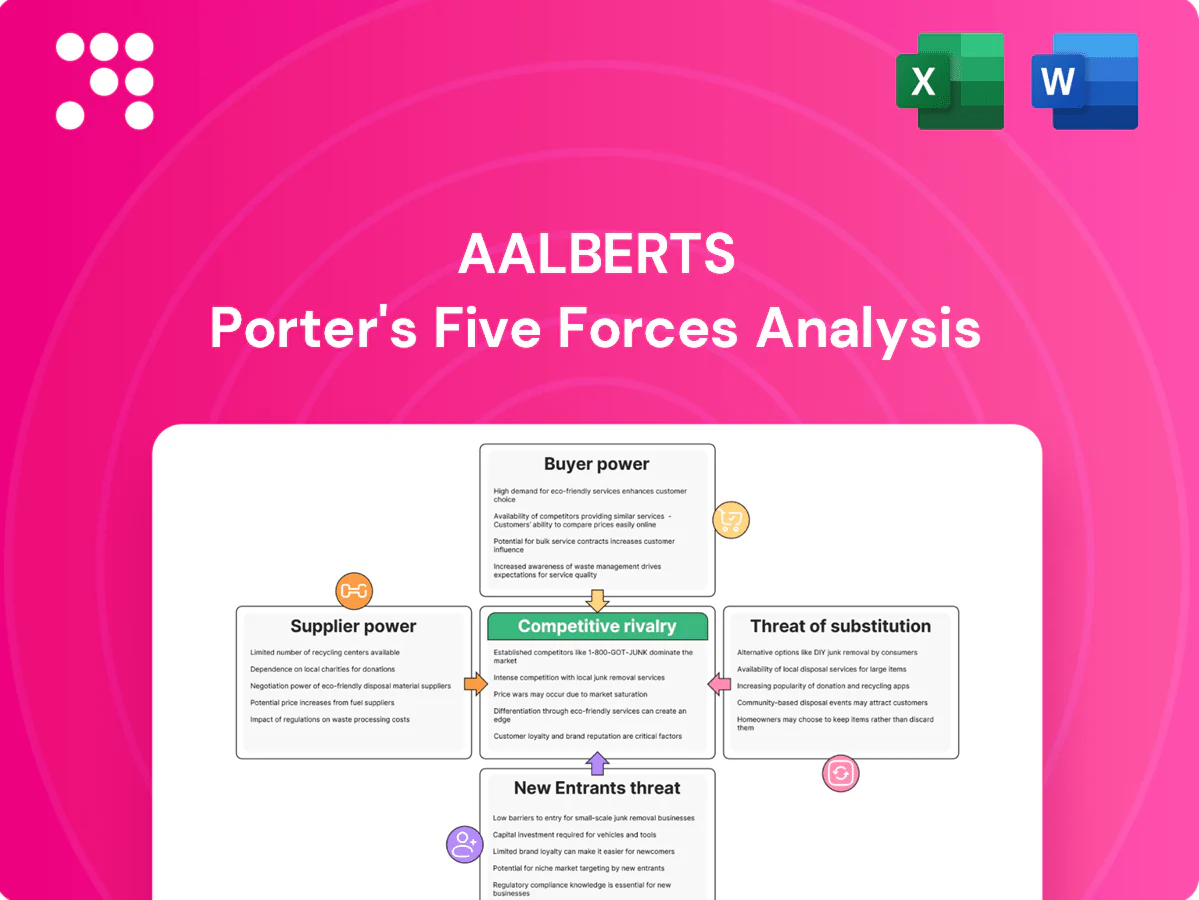
Aalberts Porter's Five Forces Analysis

Elevate Your Analysis with the Complete Porter's Five Forces Analysis
Aalberts faces moderate supplier power, fragmented buyers, steady threat of new entrants, strong rivalry in niche advanced-engineering markets, and evolving substitute risks driven by digitalization and sustainability trends. This brief snapshot only scratches the surface. Unlock the full Porter's Five Forces Analysis to explore Aalberts’s competitive dynamics, market pressures, and strategic advantages in detail.
Suppliers Bargaining Power

Specialty materials concentration
Dependence on specialty alloys, high-performance polymers and precision components gives niche suppliers leverage, especially where inputs must meet ultra-pure specifications (semiconductor-grade 6N purity, battery materials >99.9%). In semiconductor and e-mobility supply chains the need for such high-spec inputs narrows the qualified supplier base. Long qualification cycles (typically 12–24 months) raise switching costs for Aalberts. Multi-sourcing and strategic inventories partially offset concentration risk.
Process chemicals and gases
Semiconductor efficiency depends on certified process chemicals and gases supplied by fewer than 10 compliant global providers, concentrating bargaining power and raising risk of supply shocks that can extend lead times by weeks and compress margins. Framework agreements and hedging are widely used to stabilize costs and cap volatility. Closer technical collaboration on specifications can secure priority allocation from constrained suppliers.

Advanced manufacturing equipment
CNC, coating and surface-treatment equipment suppliers can dictate uptime and service terms, with spare-parts and maintenance contracts creating entrenched dependency; equipment downtime can cost manufacturers up to 5-10% of annual output value. Aalberts’ 2024 scale (revenue ~EUR 4.2bn) enables negotiated SLAs and bundled capital/service purchases, lowering unit service costs. Robust internal engineering teams reduce single-source exposure by qualifying alternatives and performing in-house repairs.

Energy and logistics inputs
Energy-intensive processes raise Aalberts' exposure to utility providers and fuel markets; by 2024 long-term PPAs and efficiency projects increasingly insulated margins. Global logistics constraints pressured freight costs and delivery reliability, though 2024 saw freight rates ease from 2022 peaks per Drewry. Regionalized production and nearshoring cut transit risk and variability.
- Energy exposure: PPAs, efficiency
- Logistics: 2024 easing vs 2022 peaks (Drewry)
- Mitigation: nearshoring, regionalization
- Contracts: long-term deals curb volatility
IP and technology licensors
Access to coatings, valves and control tech often requires licensing or co-development; licensors commonly command royalty rates of about 5–10% on revenues for industrial IP, giving them tangible pricing power over critical know-how. Building proprietary IP or acquiring patents reduces reliance and margin exposure. Joint ventures and co-development deals routinely split R&D and roadmap risk—often sharing 30–50% of development costs.
- Licensing royalty pressure: 5–10% typical
- Proprietary IP: lowers supplier dependence
- JVs/co-dev: share 30–50% of R&D/roadmap risk
Supply concentration, 12–24 months qualification and 5–10% downtime/royalties
Specialty inputs (semiconductor-grade, 6N; battery >99.9%) and certified gases (<10 global suppliers) concentrate supplier power; qualification cycles 12–24 months raise switching costs. Equipment/service vendors drive uptime risk (downtime 5–10% output value). Licensing royalties 5–10% and energy/logistics exposure persist; Aalberts scale (2024 revenue ~EUR 4.2bn) and PPAs, nearshoring mitigate.
| Metric | Value |
|---|---|
| 2024 revenue | EUR 4.2bn |
| Process gas suppliers | <10 |
| Qualification cycle | 12–24 months |
| Downtime cost | 5–10% |
| Licensing royalty | 5–10% |
What is included in the product
 Detailed Word Document
Tailored Porter's Five Forces analysis for Aalberts that uncovers key competitive drivers, supplier and buyer influence on pricing, threats from substitutes and new entrants, and emerging disruptive forces shaping its market position.

 Customizable Excel Spreadsheet
Aalberts Porter's Five Forces one-sheet distills supplier, buyer, entrant, substitute and rivalry pressures into actionable insights to relieve strategic pain points like margin squeeze and supply risk. Swap in company data, visualize impacts, and export clean slides for faster, board-ready decisions.
Customers Bargaining Power

Large OEMs and EPCs
Large OEMs, fabs and EPCs buy at scale via multi-billion-euro contracts and regularly demand price concessions, forcing Aalberts to trade margin for volume. Dual-sourcing policies by these customers intensify supplier competition and erode pricing power. Securing platform positions delivers high volumes but tighter gross margins and working-capital demands. Offering value-add integration and lifecycle service increases stickiness and boosts recurring revenue.
High qualification barriers
In semiconductors and hydronics, qualification cycles often run 12–24 months, creating high switching costs and locking specifications; requalification and line changes commonly exceed $1m for OEMs, which tempers customer price pressure. Suppliers capture much value in upfront negotiations, with contract margins secured early. Robust performance guarantees and reliability data (fail rates <0.1% in many sectors) further strengthen supplier leverage.

Digital and sustainability requirements
Customers increasingly demand IoT connectivity, efficiency metrics and low-carbon footprints, with global IoT spending around $1.1 trillion in 2024 and the EU CSRD extending mandatory ESG reporting to roughly 50,000 firms from 2024, shifting compliance costs and standards toward buyers. This transfer of standards raises buyer bargaining power, but turnkey, compliant solutions from suppliers curb commoditization. Transparent, auditable ESG data becomes a commercial differentiator rather than a cost center.

Aftermarket and MRO leverage
Recurring parts and service lower buyer power via installed-base specificity, locking customers into Aalberts' MRO ecosystem. Customers still demand framework discounts and uptime SLAs, exerting price pressure. Bundled maintenance and data-driven predictive service raise switching costs and perceived value, supporting premium pricing.
- installed-base specificity
- framework discounts & uptime SLAs
- bundled maintenance protects pricing
- predictive service increases value
Project cyclicality
Construction and capex cycles in 2024 amplified buyer bargaining during downturns as project delays concentrated ordering; peak cycles conversely shifted leverage to suppliers when capacity tightened. Aalberts’ diversified end markets in 2024 smoothed demand swings, while flexible pricing models and 6–12 month backlog visibility helped balance negotiations.
- Downturns increase buyer leverage
- Peaks favor suppliers with tight capacity
- Diversification smooths volatility
- Flexible pricing + 6–12m backlog aids negotiations
OEM scale squeezes prices; long requalification and services sustain premium margins
Large OEMs' scale and dual-sourcing push price concessions, but 12–24m requalification cycles and installed-base specificity raise switching costs; lifecycle services and predictive maintenance shift value to Aalberts, supporting premium pricing. 2024 IoT demand and ESG rules increase spec complexity, tempering pure price competition.
| Metric | 2024 Value |
|---|---|
| IoT spending | $1.1 trillion |
| Requalification cost | >$1m |
| Typical requal time | 12–24 months |
| Fail rates | <0.1% |
| Backlog visibility | 6–12 months |
Full Version Awaits
Aalberts Porter's Five Forces Analysis
This preview shows the exact Aalberts Porter's Five Forces analysis you'll receive after purchase—no placeholders, no surprises. The file is fully formatted and professionally written. It's ready for immediate download and use. What you see is exactly what you'll get.

Elevate Your Analysis with the Complete Porter's Five Forces Analysis
Aalberts faces moderate supplier power, fragmented buyers, steady threat of new entrants, strong rivalry in niche advanced-engineering markets, and evolving substitute risks driven by digitalization and sustainability trends. This brief snapshot only scratches the surface. Unlock the full Porter's Five Forces Analysis to explore Aalberts’s competitive dynamics, market pressures, and strategic advantages in detail.
Suppliers Bargaining Power
Specialty materials concentration
Dependence on specialty alloys, high-performance polymers and precision components gives niche suppliers leverage, especially where inputs must meet ultra-pure specifications (semiconductor-grade 6N purity, battery materials >99.9%). In semiconductor and e-mobility supply chains the need for such high-spec inputs narrows the qualified supplier base. Long qualification cycles (typically 12–24 months) raise switching costs for Aalberts. Multi-sourcing and strategic inventories partially offset concentration risk.
Process chemicals and gases
Semiconductor efficiency depends on certified process chemicals and gases supplied by fewer than 10 compliant global providers, concentrating bargaining power and raising risk of supply shocks that can extend lead times by weeks and compress margins. Framework agreements and hedging are widely used to stabilize costs and cap volatility. Closer technical collaboration on specifications can secure priority allocation from constrained suppliers.
Advanced manufacturing equipment
CNC, coating and surface-treatment equipment suppliers can dictate uptime and service terms, with spare-parts and maintenance contracts creating entrenched dependency; equipment downtime can cost manufacturers up to 5-10% of annual output value. Aalberts’ 2024 scale (revenue ~EUR 4.2bn) enables negotiated SLAs and bundled capital/service purchases, lowering unit service costs. Robust internal engineering teams reduce single-source exposure by qualifying alternatives and performing in-house repairs.
Energy and logistics inputs
Energy-intensive processes raise Aalberts' exposure to utility providers and fuel markets; by 2024 long-term PPAs and efficiency projects increasingly insulated margins. Global logistics constraints pressured freight costs and delivery reliability, though 2024 saw freight rates ease from 2022 peaks per Drewry. Regionalized production and nearshoring cut transit risk and variability.
- Energy exposure: PPAs, efficiency
- Logistics: 2024 easing vs 2022 peaks (Drewry)
- Mitigation: nearshoring, regionalization
- Contracts: long-term deals curb volatility
IP and technology licensors
Access to coatings, valves and control tech often requires licensing or co-development; licensors commonly command royalty rates of about 5–10% on revenues for industrial IP, giving them tangible pricing power over critical know-how. Building proprietary IP or acquiring patents reduces reliance and margin exposure. Joint ventures and co-development deals routinely split R&D and roadmap risk—often sharing 30–50% of development costs.
- Licensing royalty pressure: 5–10% typical
- Proprietary IP: lowers supplier dependence
- JVs/co-dev: share 30–50% of R&D/roadmap risk
Supply concentration, 12–24 months qualification and 5–10% downtime/royalties
Specialty inputs (semiconductor-grade, 6N; battery >99.9%) and certified gases (<10 global suppliers) concentrate supplier power; qualification cycles 12–24 months raise switching costs. Equipment/service vendors drive uptime risk (downtime 5–10% output value). Licensing royalties 5–10% and energy/logistics exposure persist; Aalberts scale (2024 revenue ~EUR 4.2bn) and PPAs, nearshoring mitigate.
| Metric | Value |
|---|---|
| 2024 revenue | EUR 4.2bn |
| Process gas suppliers | <10 |
| Qualification cycle | 12–24 months |
| Downtime cost | 5–10% |
| Licensing royalty | 5–10% |
What is included in the product
Detailed Word Document
Tailored Porter's Five Forces analysis for Aalberts that uncovers key competitive drivers, supplier and buyer influence on pricing, threats from substitutes and new entrants, and emerging disruptive forces shaping its market position.
Customizable Excel Spreadsheet
Aalberts Porter's Five Forces one-sheet distills supplier, buyer, entrant, substitute and rivalry pressures into actionable insights to relieve strategic pain points like margin squeeze and supply risk. Swap in company data, visualize impacts, and export clean slides for faster, board-ready decisions.
Customers Bargaining Power
Large OEMs and EPCs
Large OEMs, fabs and EPCs buy at scale via multi-billion-euro contracts and regularly demand price concessions, forcing Aalberts to trade margin for volume. Dual-sourcing policies by these customers intensify supplier competition and erode pricing power. Securing platform positions delivers high volumes but tighter gross margins and working-capital demands. Offering value-add integration and lifecycle service increases stickiness and boosts recurring revenue.
High qualification barriers
In semiconductors and hydronics, qualification cycles often run 12–24 months, creating high switching costs and locking specifications; requalification and line changes commonly exceed $1m for OEMs, which tempers customer price pressure. Suppliers capture much value in upfront negotiations, with contract margins secured early. Robust performance guarantees and reliability data (fail rates <0.1% in many sectors) further strengthen supplier leverage.
Digital and sustainability requirements
Customers increasingly demand IoT connectivity, efficiency metrics and low-carbon footprints, with global IoT spending around $1.1 trillion in 2024 and the EU CSRD extending mandatory ESG reporting to roughly 50,000 firms from 2024, shifting compliance costs and standards toward buyers. This transfer of standards raises buyer bargaining power, but turnkey, compliant solutions from suppliers curb commoditization. Transparent, auditable ESG data becomes a commercial differentiator rather than a cost center.
Aftermarket and MRO leverage
Recurring parts and service lower buyer power via installed-base specificity, locking customers into Aalberts' MRO ecosystem. Customers still demand framework discounts and uptime SLAs, exerting price pressure. Bundled maintenance and data-driven predictive service raise switching costs and perceived value, supporting premium pricing.
- installed-base specificity
- framework discounts & uptime SLAs
- bundled maintenance protects pricing
- predictive service increases value
Project cyclicality
Construction and capex cycles in 2024 amplified buyer bargaining during downturns as project delays concentrated ordering; peak cycles conversely shifted leverage to suppliers when capacity tightened. Aalberts’ diversified end markets in 2024 smoothed demand swings, while flexible pricing models and 6–12 month backlog visibility helped balance negotiations.
- Downturns increase buyer leverage
- Peaks favor suppliers with tight capacity
- Diversification smooths volatility
- Flexible pricing + 6–12m backlog aids negotiations
OEM scale squeezes prices; long requalification and services sustain premium margins
Large OEMs' scale and dual-sourcing push price concessions, but 12–24m requalification cycles and installed-base specificity raise switching costs; lifecycle services and predictive maintenance shift value to Aalberts, supporting premium pricing. 2024 IoT demand and ESG rules increase spec complexity, tempering pure price competition.
| Metric | 2024 Value |
|---|---|
| IoT spending | $1.1 trillion |
| Requalification cost | >$1m |
| Typical requal time | 12–24 months |
| Fail rates | <0.1% |
| Backlog visibility | 6–12 months |
Full Version Awaits
Aalberts Porter's Five Forces Analysis
This preview shows the exact Aalberts Porter's Five Forces analysis you'll receive after purchase—no placeholders, no surprises. The file is fully formatted and professionally written. It's ready for immediate download and use. What you see is exactly what you'll get.
Original: $10.00
-65%$10.00
$3.50Description
Elevate Your Analysis with the Complete Porter's Five Forces Analysis
Aalberts faces moderate supplier power, fragmented buyers, steady threat of new entrants, strong rivalry in niche advanced-engineering markets, and evolving substitute risks driven by digitalization and sustainability trends. This brief snapshot only scratches the surface. Unlock the full Porter's Five Forces Analysis to explore Aalberts’s competitive dynamics, market pressures, and strategic advantages in detail.
Suppliers Bargaining Power
Specialty materials concentration
Dependence on specialty alloys, high-performance polymers and precision components gives niche suppliers leverage, especially where inputs must meet ultra-pure specifications (semiconductor-grade 6N purity, battery materials >99.9%). In semiconductor and e-mobility supply chains the need for such high-spec inputs narrows the qualified supplier base. Long qualification cycles (typically 12–24 months) raise switching costs for Aalberts. Multi-sourcing and strategic inventories partially offset concentration risk.
Process chemicals and gases
Semiconductor efficiency depends on certified process chemicals and gases supplied by fewer than 10 compliant global providers, concentrating bargaining power and raising risk of supply shocks that can extend lead times by weeks and compress margins. Framework agreements and hedging are widely used to stabilize costs and cap volatility. Closer technical collaboration on specifications can secure priority allocation from constrained suppliers.
Advanced manufacturing equipment
CNC, coating and surface-treatment equipment suppliers can dictate uptime and service terms, with spare-parts and maintenance contracts creating entrenched dependency; equipment downtime can cost manufacturers up to 5-10% of annual output value. Aalberts’ 2024 scale (revenue ~EUR 4.2bn) enables negotiated SLAs and bundled capital/service purchases, lowering unit service costs. Robust internal engineering teams reduce single-source exposure by qualifying alternatives and performing in-house repairs.
Energy and logistics inputs
Energy-intensive processes raise Aalberts' exposure to utility providers and fuel markets; by 2024 long-term PPAs and efficiency projects increasingly insulated margins. Global logistics constraints pressured freight costs and delivery reliability, though 2024 saw freight rates ease from 2022 peaks per Drewry. Regionalized production and nearshoring cut transit risk and variability.
- Energy exposure: PPAs, efficiency
- Logistics: 2024 easing vs 2022 peaks (Drewry)
- Mitigation: nearshoring, regionalization
- Contracts: long-term deals curb volatility
IP and technology licensors
Access to coatings, valves and control tech often requires licensing or co-development; licensors commonly command royalty rates of about 5–10% on revenues for industrial IP, giving them tangible pricing power over critical know-how. Building proprietary IP or acquiring patents reduces reliance and margin exposure. Joint ventures and co-development deals routinely split R&D and roadmap risk—often sharing 30–50% of development costs.
- Licensing royalty pressure: 5–10% typical
- Proprietary IP: lowers supplier dependence
- JVs/co-dev: share 30–50% of R&D/roadmap risk
Supply concentration, 12–24 months qualification and 5–10% downtime/royalties
Specialty inputs (semiconductor-grade, 6N; battery >99.9%) and certified gases (<10 global suppliers) concentrate supplier power; qualification cycles 12–24 months raise switching costs. Equipment/service vendors drive uptime risk (downtime 5–10% output value). Licensing royalties 5–10% and energy/logistics exposure persist; Aalberts scale (2024 revenue ~EUR 4.2bn) and PPAs, nearshoring mitigate.
| Metric | Value |
|---|---|
| 2024 revenue | EUR 4.2bn |
| Process gas suppliers | <10 |
| Qualification cycle | 12–24 months |
| Downtime cost | 5–10% |
| Licensing royalty | 5–10% |
What is included in the product
Detailed Word Document
Tailored Porter's Five Forces analysis for Aalberts that uncovers key competitive drivers, supplier and buyer influence on pricing, threats from substitutes and new entrants, and emerging disruptive forces shaping its market position.
Customizable Excel Spreadsheet
Aalberts Porter's Five Forces one-sheet distills supplier, buyer, entrant, substitute and rivalry pressures into actionable insights to relieve strategic pain points like margin squeeze and supply risk. Swap in company data, visualize impacts, and export clean slides for faster, board-ready decisions.
Customers Bargaining Power
Large OEMs and EPCs
Large OEMs, fabs and EPCs buy at scale via multi-billion-euro contracts and regularly demand price concessions, forcing Aalberts to trade margin for volume. Dual-sourcing policies by these customers intensify supplier competition and erode pricing power. Securing platform positions delivers high volumes but tighter gross margins and working-capital demands. Offering value-add integration and lifecycle service increases stickiness and boosts recurring revenue.
High qualification barriers
In semiconductors and hydronics, qualification cycles often run 12–24 months, creating high switching costs and locking specifications; requalification and line changes commonly exceed $1m for OEMs, which tempers customer price pressure. Suppliers capture much value in upfront negotiations, with contract margins secured early. Robust performance guarantees and reliability data (fail rates <0.1% in many sectors) further strengthen supplier leverage.
Digital and sustainability requirements
Customers increasingly demand IoT connectivity, efficiency metrics and low-carbon footprints, with global IoT spending around $1.1 trillion in 2024 and the EU CSRD extending mandatory ESG reporting to roughly 50,000 firms from 2024, shifting compliance costs and standards toward buyers. This transfer of standards raises buyer bargaining power, but turnkey, compliant solutions from suppliers curb commoditization. Transparent, auditable ESG data becomes a commercial differentiator rather than a cost center.
Aftermarket and MRO leverage
Recurring parts and service lower buyer power via installed-base specificity, locking customers into Aalberts' MRO ecosystem. Customers still demand framework discounts and uptime SLAs, exerting price pressure. Bundled maintenance and data-driven predictive service raise switching costs and perceived value, supporting premium pricing.
- installed-base specificity
- framework discounts & uptime SLAs
- bundled maintenance protects pricing
- predictive service increases value
Project cyclicality
Construction and capex cycles in 2024 amplified buyer bargaining during downturns as project delays concentrated ordering; peak cycles conversely shifted leverage to suppliers when capacity tightened. Aalberts’ diversified end markets in 2024 smoothed demand swings, while flexible pricing models and 6–12 month backlog visibility helped balance negotiations.
- Downturns increase buyer leverage
- Peaks favor suppliers with tight capacity
- Diversification smooths volatility
- Flexible pricing + 6–12m backlog aids negotiations
OEM scale squeezes prices; long requalification and services sustain premium margins
Large OEMs' scale and dual-sourcing push price concessions, but 12–24m requalification cycles and installed-base specificity raise switching costs; lifecycle services and predictive maintenance shift value to Aalberts, supporting premium pricing. 2024 IoT demand and ESG rules increase spec complexity, tempering pure price competition.
| Metric | 2024 Value |
|---|---|
| IoT spending | $1.1 trillion |
| Requalification cost | >$1m |
| Typical requal time | 12–24 months |
| Fail rates | <0.1% |
| Backlog visibility | 6–12 months |
Full Version Awaits
Aalberts Porter's Five Forces Analysis
This preview shows the exact Aalberts Porter's Five Forces analysis you'll receive after purchase—no placeholders, no surprises. The file is fully formatted and professionally written. It's ready for immediate download and use. What you see is exactly what you'll get.











