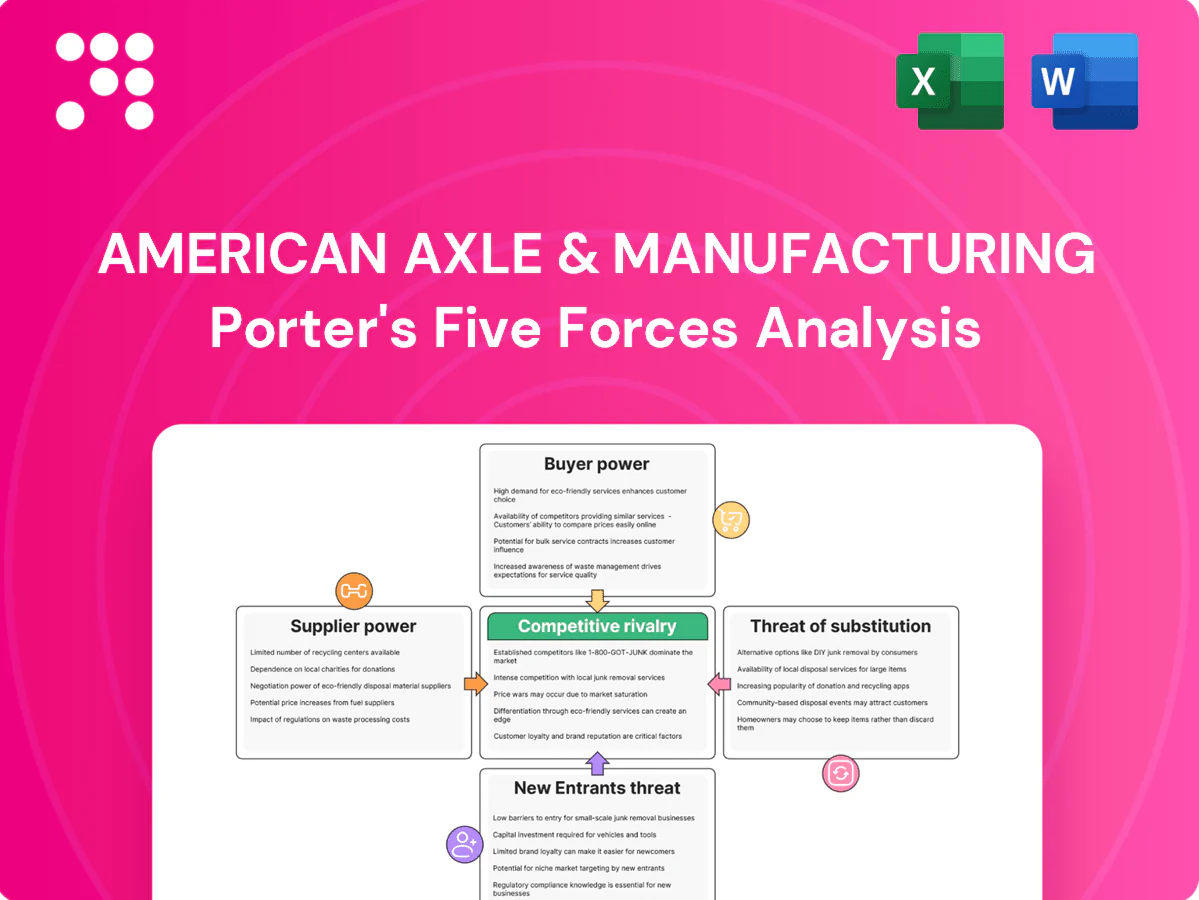
American Axle & Manufacturing Porter's Five Forces Analysis

From Overview to Strategy Blueprint
American Axle & Manufacturing faces intense rivalry, moderate supplier leverage due to specialized components, disciplined buyer power from OEMs, and manageable threats from new entrants and substitutes—yet regulatory shifts and electrification add uncertainty; this brief snapshot only scratches the surface, unlock the full Porter's Five Forces Analysis for a complete, data-driven strategic breakdown.
Suppliers Bargaining Power

Concentrated critical materials
Suppliers of specialty steels, aluminum alloys and e-motor magnets are concentrated, raising pricing and allocation leverage; China accounted for about 55% of global crude steel output and roughly 60% of refined rare-earth processing in 2023 (World Steel Assoc, USGS 2024). Scarcity and export controls have tightened availability and lengthened lead times for magnets and niche alloys. AAM’s scale improves negotiating power, but many specialty grades remain non-fungible and dual-sourcing is limited.
Semiconductor and electronics dependence
E-drive inverters, controllers and sensors rely on constrained chip supply; industry surveys in 2024 show automotive semiconductor lead times averaging over 20 weeks, keeping bargaining power with suppliers elevated. Tier-2/3 electronics vendors can pass through price increases or allocate volumes to larger OEM programs, squeezing suppliers like American Axle. Long qualification cycles of 12–24 months make rapid switching risky. Buffer inventories and design flexibility reduce but do not eliminate exposure to shortages and price volatility.

Switching and qualification costs
Automotive PPAP (levels 1–5) and lengthy validation cycles—commonly 3–9 months—plus tooling investments often ranging from $100k–$2M make supplier changes costly and slow, giving incumbent suppliers bargaining room during production disruptions. AAM’s in-house metal forming and vertical scope reduce exposure and procurement spend on stamped and forged parts, but many precision components and certified subassemblies still require external, certified suppliers. This mix sustains supplier leverage in negotiations, especially under capacity constraints.

Logistics and energy volatility
Logistics and energy volatility raise AAM inbound costs as 2024 average Brent ~83 USD/bbl and global container rates averaged ~1,200 USD/FEU, while route disruptions push carriers to apply surcharges or renegotiate contracts. Suppliers routinely levy fuel surcharges up to 15% during spikes; hedging and regionalizing sourcing can mitigate exposure but cross-border complexity and local content rules (e.g., USMCA, IRA) constrain options.
- Global freight ~1,200 USD/FEU (2024)
- Brent ~83 USD/bbl (2024)
- Fuel surcharges up to 15% during spikes
- Hedging/regionalization reduce but do not eliminate risks
Long-term contracts with pass-throughs
Multi-year supplier contracts with raw-material indices have tempered supplier power for American Axle & Manufacturing, though index lag and 2024 surcharges (about 15% on key commodities) compressed near-term margins; joint cost-reduction roadmaps and monthly KPI reviews helped realign incentives, while performance clauses and tiered penalties provided leverage against quality or delivery lapses.
- Index pass-throughs: lower long-term risk
- 2024 surcharge ~15%: short-term margin pressure
- Joint roadmaps: shared savings
- Performance clauses: enforcement leverage
Supplier power: China ~55%/~60%, chips >20w, surcharges ~15%
Supplier power is elevated due to concentrated specialty steel/magnet supply (China ~55% crude steel, ~60% rare-earth processing 2023/24), semiconductor lead times >20 weeks, and costly qualification/tooling. AAM’s vertical scope and multi-year indexed contracts mitigate but 2024 surcharges (~15%), Brent ~83 USD/bbl and freight ~1,200 USD/FEU sustain pressure.
| Metric | 2024 |
|---|---|
| China share (steel/rare earth) | ~55% / ~60% |
| Chip lead times | >20 weeks |
| Brent | ~83 USD/bbl |
| Freight | ~1,200 USD/FEU |
| Surcharges | ~15% |
What is included in the product
 Detailed Word Document
Tailored Porter's Five Forces analysis for American Axle & Manufacturing uncovering competitive intensity, supplier and buyer leverage, threat of substitutes and entrants, and strategic vulnerabilities and opportunities.

 Customizable Excel Spreadsheet
AAM-specific one-sheet summarizing all five forces—supplier power, buyer pressure, rivalry, substitutes and entrants—so executives can quickly assess auto-supply-chain risks and prioritize strategic responses.
Customers Bargaining Power

Highly concentrated OEM base
Global automakers and large commercial-vehicle OEMs exert strong volume leverage over American Axle, with platform awards often valued in the $500 million–$2 billion range and fiercely contested across suppliers. Platform wins drive large production volumes and compress margins through aggressive pricing and terms. AXL's top five customers represented roughly 65% of 2024 revenue, concentrating sales and elevating buyer power.
Cost-down and productivity demands
Buyers enforce annual price-downs with VA/VE and open-book costing now standard, pressuring suppliers to hit industry cost-down targets of roughly 3–5% in 2024.
OEMs demand continuous efficiency gains and localization benefits; missed productivity targets frequently lead to loss of program awards.
AAM must counter via automation, scale-driven design-to-cost and value-engineering to preserve margins and retain contracts.

Engineering collaboration vs commoditization
Where AAM delivers integrated e-axles or advanced driveline systems, differentiation reduces buyer power and supports higher margins; AAM reported roughly $2.7 billion in revenue in 2024, underscoring scale in advanced programs. For standardized shafts or forgings, comparability raises substitution risk and strengthens customer bargaining. Early co-development embeds AAM in platform architecture, while late-stage sourcing shifts leverage to buyers and favors price competition.

Dual-sourcing and resourcing threats
OEMs maintain second sources to mitigate supply risk and preserve leverage; dual-sourcing is standard practice and sourcing advantages typically reset at platform refresh, commonly every 4–6 years (industry 2024 standard). Performance or cost gaps can trigger rapid resourcing on new programs, and incumbency mainly protects within a platform life. Scorecards and PPAP approval rates drive day-to-day leverage and contract awards.
- Dual-sourcing: preserves OEM leverage
- Platform refresh: resets incumbency (4–6 years)
- Triggers: performance/cost gaps prompt rapid resourcing
- Controls: scorecards and PPAP determine qualification
Warranty and penalty clauses
- risk-shift: strict OEM clauses
- impact: chargebacks/expedite ~1–2% revenue
- defense: field reliability protects pricing
- mitigation: data transparency, predictive quality
Top5 ~65% of $3.3B; VA/VE 3–5%, warranty 1–2%
Global OEMs concentrate purchasing power: AAM's top five customers ~65% of 2024 revenue; company reported $3.3B in 2024. Platform awards ($500M–$2B) and annual 3–5% VA/VE cost-downs compress margins. Dual-sourcing and 4–6 year platform refreshes reset leverage; strict warranty/chargebacks (~1–2% revenue) further erode profitability.
| Metric | 2024 |
|---|---|
| Revenue | $3.3B |
| Top5 share | ~65% |
| VA/VE targets | 3–5% |
| Chargebacks | ~1–2% |
Full Version Awaits
American Axle & Manufacturing Porter's Five Forces Analysis
This preview shows the exact, professionally formatted Porter’s Five Forces analysis of American Axle & Manufacturing you'll receive—no samples or placeholders. It covers supplier and buyer power, rivalry, substitutes, and barriers to entry, and is ready for immediate download and use right after purchase.

From Overview to Strategy Blueprint
American Axle & Manufacturing faces intense rivalry, moderate supplier leverage due to specialized components, disciplined buyer power from OEMs, and manageable threats from new entrants and substitutes—yet regulatory shifts and electrification add uncertainty; this brief snapshot only scratches the surface, unlock the full Porter's Five Forces Analysis for a complete, data-driven strategic breakdown.
Suppliers Bargaining Power
Concentrated critical materials
Suppliers of specialty steels, aluminum alloys and e-motor magnets are concentrated, raising pricing and allocation leverage; China accounted for about 55% of global crude steel output and roughly 60% of refined rare-earth processing in 2023 (World Steel Assoc, USGS 2024). Scarcity and export controls have tightened availability and lengthened lead times for magnets and niche alloys. AAM’s scale improves negotiating power, but many specialty grades remain non-fungible and dual-sourcing is limited.
Semiconductor and electronics dependence
E-drive inverters, controllers and sensors rely on constrained chip supply; industry surveys in 2024 show automotive semiconductor lead times averaging over 20 weeks, keeping bargaining power with suppliers elevated. Tier-2/3 electronics vendors can pass through price increases or allocate volumes to larger OEM programs, squeezing suppliers like American Axle. Long qualification cycles of 12–24 months make rapid switching risky. Buffer inventories and design flexibility reduce but do not eliminate exposure to shortages and price volatility.
Switching and qualification costs
Automotive PPAP (levels 1–5) and lengthy validation cycles—commonly 3–9 months—plus tooling investments often ranging from $100k–$2M make supplier changes costly and slow, giving incumbent suppliers bargaining room during production disruptions. AAM’s in-house metal forming and vertical scope reduce exposure and procurement spend on stamped and forged parts, but many precision components and certified subassemblies still require external, certified suppliers. This mix sustains supplier leverage in negotiations, especially under capacity constraints.
Logistics and energy volatility
Logistics and energy volatility raise AAM inbound costs as 2024 average Brent ~83 USD/bbl and global container rates averaged ~1,200 USD/FEU, while route disruptions push carriers to apply surcharges or renegotiate contracts. Suppliers routinely levy fuel surcharges up to 15% during spikes; hedging and regionalizing sourcing can mitigate exposure but cross-border complexity and local content rules (e.g., USMCA, IRA) constrain options.
- Global freight ~1,200 USD/FEU (2024)
- Brent ~83 USD/bbl (2024)
- Fuel surcharges up to 15% during spikes
- Hedging/regionalization reduce but do not eliminate risks
Long-term contracts with pass-throughs
Multi-year supplier contracts with raw-material indices have tempered supplier power for American Axle & Manufacturing, though index lag and 2024 surcharges (about 15% on key commodities) compressed near-term margins; joint cost-reduction roadmaps and monthly KPI reviews helped realign incentives, while performance clauses and tiered penalties provided leverage against quality or delivery lapses.
- Index pass-throughs: lower long-term risk
- 2024 surcharge ~15%: short-term margin pressure
- Joint roadmaps: shared savings
- Performance clauses: enforcement leverage
Supplier power: China ~55%/~60%, chips >20w, surcharges ~15%
Supplier power is elevated due to concentrated specialty steel/magnet supply (China ~55% crude steel, ~60% rare-earth processing 2023/24), semiconductor lead times >20 weeks, and costly qualification/tooling. AAM’s vertical scope and multi-year indexed contracts mitigate but 2024 surcharges (~15%), Brent ~83 USD/bbl and freight ~1,200 USD/FEU sustain pressure.
| Metric | 2024 |
|---|---|
| China share (steel/rare earth) | ~55% / ~60% |
| Chip lead times | >20 weeks |
| Brent | ~83 USD/bbl |
| Freight | ~1,200 USD/FEU |
| Surcharges | ~15% |
What is included in the product
Detailed Word Document
Tailored Porter's Five Forces analysis for American Axle & Manufacturing uncovering competitive intensity, supplier and buyer leverage, threat of substitutes and entrants, and strategic vulnerabilities and opportunities.
Customizable Excel Spreadsheet
AAM-specific one-sheet summarizing all five forces—supplier power, buyer pressure, rivalry, substitutes and entrants—so executives can quickly assess auto-supply-chain risks and prioritize strategic responses.
Customers Bargaining Power
Highly concentrated OEM base
Global automakers and large commercial-vehicle OEMs exert strong volume leverage over American Axle, with platform awards often valued in the $500 million–$2 billion range and fiercely contested across suppliers. Platform wins drive large production volumes and compress margins through aggressive pricing and terms. AXL's top five customers represented roughly 65% of 2024 revenue, concentrating sales and elevating buyer power.
Cost-down and productivity demands
Buyers enforce annual price-downs with VA/VE and open-book costing now standard, pressuring suppliers to hit industry cost-down targets of roughly 3–5% in 2024.
OEMs demand continuous efficiency gains and localization benefits; missed productivity targets frequently lead to loss of program awards.
AAM must counter via automation, scale-driven design-to-cost and value-engineering to preserve margins and retain contracts.
Engineering collaboration vs commoditization
Where AAM delivers integrated e-axles or advanced driveline systems, differentiation reduces buyer power and supports higher margins; AAM reported roughly $2.7 billion in revenue in 2024, underscoring scale in advanced programs. For standardized shafts or forgings, comparability raises substitution risk and strengthens customer bargaining. Early co-development embeds AAM in platform architecture, while late-stage sourcing shifts leverage to buyers and favors price competition.
Dual-sourcing and resourcing threats
OEMs maintain second sources to mitigate supply risk and preserve leverage; dual-sourcing is standard practice and sourcing advantages typically reset at platform refresh, commonly every 4–6 years (industry 2024 standard). Performance or cost gaps can trigger rapid resourcing on new programs, and incumbency mainly protects within a platform life. Scorecards and PPAP approval rates drive day-to-day leverage and contract awards.
- Dual-sourcing: preserves OEM leverage
- Platform refresh: resets incumbency (4–6 years)
- Triggers: performance/cost gaps prompt rapid resourcing
- Controls: scorecards and PPAP determine qualification
Warranty and penalty clauses
- risk-shift: strict OEM clauses
- impact: chargebacks/expedite ~1–2% revenue
- defense: field reliability protects pricing
- mitigation: data transparency, predictive quality
Top5 ~65% of $3.3B; VA/VE 3–5%, warranty 1–2%
Global OEMs concentrate purchasing power: AAM's top five customers ~65% of 2024 revenue; company reported $3.3B in 2024. Platform awards ($500M–$2B) and annual 3–5% VA/VE cost-downs compress margins. Dual-sourcing and 4–6 year platform refreshes reset leverage; strict warranty/chargebacks (~1–2% revenue) further erode profitability.
| Metric | 2024 |
|---|---|
| Revenue | $3.3B |
| Top5 share | ~65% |
| VA/VE targets | 3–5% |
| Chargebacks | ~1–2% |
Full Version Awaits
American Axle & Manufacturing Porter's Five Forces Analysis
This preview shows the exact, professionally formatted Porter’s Five Forces analysis of American Axle & Manufacturing you'll receive—no samples or placeholders. It covers supplier and buyer power, rivalry, substitutes, and barriers to entry, and is ready for immediate download and use right after purchase.
Description
From Overview to Strategy Blueprint
American Axle & Manufacturing faces intense rivalry, moderate supplier leverage due to specialized components, disciplined buyer power from OEMs, and manageable threats from new entrants and substitutes—yet regulatory shifts and electrification add uncertainty; this brief snapshot only scratches the surface, unlock the full Porter's Five Forces Analysis for a complete, data-driven strategic breakdown.
Suppliers Bargaining Power
Concentrated critical materials
Suppliers of specialty steels, aluminum alloys and e-motor magnets are concentrated, raising pricing and allocation leverage; China accounted for about 55% of global crude steel output and roughly 60% of refined rare-earth processing in 2023 (World Steel Assoc, USGS 2024). Scarcity and export controls have tightened availability and lengthened lead times for magnets and niche alloys. AAM’s scale improves negotiating power, but many specialty grades remain non-fungible and dual-sourcing is limited.
Semiconductor and electronics dependence
E-drive inverters, controllers and sensors rely on constrained chip supply; industry surveys in 2024 show automotive semiconductor lead times averaging over 20 weeks, keeping bargaining power with suppliers elevated. Tier-2/3 electronics vendors can pass through price increases or allocate volumes to larger OEM programs, squeezing suppliers like American Axle. Long qualification cycles of 12–24 months make rapid switching risky. Buffer inventories and design flexibility reduce but do not eliminate exposure to shortages and price volatility.
Switching and qualification costs
Automotive PPAP (levels 1–5) and lengthy validation cycles—commonly 3–9 months—plus tooling investments often ranging from $100k–$2M make supplier changes costly and slow, giving incumbent suppliers bargaining room during production disruptions. AAM’s in-house metal forming and vertical scope reduce exposure and procurement spend on stamped and forged parts, but many precision components and certified subassemblies still require external, certified suppliers. This mix sustains supplier leverage in negotiations, especially under capacity constraints.
Logistics and energy volatility
Logistics and energy volatility raise AAM inbound costs as 2024 average Brent ~83 USD/bbl and global container rates averaged ~1,200 USD/FEU, while route disruptions push carriers to apply surcharges or renegotiate contracts. Suppliers routinely levy fuel surcharges up to 15% during spikes; hedging and regionalizing sourcing can mitigate exposure but cross-border complexity and local content rules (e.g., USMCA, IRA) constrain options.
- Global freight ~1,200 USD/FEU (2024)
- Brent ~83 USD/bbl (2024)
- Fuel surcharges up to 15% during spikes
- Hedging/regionalization reduce but do not eliminate risks
Long-term contracts with pass-throughs
Multi-year supplier contracts with raw-material indices have tempered supplier power for American Axle & Manufacturing, though index lag and 2024 surcharges (about 15% on key commodities) compressed near-term margins; joint cost-reduction roadmaps and monthly KPI reviews helped realign incentives, while performance clauses and tiered penalties provided leverage against quality or delivery lapses.
- Index pass-throughs: lower long-term risk
- 2024 surcharge ~15%: short-term margin pressure
- Joint roadmaps: shared savings
- Performance clauses: enforcement leverage
Supplier power: China ~55%/~60%, chips >20w, surcharges ~15%
Supplier power is elevated due to concentrated specialty steel/magnet supply (China ~55% crude steel, ~60% rare-earth processing 2023/24), semiconductor lead times >20 weeks, and costly qualification/tooling. AAM’s vertical scope and multi-year indexed contracts mitigate but 2024 surcharges (~15%), Brent ~83 USD/bbl and freight ~1,200 USD/FEU sustain pressure.
| Metric | 2024 |
|---|---|
| China share (steel/rare earth) | ~55% / ~60% |
| Chip lead times | >20 weeks |
| Brent | ~83 USD/bbl |
| Freight | ~1,200 USD/FEU |
| Surcharges | ~15% |
What is included in the product
Detailed Word Document
Tailored Porter's Five Forces analysis for American Axle & Manufacturing uncovering competitive intensity, supplier and buyer leverage, threat of substitutes and entrants, and strategic vulnerabilities and opportunities.
Customizable Excel Spreadsheet
AAM-specific one-sheet summarizing all five forces—supplier power, buyer pressure, rivalry, substitutes and entrants—so executives can quickly assess auto-supply-chain risks and prioritize strategic responses.
Customers Bargaining Power
Highly concentrated OEM base
Global automakers and large commercial-vehicle OEMs exert strong volume leverage over American Axle, with platform awards often valued in the $500 million–$2 billion range and fiercely contested across suppliers. Platform wins drive large production volumes and compress margins through aggressive pricing and terms. AXL's top five customers represented roughly 65% of 2024 revenue, concentrating sales and elevating buyer power.
Cost-down and productivity demands
Buyers enforce annual price-downs with VA/VE and open-book costing now standard, pressuring suppliers to hit industry cost-down targets of roughly 3–5% in 2024.
OEMs demand continuous efficiency gains and localization benefits; missed productivity targets frequently lead to loss of program awards.
AAM must counter via automation, scale-driven design-to-cost and value-engineering to preserve margins and retain contracts.
Engineering collaboration vs commoditization
Where AAM delivers integrated e-axles or advanced driveline systems, differentiation reduces buyer power and supports higher margins; AAM reported roughly $2.7 billion in revenue in 2024, underscoring scale in advanced programs. For standardized shafts or forgings, comparability raises substitution risk and strengthens customer bargaining. Early co-development embeds AAM in platform architecture, while late-stage sourcing shifts leverage to buyers and favors price competition.
Dual-sourcing and resourcing threats
OEMs maintain second sources to mitigate supply risk and preserve leverage; dual-sourcing is standard practice and sourcing advantages typically reset at platform refresh, commonly every 4–6 years (industry 2024 standard). Performance or cost gaps can trigger rapid resourcing on new programs, and incumbency mainly protects within a platform life. Scorecards and PPAP approval rates drive day-to-day leverage and contract awards.
- Dual-sourcing: preserves OEM leverage
- Platform refresh: resets incumbency (4–6 years)
- Triggers: performance/cost gaps prompt rapid resourcing
- Controls: scorecards and PPAP determine qualification
Warranty and penalty clauses
- risk-shift: strict OEM clauses
- impact: chargebacks/expedite ~1–2% revenue
- defense: field reliability protects pricing
- mitigation: data transparency, predictive quality
Top5 ~65% of $3.3B; VA/VE 3–5%, warranty 1–2%
Global OEMs concentrate purchasing power: AAM's top five customers ~65% of 2024 revenue; company reported $3.3B in 2024. Platform awards ($500M–$2B) and annual 3–5% VA/VE cost-downs compress margins. Dual-sourcing and 4–6 year platform refreshes reset leverage; strict warranty/chargebacks (~1–2% revenue) further erode profitability.
| Metric | 2024 |
|---|---|
| Revenue | $3.3B |
| Top5 share | ~65% |
| VA/VE targets | 3–5% |
| Chargebacks | ~1–2% |
Full Version Awaits
American Axle & Manufacturing Porter's Five Forces Analysis
This preview shows the exact, professionally formatted Porter’s Five Forces analysis of American Axle & Manufacturing you'll receive—no samples or placeholders. It covers supplier and buyer power, rivalry, substitutes, and barriers to entry, and is ready for immediate download and use right after purchase.











