AAR Boston Consulting Group Matrix

Unlock Strategic Clarity
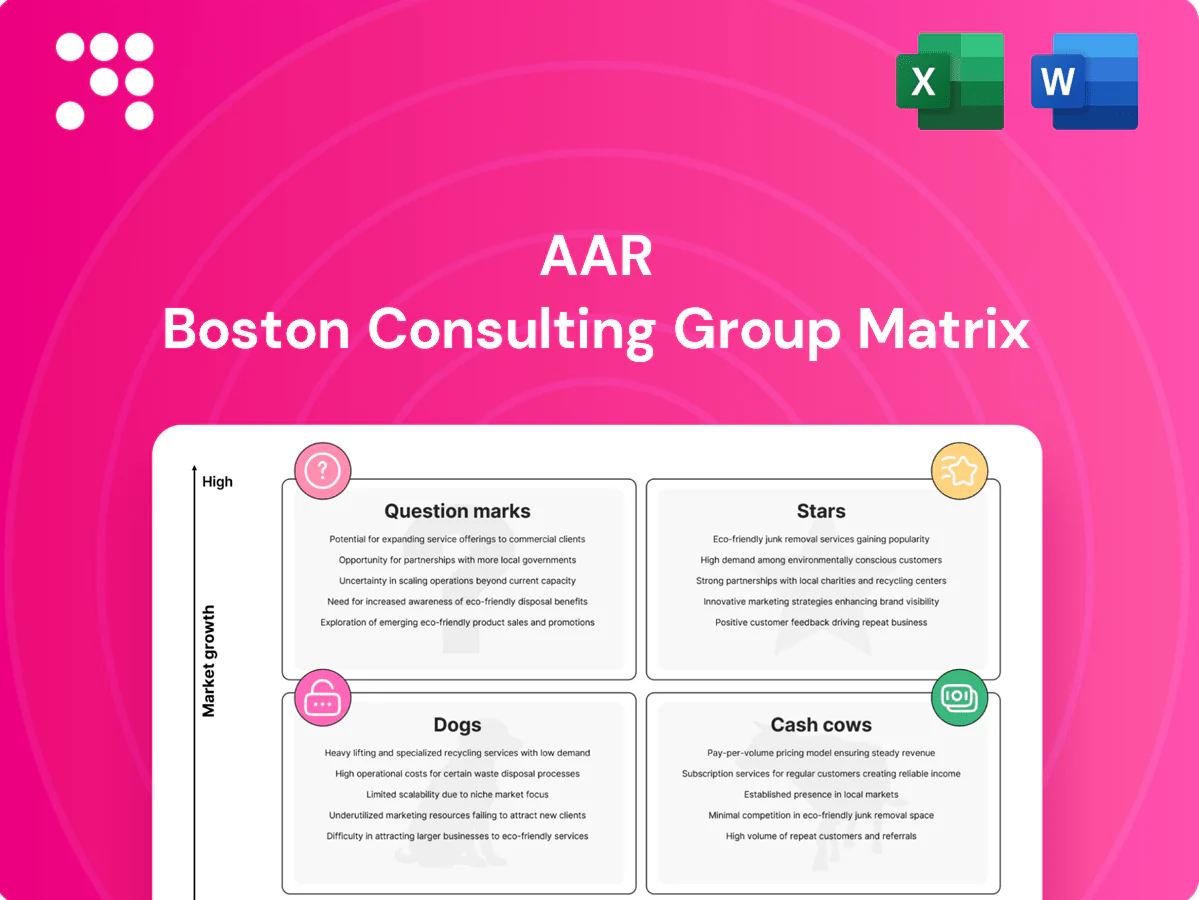
The AAR BCG Matrix snapshot shows where each business line sits—Stars driving growth, Cash Cows funding ops, Dogs dragging performance, and Question Marks begging a decision. Want the full picture with quadrant-level data, clear strategic moves, and ROI-minded recommendations? Purchase the complete BCG Matrix to get a Word report plus an Excel summary you can use straight away. Stop guessing—get the roadmap and act with confidence.
Stars

Integrated MRO programs
Integrated MRO programs at AAR leverage end-to-end aircraft and component services to capture fleet growth and higher utilization, serving more than 1,200 commercial and defense customers; FY2024 revenue roughly $1.7B underscores scale. Demand remained robust through 2024, so continued investment in capacity, faster turnarounds and certifications is warranted. Protecting this lead should push the segment toward Cash Cow as industry growth normalizes.
Power-by-the-hour style support
Usage-based support packages lock in customers and volumes, turning AAR into the default partner as the market scales—global air travel recovered to about 99% of 2019 levels in 2024 (IATA), supporting an estimated $86B commercial MRO market that year. These long contracts require upfront cash to stand up but yield durable, repeatable returns through contracted volumes and renewals. Prioritize investment in reliability data, predictive analytics and strengthened SLAs to widen the competitive moat and increase lifetime value.

Global parts distribution
Airlines need parts now, not later — AOG events can cost carriers up to 150,000 per hour, and AAR’s global parts distribution network across 29 countries provides rapid AOG response and high share in key hubs. Share is strong and on-time performance is a clear differentiator. Working capital is inventory-heavy, but inventory velocity (industry aftermarket turns ~4–6x) offsets cash drag; scaling SKU breadth and smart demand planning keeps the flywheel spinning.

Government and defense sustainment
Defense fleets require dependable depot work and logistics, and AAR’s 70-year credentials and standing DoD contracts position it well. US defense discretionary funding was roughly $858 billion in FY2024, keeping task orders flowing while allied readiness spending grows. Reputation and flawless compliance determine first-call status.
- Depot reliability
- $858B FY2024 defense funding
- Task orders steady
- Allied fleet growth
- Strict compliance = priority supplier
AOG and critical logistics
AOG and critical logistics are Stars: minutes matter when an aircraft is on ground and AAR’s rapid logistics routinely convert downtime into mission wins. The global MRO market was about $82B in 2024 with ~4% CAGR, and AOG events can cost operators $10,000–$150,000 per hour, so high service levels and network readiness drive loyalty despite cash intensity. Continue expanding lanes, hubs, and 24/7 coverage to defend leadership.
- Market size: $82B (2024)
- AOG cost: $10k–$150k/hour
- High Opex on network readiness, high payback in repeat revenue
- Priority: expand lanes, hubs, 24/7 coverage
Integrated MRO and AOG: FY2024 revenue $1.7B, global MRO $82B
AAR Stars: integrated MRO and AOG deliver high growth and market leadership—FY2024 revenue ~$1.7B; global MRO ~$82B (2024) with ~4% CAGR. AOG urgency (cost $10k–$150k/hr) and 29-country parts network drive durable contracts and repeatable margins despite inventory intensity. Defense backlog benefits from ~$858B US FY2024 defense funding; invest in predictive analytics and hub expansion to secure Cash Cow transition.
| Metric | 2024 |
|---|---|
| FY revenue | $1.7B |
| Global MRO | $82B |
| AOG cost/hr | $10k–$150k |
| US defense spend | $858B |
What is included in the product
 Detailed Word Document
Comprehensive BCG Matrix review pinpointing Stars, Cash Cows, Question Marks, Dogs with investment guidance and competitive context.

 Customizable Excel Spreadsheet
One-page AAR BCG Matrix that pinpoints underperformers and winners—clear actions, ready to export for fast C-level decisions.
Cash Cows

Component repair shops
High-utilization, repeatable worksops and certifications make steady cash; component shops typically run >75% utilization and underpin AAR’s aftermarket cash flow. Margins benefit from process discipline and throughput; AAR’s aftermarket margins were in the mid-teens in 2024. Growth is modest but share entrenched in a global MRO market ~80B in 2024; lean and automation projects can squeeze more yield with limited spend.
Long-term distribution agreements
Long-term distribution agreements deliver contracted volume and predictable turns, creating baked-in relationships that throw off reliable cash rather than flashy growth.
Working capital becomes known and controllable under these contracts, allowing tighter inventory turns and lower day sales outstanding.
Maintain service levels, renegotiate pricing and lead times smartly, and continuously milk process and procurement efficiencies to sustain cash generation.

Legacy platform sustainment
Legacy platform sustainment supports mature fleets that still fly and need predictable support; global commercial MRO demand was about 85 billion USD in 2024 while fleet age averaged roughly 12 years, so parts and repairs remain steady even with flat flight-hour growth. Pricing power stays stable where AAR holds approvals; optimizing inventory turnover and consolidating sites preserves gross margins.

Line maintenance partnerships
Line maintenance partnerships deliver repeat airport-line checks using standard playbooks; the global MRO market was about $88B in 2024 with low growth (~2%), while renewal rates near 90% keep cash flow steady.
Profit relies on tight labor planning and dispatch accuracy—better dispatch can cut AOG-related costs by ~10%; invest minimally in tooling and training (~2–4% of service revenue) to maintain uptime.
- Renewal rate: ~90%
- Market growth: ~2% (2024)
- Tooling/training CAPEX: 2–4% rev
- Dispatch accuracy reduces AOG ≈10%
Kitting and provisioning services
Kitting and provisioning services at AAR act as a cash cow: standardized kits for checks and mods sustain dependable gross margins near 30% while growth remains constrained by replacement-cycle demand. Operational excellence and tight supplier ties in 2024 cut inventory waste and improve forecast accuracy, compounding free cash flow. Keep cycle times tight to sustain quick cash conversion.
- Margin: ~30%
- Low growth, high FCF
- Forecasting cuts waste
- Supplier ties reduce lead times
- Short cycle = fast cash conversion
High-utilization fuels steady cash — 75%+, $85-88B MRO
High-utilization shops (>75%) and long-term contracts produce steady cash; aftermarket margins mid-teens in 2024 and kitting margins ~30%. Global MRO ~85–88B in 2024 with ~2% growth; renewal ~90% and tooling/training CAPEX 2–4% rev sustain FCF.
| Metric | 2024 |
|---|---|
| Global MRO | $85–88B |
| Growth | ~2% |
| Aftermarket margin | Mid-teens |
| Kitting margin | ~30% |
| Renewal rate | ~90% |
What You’re Viewing Is Included
AAR BCG Matrix
The file you're previewing here is the exact AAR BCG Matrix report you'll receive after purchase—no watermarks, no placeholders, just the finished deliverable. It's fully formatted and editable, so you can plug it straight into presentations or strategy sessions. Crafted for clarity by strategic analysts, the document arrives ready to use. Buy once, download instantly, and start presenting with confidence.

Unlock Strategic Clarity
The AAR BCG Matrix snapshot shows where each business line sits—Stars driving growth, Cash Cows funding ops, Dogs dragging performance, and Question Marks begging a decision. Want the full picture with quadrant-level data, clear strategic moves, and ROI-minded recommendations? Purchase the complete BCG Matrix to get a Word report plus an Excel summary you can use straight away. Stop guessing—get the roadmap and act with confidence.
Stars
Integrated MRO programs
Integrated MRO programs at AAR leverage end-to-end aircraft and component services to capture fleet growth and higher utilization, serving more than 1,200 commercial and defense customers; FY2024 revenue roughly $1.7B underscores scale. Demand remained robust through 2024, so continued investment in capacity, faster turnarounds and certifications is warranted. Protecting this lead should push the segment toward Cash Cow as industry growth normalizes.
Power-by-the-hour style support
Usage-based support packages lock in customers and volumes, turning AAR into the default partner as the market scales—global air travel recovered to about 99% of 2019 levels in 2024 (IATA), supporting an estimated $86B commercial MRO market that year. These long contracts require upfront cash to stand up but yield durable, repeatable returns through contracted volumes and renewals. Prioritize investment in reliability data, predictive analytics and strengthened SLAs to widen the competitive moat and increase lifetime value.
Global parts distribution
Airlines need parts now, not later — AOG events can cost carriers up to 150,000 per hour, and AAR’s global parts distribution network across 29 countries provides rapid AOG response and high share in key hubs. Share is strong and on-time performance is a clear differentiator. Working capital is inventory-heavy, but inventory velocity (industry aftermarket turns ~4–6x) offsets cash drag; scaling SKU breadth and smart demand planning keeps the flywheel spinning.
Government and defense sustainment
Defense fleets require dependable depot work and logistics, and AAR’s 70-year credentials and standing DoD contracts position it well. US defense discretionary funding was roughly $858 billion in FY2024, keeping task orders flowing while allied readiness spending grows. Reputation and flawless compliance determine first-call status.
- Depot reliability
- $858B FY2024 defense funding
- Task orders steady
- Allied fleet growth
- Strict compliance = priority supplier
AOG and critical logistics
AOG and critical logistics are Stars: minutes matter when an aircraft is on ground and AAR’s rapid logistics routinely convert downtime into mission wins. The global MRO market was about $82B in 2024 with ~4% CAGR, and AOG events can cost operators $10,000–$150,000 per hour, so high service levels and network readiness drive loyalty despite cash intensity. Continue expanding lanes, hubs, and 24/7 coverage to defend leadership.
- Market size: $82B (2024)
- AOG cost: $10k–$150k/hour
- High Opex on network readiness, high payback in repeat revenue
- Priority: expand lanes, hubs, 24/7 coverage
Integrated MRO and AOG: FY2024 revenue $1.7B, global MRO $82B
AAR Stars: integrated MRO and AOG deliver high growth and market leadership—FY2024 revenue ~$1.7B; global MRO ~$82B (2024) with ~4% CAGR. AOG urgency (cost $10k–$150k/hr) and 29-country parts network drive durable contracts and repeatable margins despite inventory intensity. Defense backlog benefits from ~$858B US FY2024 defense funding; invest in predictive analytics and hub expansion to secure Cash Cow transition.
| Metric | 2024 |
|---|---|
| FY revenue | $1.7B |
| Global MRO | $82B |
| AOG cost/hr | $10k–$150k |
| US defense spend | $858B |
What is included in the product
Detailed Word Document
Comprehensive BCG Matrix review pinpointing Stars, Cash Cows, Question Marks, Dogs with investment guidance and competitive context.
Customizable Excel Spreadsheet
One-page AAR BCG Matrix that pinpoints underperformers and winners—clear actions, ready to export for fast C-level decisions.
Cash Cows
Component repair shops
High-utilization, repeatable worksops and certifications make steady cash; component shops typically run >75% utilization and underpin AAR’s aftermarket cash flow. Margins benefit from process discipline and throughput; AAR’s aftermarket margins were in the mid-teens in 2024. Growth is modest but share entrenched in a global MRO market ~80B in 2024; lean and automation projects can squeeze more yield with limited spend.
Long-term distribution agreements
Long-term distribution agreements deliver contracted volume and predictable turns, creating baked-in relationships that throw off reliable cash rather than flashy growth.
Working capital becomes known and controllable under these contracts, allowing tighter inventory turns and lower day sales outstanding.
Maintain service levels, renegotiate pricing and lead times smartly, and continuously milk process and procurement efficiencies to sustain cash generation.
Legacy platform sustainment
Legacy platform sustainment supports mature fleets that still fly and need predictable support; global commercial MRO demand was about 85 billion USD in 2024 while fleet age averaged roughly 12 years, so parts and repairs remain steady even with flat flight-hour growth. Pricing power stays stable where AAR holds approvals; optimizing inventory turnover and consolidating sites preserves gross margins.
Line maintenance partnerships
Line maintenance partnerships deliver repeat airport-line checks using standard playbooks; the global MRO market was about $88B in 2024 with low growth (~2%), while renewal rates near 90% keep cash flow steady.
Profit relies on tight labor planning and dispatch accuracy—better dispatch can cut AOG-related costs by ~10%; invest minimally in tooling and training (~2–4% of service revenue) to maintain uptime.
- Renewal rate: ~90%
- Market growth: ~2% (2024)
- Tooling/training CAPEX: 2–4% rev
- Dispatch accuracy reduces AOG ≈10%
Kitting and provisioning services
Kitting and provisioning services at AAR act as a cash cow: standardized kits for checks and mods sustain dependable gross margins near 30% while growth remains constrained by replacement-cycle demand. Operational excellence and tight supplier ties in 2024 cut inventory waste and improve forecast accuracy, compounding free cash flow. Keep cycle times tight to sustain quick cash conversion.
- Margin: ~30%
- Low growth, high FCF
- Forecasting cuts waste
- Supplier ties reduce lead times
- Short cycle = fast cash conversion
High-utilization fuels steady cash — 75%+, $85-88B MRO
High-utilization shops (>75%) and long-term contracts produce steady cash; aftermarket margins mid-teens in 2024 and kitting margins ~30%. Global MRO ~85–88B in 2024 with ~2% growth; renewal ~90% and tooling/training CAPEX 2–4% rev sustain FCF.
| Metric | 2024 |
|---|---|
| Global MRO | $85–88B |
| Growth | ~2% |
| Aftermarket margin | Mid-teens |
| Kitting margin | ~30% |
| Renewal rate | ~90% |
What You’re Viewing Is Included
AAR BCG Matrix
The file you're previewing here is the exact AAR BCG Matrix report you'll receive after purchase—no watermarks, no placeholders, just the finished deliverable. It's fully formatted and editable, so you can plug it straight into presentations or strategy sessions. Crafted for clarity by strategic analysts, the document arrives ready to use. Buy once, download instantly, and start presenting with confidence.
Description
Unlock Strategic Clarity
The AAR BCG Matrix snapshot shows where each business line sits—Stars driving growth, Cash Cows funding ops, Dogs dragging performance, and Question Marks begging a decision. Want the full picture with quadrant-level data, clear strategic moves, and ROI-minded recommendations? Purchase the complete BCG Matrix to get a Word report plus an Excel summary you can use straight away. Stop guessing—get the roadmap and act with confidence.
Stars
Integrated MRO programs
Integrated MRO programs at AAR leverage end-to-end aircraft and component services to capture fleet growth and higher utilization, serving more than 1,200 commercial and defense customers; FY2024 revenue roughly $1.7B underscores scale. Demand remained robust through 2024, so continued investment in capacity, faster turnarounds and certifications is warranted. Protecting this lead should push the segment toward Cash Cow as industry growth normalizes.
Power-by-the-hour style support
Usage-based support packages lock in customers and volumes, turning AAR into the default partner as the market scales—global air travel recovered to about 99% of 2019 levels in 2024 (IATA), supporting an estimated $86B commercial MRO market that year. These long contracts require upfront cash to stand up but yield durable, repeatable returns through contracted volumes and renewals. Prioritize investment in reliability data, predictive analytics and strengthened SLAs to widen the competitive moat and increase lifetime value.
Global parts distribution
Airlines need parts now, not later — AOG events can cost carriers up to 150,000 per hour, and AAR’s global parts distribution network across 29 countries provides rapid AOG response and high share in key hubs. Share is strong and on-time performance is a clear differentiator. Working capital is inventory-heavy, but inventory velocity (industry aftermarket turns ~4–6x) offsets cash drag; scaling SKU breadth and smart demand planning keeps the flywheel spinning.
Government and defense sustainment
Defense fleets require dependable depot work and logistics, and AAR’s 70-year credentials and standing DoD contracts position it well. US defense discretionary funding was roughly $858 billion in FY2024, keeping task orders flowing while allied readiness spending grows. Reputation and flawless compliance determine first-call status.
- Depot reliability
- $858B FY2024 defense funding
- Task orders steady
- Allied fleet growth
- Strict compliance = priority supplier
AOG and critical logistics
AOG and critical logistics are Stars: minutes matter when an aircraft is on ground and AAR’s rapid logistics routinely convert downtime into mission wins. The global MRO market was about $82B in 2024 with ~4% CAGR, and AOG events can cost operators $10,000–$150,000 per hour, so high service levels and network readiness drive loyalty despite cash intensity. Continue expanding lanes, hubs, and 24/7 coverage to defend leadership.
- Market size: $82B (2024)
- AOG cost: $10k–$150k/hour
- High Opex on network readiness, high payback in repeat revenue
- Priority: expand lanes, hubs, 24/7 coverage
Integrated MRO and AOG: FY2024 revenue $1.7B, global MRO $82B
AAR Stars: integrated MRO and AOG deliver high growth and market leadership—FY2024 revenue ~$1.7B; global MRO ~$82B (2024) with ~4% CAGR. AOG urgency (cost $10k–$150k/hr) and 29-country parts network drive durable contracts and repeatable margins despite inventory intensity. Defense backlog benefits from ~$858B US FY2024 defense funding; invest in predictive analytics and hub expansion to secure Cash Cow transition.
| Metric | 2024 |
|---|---|
| FY revenue | $1.7B |
| Global MRO | $82B |
| AOG cost/hr | $10k–$150k |
| US defense spend | $858B |
What is included in the product
Detailed Word Document
Comprehensive BCG Matrix review pinpointing Stars, Cash Cows, Question Marks, Dogs with investment guidance and competitive context.
Customizable Excel Spreadsheet
One-page AAR BCG Matrix that pinpoints underperformers and winners—clear actions, ready to export for fast C-level decisions.
Cash Cows
Component repair shops
High-utilization, repeatable worksops and certifications make steady cash; component shops typically run >75% utilization and underpin AAR’s aftermarket cash flow. Margins benefit from process discipline and throughput; AAR’s aftermarket margins were in the mid-teens in 2024. Growth is modest but share entrenched in a global MRO market ~80B in 2024; lean and automation projects can squeeze more yield with limited spend.
Long-term distribution agreements
Long-term distribution agreements deliver contracted volume and predictable turns, creating baked-in relationships that throw off reliable cash rather than flashy growth.
Working capital becomes known and controllable under these contracts, allowing tighter inventory turns and lower day sales outstanding.
Maintain service levels, renegotiate pricing and lead times smartly, and continuously milk process and procurement efficiencies to sustain cash generation.
Legacy platform sustainment
Legacy platform sustainment supports mature fleets that still fly and need predictable support; global commercial MRO demand was about 85 billion USD in 2024 while fleet age averaged roughly 12 years, so parts and repairs remain steady even with flat flight-hour growth. Pricing power stays stable where AAR holds approvals; optimizing inventory turnover and consolidating sites preserves gross margins.
Line maintenance partnerships
Line maintenance partnerships deliver repeat airport-line checks using standard playbooks; the global MRO market was about $88B in 2024 with low growth (~2%), while renewal rates near 90% keep cash flow steady.
Profit relies on tight labor planning and dispatch accuracy—better dispatch can cut AOG-related costs by ~10%; invest minimally in tooling and training (~2–4% of service revenue) to maintain uptime.
- Renewal rate: ~90%
- Market growth: ~2% (2024)
- Tooling/training CAPEX: 2–4% rev
- Dispatch accuracy reduces AOG ≈10%
Kitting and provisioning services
Kitting and provisioning services at AAR act as a cash cow: standardized kits for checks and mods sustain dependable gross margins near 30% while growth remains constrained by replacement-cycle demand. Operational excellence and tight supplier ties in 2024 cut inventory waste and improve forecast accuracy, compounding free cash flow. Keep cycle times tight to sustain quick cash conversion.
- Margin: ~30%
- Low growth, high FCF
- Forecasting cuts waste
- Supplier ties reduce lead times
- Short cycle = fast cash conversion
High-utilization fuels steady cash — 75%+, $85-88B MRO
High-utilization shops (>75%) and long-term contracts produce steady cash; aftermarket margins mid-teens in 2024 and kitting margins ~30%. Global MRO ~85–88B in 2024 with ~2% growth; renewal ~90% and tooling/training CAPEX 2–4% rev sustain FCF.
| Metric | 2024 |
|---|---|
| Global MRO | $85–88B |
| Growth | ~2% |
| Aftermarket margin | Mid-teens |
| Kitting margin | ~30% |
| Renewal rate | ~90% |
What You’re Viewing Is Included
AAR BCG Matrix
The file you're previewing here is the exact AAR BCG Matrix report you'll receive after purchase—no watermarks, no placeholders, just the finished deliverable. It's fully formatted and editable, so you can plug it straight into presentations or strategy sessions. Crafted for clarity by strategic analysts, the document arrives ready to use. Buy once, download instantly, and start presenting with confidence.











