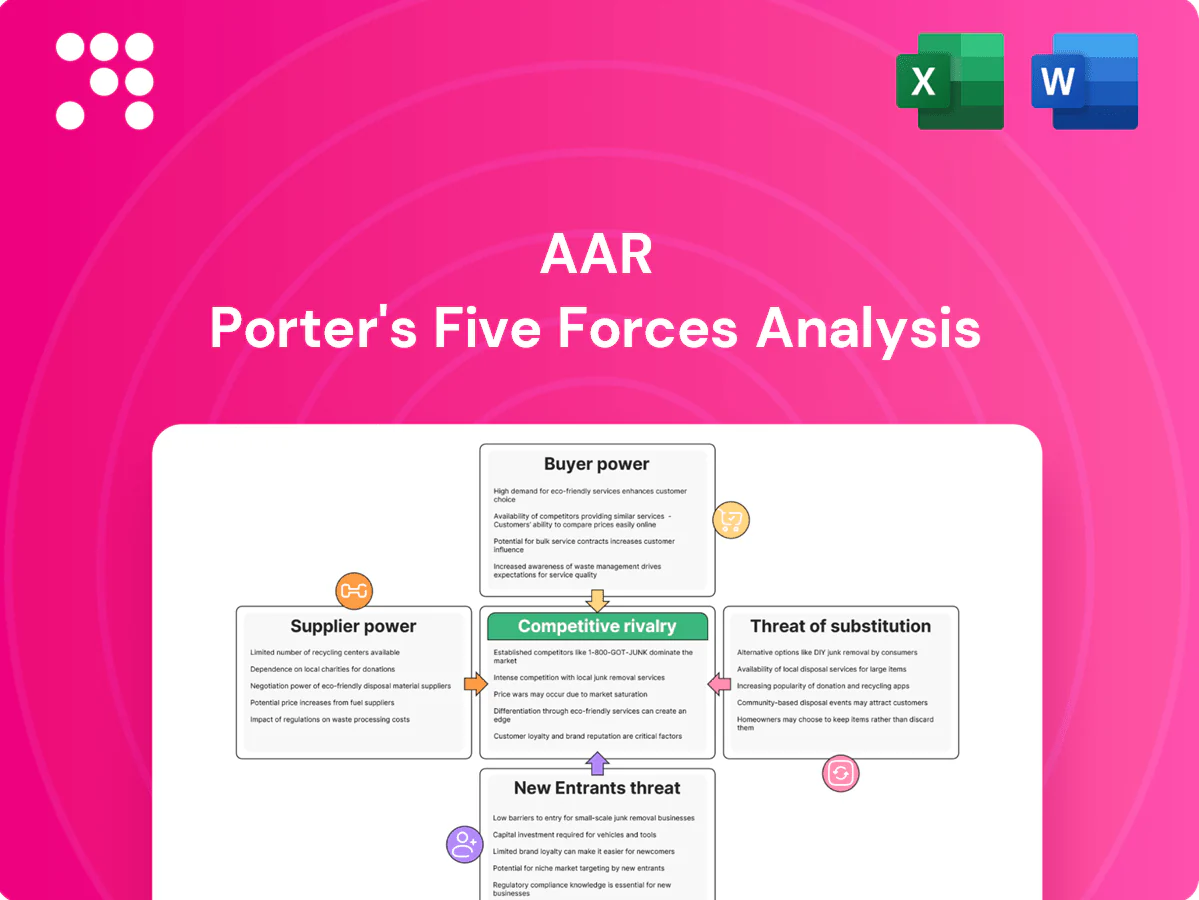
AAR Porter's Five Forces Analysis

A Must-Have Tool for Decision-Makers
AAR's Porter's Five Forces snapshot highlights supplier concentration, buyer leverage, competitive rivalry, threat of new entrants, and substitutes, revealing key strategic pressures. This overview shows where AAR holds advantages and where risks persist. For force-by-force ratings, visuals and tailored implications, unlock the full Porter's Five Forces Analysis. Purchase the complete report to inform investment and strategy decisions.
Suppliers Bargaining Power

Concentrated OEM and Engine Maker Influence
OEMs and engine makers control manuals, IP and approved repair schemes, giving them leverage on pricing and access and keeping supplier-driven price spreads high; lifecycle and sole-source engine parts sustain elevated supplier power. AAR offsets this with PMA/DER alternatives and multi-OEM sourcing—PMA and third-party parts efforts grew in 2024 to strengthen margins. Nevertheless, proprietary licensing and OEM repair approvals continue to constrain independent MRO margin.
Skilled Labor and Certifications as Supply Constraints
Experienced A&P technicians, engineers, and inspectors are scarce, especially in peak cycles, and rising wage inflation plus higher training and retention costs boost supplier power of labor. FAA/EASA certification rules require 18–30 months of documented experience for A&P credentials, limiting rapid substitution of staff. AAR’s training pipelines and multi-site footprint mitigate risk, but certified labor shortages continue to constrain capacity and drive costs.

Parts and Used Serviceable Material Availability
Supply of new OEM parts often carries lead times exceeding 12 months, while USM availability hinges on teardown cycles and fleet retirements; tight supply lets parts suppliers charge premiums and priority fees. AAR’s inventory investment and global distribution network reduce stock-out risk and shorten delivery windows. However, carrying costs and obsolescence exposure shift bargaining leverage back to suppliers in constrained 2024 markets.

Digital Tools, Data, and Test Equipment Vendors
- Proprietary software drives lock-in
- Test cells/tooling increase switching costs
- Long-term deals mitigate supplier power
Logistics and Freight Capacity
Time-sensitive AOG shipments rely on reliable air and ground logistics capacity; fuel surcharges commonly add 10–30% to freight costs and lane concentration can spike spot rates during disruptions. AAR’s in-house logistics and multi-carrier networks reduce exposure and routing risk, improving resiliency. Systemic events, however, can reprice freight across the board within hours, pressuring margins and supplier leverage.
- Dependence: AOGs require hours-level reliability
- Cost drivers: fuel surcharges typically +10–30%
- Mitigation: in-house logistics + multi-carrier network
Supplier leverage, long OEM lead times and scarce A&P labor squeeze margins
OEMs' proprietary IP and approved-repair schemes keep supplier pricing power high; AAR reported fiscal 2024 revenue of about 1.6 billion USD and uses PMA/DER sourcing to blunt margins pressure. Certified A&P labor remains scarce (FAA/EASA documented experience 18–30 months), pushing wages and training costs up. OEM part lead times often exceed 12 months and fuel surcharges commonly add 10–30% to freight, sustaining supplier leverage.
| Factor | 2024 metric | Impact |
|---|---|---|
| Revenue | ~1.6B USD | Supplier costs materially affect margins |
| OEM lead time | >12 months | Price premiums, priority fees |
| A&P cert | 18–30 months | Labor scarcity, higher wages |
| Fuel surcharge | +10–30% | Freight cost volatility |
What is included in the product
 Detailed Word Document
Tailored Porter’s Five Forces analysis for AAR that uncovers key drivers of competition, customer influence, entry barriers, and substitute threats shaping its market position. Evaluates supplier and buyer power, identifies disruptive risks and protective dynamics, and is fully editable for inclusion in investor decks or strategy reports.

 Customizable Excel Spreadsheet
AAR Porter's Five Forces delivers a clean one-sheet summary with customizable pressure levels and instant spider charts—ready to drop into pitch decks or dashboards to simplify competitive risk assessment without macros or complex setup.
Customers Bargaining Power

Large Airlines and Defense Agencies as Price Setters
Major carriers and defense agencies negotiate multi-year, high-volume contracts with AAR, leveraging scale—top four U.S. carriers accounted for about 78% of 2024 domestic seat capacity—enabling competitive bidding, standardized rate cards and penalty-heavy SLAs. These terms compress margins and shift operational and inventory risk to providers. AAR gains revenue visibility from large orders but faces pronounced buyer bargaining power that limits pricing flexibility.
Switching Costs vs Multi-Sourcing
Technical data transfer, tooling alignment, and transition learning curves create measurable switching costs for MRO customers, yet many airlines deliberately dual-source to preserve competition—AAR reported roughly $1.6B revenue in FY2024, underscoring scale but not absolute lock-in. Dual-sourcing moderates supplier lock-in and sustains buyer power, with procurement teams often maintaining 2+ suppliers per SKU. AAR must differentiate on TAT, reliability, and breadth to defend share.

Outcome-Based and PBH Contracting
Power-by-the-hour and performance-based logistics tie pay to availability and reliability, shifting downtime and inventory risk to MRO partners; the global commercial MRO market was estimated at about 115 billion in 2024, raising stakes for KPI enforcement. These sticky contracts intensify price scrutiny—AAR’s integrated supply-chain services can price for risk, but buyers press for lower rates and tougher SLAs.

Transparency and Benchmarking
Standardized workscopes and expanded industry datasets enable rigorous price benchmarking, constraining AARs pricing discretion as buyers routinely compare TAT, scrap rates, and repair-development metrics; Oliver Wyman estimates the global commercial MRO market at roughly $80B in 2024, intensifying vendor comparisons. Value-add analytics and bespoke engineering services can partially offset commoditization by delivering measurable TAT and reliability improvements.
- Benchmarks: TAT, scrap rate, R&D lead-time
- Buyer leverage: cross-vendor comparability
- Offset: analytics, bespoke engineering
Cyclicality and Emergency Spend
Cyclicality compresses customer power in downturns as buyers defer maintenance and pressure rates, while upcycles and capacity tightness in 2023–24 restored pricing leverage for suppliers.
AOG events command premiums but overall airline and defense maintenance budgets remain tightly managed; US defense spending in 2024 (~858 billion) sustains periodic negotiated uplifts.
- Buyers defer MRO in downturns
- Capacity tightness tempers buyer power
- AOG = short-term premium pricing
- Defense cycles (US budget ~858B in 2024) shape leverage
- AAR mitigates via flexible capacity and inventory
Top carriers, defense hold MRO pricing power despite ≈78% US seat share
Major carriers (top4 ≈78% of US seat capacity) and defense agencies exert strong bargaining power, compressing margins despite AAR’s $1.6B FY2024 scale. Dual-sourcing (procurement often keeps 2+ suppliers/SKU) and standardized benchmarks (TAT, scrap) constrain price flexibility. Cycle swings and AOG spikes create short-term seller leverage but buyers retain structural control.
| Metric | 2024 |
|---|---|
| AAR revenue | $1.6B |
| Top4 US seat share | ≈78% |
| Global commercial MRO | $115B |
| US defense budget | $858B |
Full Version Awaits
AAR Porter's Five Forces Analysis
This preview shows the exact AAR Porter’s Five Forces Analysis you’ll receive immediately after purchase—no mockups or placeholders. The document displayed is fully formatted, professionally written, and ready for download the moment you buy. You’re viewing the final deliverable with complete analysis and sourcing.

A Must-Have Tool for Decision-Makers
AAR's Porter's Five Forces snapshot highlights supplier concentration, buyer leverage, competitive rivalry, threat of new entrants, and substitutes, revealing key strategic pressures. This overview shows where AAR holds advantages and where risks persist. For force-by-force ratings, visuals and tailored implications, unlock the full Porter's Five Forces Analysis. Purchase the complete report to inform investment and strategy decisions.
Suppliers Bargaining Power
Concentrated OEM and Engine Maker Influence
OEMs and engine makers control manuals, IP and approved repair schemes, giving them leverage on pricing and access and keeping supplier-driven price spreads high; lifecycle and sole-source engine parts sustain elevated supplier power. AAR offsets this with PMA/DER alternatives and multi-OEM sourcing—PMA and third-party parts efforts grew in 2024 to strengthen margins. Nevertheless, proprietary licensing and OEM repair approvals continue to constrain independent MRO margin.
Skilled Labor and Certifications as Supply Constraints
Experienced A&P technicians, engineers, and inspectors are scarce, especially in peak cycles, and rising wage inflation plus higher training and retention costs boost supplier power of labor. FAA/EASA certification rules require 18–30 months of documented experience for A&P credentials, limiting rapid substitution of staff. AAR’s training pipelines and multi-site footprint mitigate risk, but certified labor shortages continue to constrain capacity and drive costs.
Parts and Used Serviceable Material Availability
Supply of new OEM parts often carries lead times exceeding 12 months, while USM availability hinges on teardown cycles and fleet retirements; tight supply lets parts suppliers charge premiums and priority fees. AAR’s inventory investment and global distribution network reduce stock-out risk and shorten delivery windows. However, carrying costs and obsolescence exposure shift bargaining leverage back to suppliers in constrained 2024 markets.
Digital Tools, Data, and Test Equipment Vendors
- Proprietary software drives lock-in
- Test cells/tooling increase switching costs
- Long-term deals mitigate supplier power
Logistics and Freight Capacity
Time-sensitive AOG shipments rely on reliable air and ground logistics capacity; fuel surcharges commonly add 10–30% to freight costs and lane concentration can spike spot rates during disruptions. AAR’s in-house logistics and multi-carrier networks reduce exposure and routing risk, improving resiliency. Systemic events, however, can reprice freight across the board within hours, pressuring margins and supplier leverage.
- Dependence: AOGs require hours-level reliability
- Cost drivers: fuel surcharges typically +10–30%
- Mitigation: in-house logistics + multi-carrier network
Supplier leverage, long OEM lead times and scarce A&P labor squeeze margins
OEMs' proprietary IP and approved-repair schemes keep supplier pricing power high; AAR reported fiscal 2024 revenue of about 1.6 billion USD and uses PMA/DER sourcing to blunt margins pressure. Certified A&P labor remains scarce (FAA/EASA documented experience 18–30 months), pushing wages and training costs up. OEM part lead times often exceed 12 months and fuel surcharges commonly add 10–30% to freight, sustaining supplier leverage.
| Factor | 2024 metric | Impact |
|---|---|---|
| Revenue | ~1.6B USD | Supplier costs materially affect margins |
| OEM lead time | >12 months | Price premiums, priority fees |
| A&P cert | 18–30 months | Labor scarcity, higher wages |
| Fuel surcharge | +10–30% | Freight cost volatility |
What is included in the product
Detailed Word Document
Tailored Porter’s Five Forces analysis for AAR that uncovers key drivers of competition, customer influence, entry barriers, and substitute threats shaping its market position. Evaluates supplier and buyer power, identifies disruptive risks and protective dynamics, and is fully editable for inclusion in investor decks or strategy reports.
Customizable Excel Spreadsheet
AAR Porter's Five Forces delivers a clean one-sheet summary with customizable pressure levels and instant spider charts—ready to drop into pitch decks or dashboards to simplify competitive risk assessment without macros or complex setup.
Customers Bargaining Power
Large Airlines and Defense Agencies as Price Setters
Major carriers and defense agencies negotiate multi-year, high-volume contracts with AAR, leveraging scale—top four U.S. carriers accounted for about 78% of 2024 domestic seat capacity—enabling competitive bidding, standardized rate cards and penalty-heavy SLAs. These terms compress margins and shift operational and inventory risk to providers. AAR gains revenue visibility from large orders but faces pronounced buyer bargaining power that limits pricing flexibility.
Switching Costs vs Multi-Sourcing
Technical data transfer, tooling alignment, and transition learning curves create measurable switching costs for MRO customers, yet many airlines deliberately dual-source to preserve competition—AAR reported roughly $1.6B revenue in FY2024, underscoring scale but not absolute lock-in. Dual-sourcing moderates supplier lock-in and sustains buyer power, with procurement teams often maintaining 2+ suppliers per SKU. AAR must differentiate on TAT, reliability, and breadth to defend share.
Outcome-Based and PBH Contracting
Power-by-the-hour and performance-based logistics tie pay to availability and reliability, shifting downtime and inventory risk to MRO partners; the global commercial MRO market was estimated at about 115 billion in 2024, raising stakes for KPI enforcement. These sticky contracts intensify price scrutiny—AAR’s integrated supply-chain services can price for risk, but buyers press for lower rates and tougher SLAs.
Transparency and Benchmarking
Standardized workscopes and expanded industry datasets enable rigorous price benchmarking, constraining AARs pricing discretion as buyers routinely compare TAT, scrap rates, and repair-development metrics; Oliver Wyman estimates the global commercial MRO market at roughly $80B in 2024, intensifying vendor comparisons. Value-add analytics and bespoke engineering services can partially offset commoditization by delivering measurable TAT and reliability improvements.
- Benchmarks: TAT, scrap rate, R&D lead-time
- Buyer leverage: cross-vendor comparability
- Offset: analytics, bespoke engineering
Cyclicality and Emergency Spend
Cyclicality compresses customer power in downturns as buyers defer maintenance and pressure rates, while upcycles and capacity tightness in 2023–24 restored pricing leverage for suppliers.
AOG events command premiums but overall airline and defense maintenance budgets remain tightly managed; US defense spending in 2024 (~858 billion) sustains periodic negotiated uplifts.
- Buyers defer MRO in downturns
- Capacity tightness tempers buyer power
- AOG = short-term premium pricing
- Defense cycles (US budget ~858B in 2024) shape leverage
- AAR mitigates via flexible capacity and inventory
Top carriers, defense hold MRO pricing power despite ≈78% US seat share
Major carriers (top4 ≈78% of US seat capacity) and defense agencies exert strong bargaining power, compressing margins despite AAR’s $1.6B FY2024 scale. Dual-sourcing (procurement often keeps 2+ suppliers/SKU) and standardized benchmarks (TAT, scrap) constrain price flexibility. Cycle swings and AOG spikes create short-term seller leverage but buyers retain structural control.
| Metric | 2024 |
|---|---|
| AAR revenue | $1.6B |
| Top4 US seat share | ≈78% |
| Global commercial MRO | $115B |
| US defense budget | $858B |
Full Version Awaits
AAR Porter's Five Forces Analysis
This preview shows the exact AAR Porter’s Five Forces Analysis you’ll receive immediately after purchase—no mockups or placeholders. The document displayed is fully formatted, professionally written, and ready for download the moment you buy. You’re viewing the final deliverable with complete analysis and sourcing.
Original: $10.00
-65%$10.00
$3.50Description
A Must-Have Tool for Decision-Makers
AAR's Porter's Five Forces snapshot highlights supplier concentration, buyer leverage, competitive rivalry, threat of new entrants, and substitutes, revealing key strategic pressures. This overview shows where AAR holds advantages and where risks persist. For force-by-force ratings, visuals and tailored implications, unlock the full Porter's Five Forces Analysis. Purchase the complete report to inform investment and strategy decisions.
Suppliers Bargaining Power
Concentrated OEM and Engine Maker Influence
OEMs and engine makers control manuals, IP and approved repair schemes, giving them leverage on pricing and access and keeping supplier-driven price spreads high; lifecycle and sole-source engine parts sustain elevated supplier power. AAR offsets this with PMA/DER alternatives and multi-OEM sourcing—PMA and third-party parts efforts grew in 2024 to strengthen margins. Nevertheless, proprietary licensing and OEM repair approvals continue to constrain independent MRO margin.
Skilled Labor and Certifications as Supply Constraints
Experienced A&P technicians, engineers, and inspectors are scarce, especially in peak cycles, and rising wage inflation plus higher training and retention costs boost supplier power of labor. FAA/EASA certification rules require 18–30 months of documented experience for A&P credentials, limiting rapid substitution of staff. AAR’s training pipelines and multi-site footprint mitigate risk, but certified labor shortages continue to constrain capacity and drive costs.
Parts and Used Serviceable Material Availability
Supply of new OEM parts often carries lead times exceeding 12 months, while USM availability hinges on teardown cycles and fleet retirements; tight supply lets parts suppliers charge premiums and priority fees. AAR’s inventory investment and global distribution network reduce stock-out risk and shorten delivery windows. However, carrying costs and obsolescence exposure shift bargaining leverage back to suppliers in constrained 2024 markets.
Digital Tools, Data, and Test Equipment Vendors
- Proprietary software drives lock-in
- Test cells/tooling increase switching costs
- Long-term deals mitigate supplier power
Logistics and Freight Capacity
Time-sensitive AOG shipments rely on reliable air and ground logistics capacity; fuel surcharges commonly add 10–30% to freight costs and lane concentration can spike spot rates during disruptions. AAR’s in-house logistics and multi-carrier networks reduce exposure and routing risk, improving resiliency. Systemic events, however, can reprice freight across the board within hours, pressuring margins and supplier leverage.
- Dependence: AOGs require hours-level reliability
- Cost drivers: fuel surcharges typically +10–30%
- Mitigation: in-house logistics + multi-carrier network
Supplier leverage, long OEM lead times and scarce A&P labor squeeze margins
OEMs' proprietary IP and approved-repair schemes keep supplier pricing power high; AAR reported fiscal 2024 revenue of about 1.6 billion USD and uses PMA/DER sourcing to blunt margins pressure. Certified A&P labor remains scarce (FAA/EASA documented experience 18–30 months), pushing wages and training costs up. OEM part lead times often exceed 12 months and fuel surcharges commonly add 10–30% to freight, sustaining supplier leverage.
| Factor | 2024 metric | Impact |
|---|---|---|
| Revenue | ~1.6B USD | Supplier costs materially affect margins |
| OEM lead time | >12 months | Price premiums, priority fees |
| A&P cert | 18–30 months | Labor scarcity, higher wages |
| Fuel surcharge | +10–30% | Freight cost volatility |
What is included in the product
Detailed Word Document
Tailored Porter’s Five Forces analysis for AAR that uncovers key drivers of competition, customer influence, entry barriers, and substitute threats shaping its market position. Evaluates supplier and buyer power, identifies disruptive risks and protective dynamics, and is fully editable for inclusion in investor decks or strategy reports.
Customizable Excel Spreadsheet
AAR Porter's Five Forces delivers a clean one-sheet summary with customizable pressure levels and instant spider charts—ready to drop into pitch decks or dashboards to simplify competitive risk assessment without macros or complex setup.
Customers Bargaining Power
Large Airlines and Defense Agencies as Price Setters
Major carriers and defense agencies negotiate multi-year, high-volume contracts with AAR, leveraging scale—top four U.S. carriers accounted for about 78% of 2024 domestic seat capacity—enabling competitive bidding, standardized rate cards and penalty-heavy SLAs. These terms compress margins and shift operational and inventory risk to providers. AAR gains revenue visibility from large orders but faces pronounced buyer bargaining power that limits pricing flexibility.
Switching Costs vs Multi-Sourcing
Technical data transfer, tooling alignment, and transition learning curves create measurable switching costs for MRO customers, yet many airlines deliberately dual-source to preserve competition—AAR reported roughly $1.6B revenue in FY2024, underscoring scale but not absolute lock-in. Dual-sourcing moderates supplier lock-in and sustains buyer power, with procurement teams often maintaining 2+ suppliers per SKU. AAR must differentiate on TAT, reliability, and breadth to defend share.
Outcome-Based and PBH Contracting
Power-by-the-hour and performance-based logistics tie pay to availability and reliability, shifting downtime and inventory risk to MRO partners; the global commercial MRO market was estimated at about 115 billion in 2024, raising stakes for KPI enforcement. These sticky contracts intensify price scrutiny—AAR’s integrated supply-chain services can price for risk, but buyers press for lower rates and tougher SLAs.
Transparency and Benchmarking
Standardized workscopes and expanded industry datasets enable rigorous price benchmarking, constraining AARs pricing discretion as buyers routinely compare TAT, scrap rates, and repair-development metrics; Oliver Wyman estimates the global commercial MRO market at roughly $80B in 2024, intensifying vendor comparisons. Value-add analytics and bespoke engineering services can partially offset commoditization by delivering measurable TAT and reliability improvements.
- Benchmarks: TAT, scrap rate, R&D lead-time
- Buyer leverage: cross-vendor comparability
- Offset: analytics, bespoke engineering
Cyclicality and Emergency Spend
Cyclicality compresses customer power in downturns as buyers defer maintenance and pressure rates, while upcycles and capacity tightness in 2023–24 restored pricing leverage for suppliers.
AOG events command premiums but overall airline and defense maintenance budgets remain tightly managed; US defense spending in 2024 (~858 billion) sustains periodic negotiated uplifts.
- Buyers defer MRO in downturns
- Capacity tightness tempers buyer power
- AOG = short-term premium pricing
- Defense cycles (US budget ~858B in 2024) shape leverage
- AAR mitigates via flexible capacity and inventory
Top carriers, defense hold MRO pricing power despite ≈78% US seat share
Major carriers (top4 ≈78% of US seat capacity) and defense agencies exert strong bargaining power, compressing margins despite AAR’s $1.6B FY2024 scale. Dual-sourcing (procurement often keeps 2+ suppliers/SKU) and standardized benchmarks (TAT, scrap) constrain price flexibility. Cycle swings and AOG spikes create short-term seller leverage but buyers retain structural control.
| Metric | 2024 |
|---|---|
| AAR revenue | $1.6B |
| Top4 US seat share | ≈78% |
| Global commercial MRO | $115B |
| US defense budget | $858B |
Full Version Awaits
AAR Porter's Five Forces Analysis
This preview shows the exact AAR Porter’s Five Forces Analysis you’ll receive immediately after purchase—no mockups or placeholders. The document displayed is fully formatted, professionally written, and ready for download the moment you buy. You’re viewing the final deliverable with complete analysis and sourcing.











