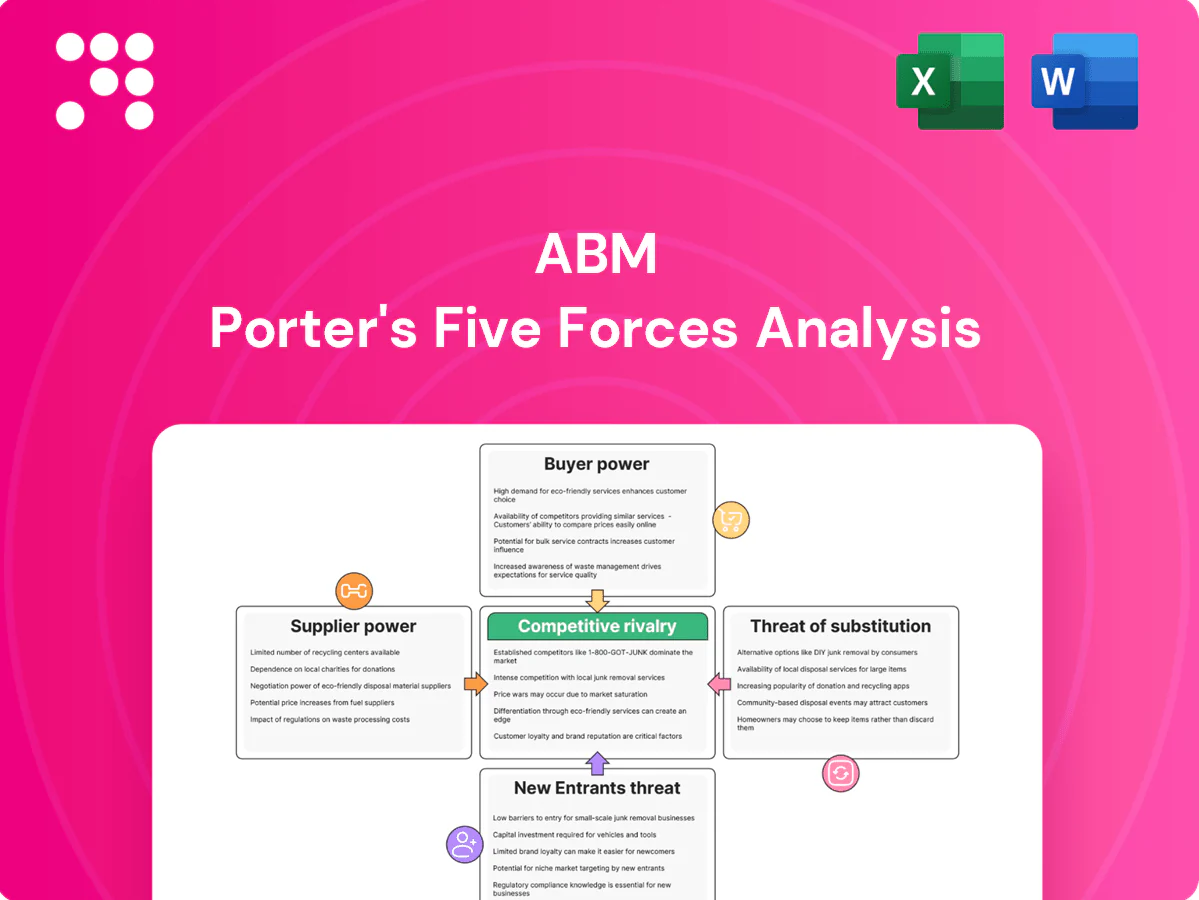
ABM Porter's Five Forces Analysis

From Overview to Strategy Blueprint
ABM's Porter's Five Forces snapshot highlights buyer leverage, supplier dynamics, rivalry intensity, and threats from entrants and substitutes—revealing where margins and risks concentrate. This brief overview surfaces key pressures but omits detailed ratings, visuals, and quantified impacts. Unlock the full Porter's Five Forces Analysis for force-by-force scores, charts, and tailored strategic recommendations.
Suppliers Bargaining Power

Fragmented inputs keep leverage low
ABM sources chemicals, consumables, PPE and basic tools from many interchangeable vendors, keeping supplier pricing power low. The commodity nature of janitorial supplies and typical 1–3 year rebid cycles enable frequent rebids and switching. National distributors compete with regional wholesalers, and ABM’s scale—over 100,000 employees and multibillion-dollar services revenue in 2024—lets it secure volume rebates and favorable terms.
Specialized parts raise dependence
Engineering services rely on brand-specific OEM parts—HVAC components, elevators and BMS spares—often available from limited authorized dealers, with 2024 lead times commonly 8–14 weeks, increasing supplier leverage. Mission-critical equipment outages can drive emergency costs and premium sourcing, frequently exceeding $10,000 per hour in high-value facilities. ABM offsets risk through multi-vendor frameworks and preventative maintenance to reduce urgent replacement spend.

Labor agencies and unions matter
ABM relies on staffing agencies and unionized labor, with collective bargaining in key markets raising wage and work-rule rigidity; ABM reported roughly $7.0 billion revenue in 2024, making labor cost swings material to margins. Tight U.S. labor markets in 2024 pushed staffing agency markups and overtime exposure higher (industry temp payroll growth ~8% yr/yr), while unionization (~10% national rate) constrains flexibility. Workforce development and retention programs reduce reliance on agencies and lower overtime spend.

Tech platforms create switching frictions
Tech platforms embed stickiness via work-order systems, IoT sensors, robotics and access-control vendors; integration and data-migration costs can raise supplier power and, in 2024, switching projects for mid-size plants often exceed $1M and take 6–12 months. Proprietary APIs and certification requirements further lock customers in, while ABM mitigates risk with platform-agnostic architectures and selective in-house integrations.
- Integration costs: >$1M for mid-size sites (2024)
- Switch time: 6–12 months
- Defense: platform-agnostic + in-house integrations
Parking and security equipment niches
Gate systems, LPR cameras and security hardware have a concentrated supplier base, limiting buyer leverage and enabling suppliers to command higher margins for specialized components. Maintenance and SLA packages commonly bundle parts and service at premium rates, while long asset lifespans slow rebidding and extend supplier relationships. ABM offsets supplier power by negotiating lifecycle contracts that cap costs and guarantee uptime through defined KPIs and replacement schedules.
- Few qualified suppliers — increased supplier leverage
- Bundled SLAs — higher recurring margins
- Long asset lives — slower rebids
- ABM lifecycle contracts — cost caps and uptime guarantees
Mixed supplier power: low for janitorial scale; high for OEM spares, long leads, >$1M lock
Supplier power is mixed: low for commoditized janitorial inputs due to many vendors and ABM’s scale (≈$7.0B revenue, 100k employees in 2024), but high for OEM spares, security hardware and tech platforms with 8–14 week lead times and >$1M switch costs. Labor suppliers (agencies, unions ~10% rate) and emergency parts (> $10k/hr) amplify cost exposure; lifecycle contracts and multi-vendor sourcing mitigate risk.
| Category | 2024 Metric | Impact |
|---|---|---|
| Scale | $7.0B;100k emp | Lower price power |
| OEM parts | 8–14 wk lead | Higher supplier leverage |
| Switch costs | >$1M | High lock-in |
What is included in the product
 Detailed Word Document
Tailored Porter's Five Forces analysis for ABM that uncovers competitive rivalry, buyer and supplier power, threat of new entrants and substitutes, and identifies disruptive trends and entry barriers to inform pricing, strategic positioning, and risk mitigation.

 Customizable Excel Spreadsheet
ABM Porter's Five Forces delivers a single-sheet, customizable pressure map with spider charts and clean layout—no macros—so teams can instantly assess competitive threats, tweak inputs for new scenarios, and drop-ready visuals into decks or reports to resolve strategic uncertainty fast.
Customers Bargaining Power

Large enterprise RFPs drive price
Corporate, institutional and government buyers run competitive tenders with detailed SLAs and high spend concentration—top RFPs often exceed $10 million and buyers hold leverage as ABM reported $6.6 billion revenue in 2024, highlighting customer concentration risk. Buyers demand multi-site coverage and integrated services at scale, forcing ABM to differentiate beyond price via technology, bundled SLAs and measurable KPIs to win.
Switching costs are material but manageable
Transitions require workforce transfers, retraining, and data/process handoffs, creating measurable operational risk but no insurmountable barrier; typical FM contracts run 3–5 year cycles so incumbents can be displaced at each rebid. Detailed SOPs and documented handover playbooks materially reduce buyer risk and increase rebid participation. ABM increases stickiness using KPIs, real-time dashboards, and continuous improvement programs to tie performance to renewal decision-making.

Performance and compliance scrutiny
Buyers enforce KPIs on cleanliness, uptime, safety and ESG reporting, with missed metrics in 2024 increasingly triggering penalties or contract renegotiations; transparent reporting platforms have boosted buyer leverage. ABM, which reported about $6.1 billion in 2024 revenue, deploys analytics and QA audits to defend margins and support contract renewals.

Bundling can both dilute and amplify power
Integrated facility management contracts shift scope into one master vendor, cutting multi-vendor coordination and buyer time costs while concentrating pricing negotiations and increasing pressure on blended rates; cross-selling of services can soften price focus when clear value and measurable ROI are demonstrated, and ABM markets itself as a single throat to choke with service-level metrics.
- Consolidation reduces coordination overhead
- Pricing pressure on blended rates
- Cross-selling shifts conversation to value
- ABM emphasizes measurable ROI and single-vendor accountability
Price elasticity in low-differentiation tasks
Basic janitorial and day porter services function as commodities, so buyers readily benchmark rates to market and exert strong price pressure; wage inflation is typically rejected unless paired with measurable outcomes. ABM defends rates through outcome-based pricing and deployment of productivity technology to demonstrate efficiency gains and tie pay increases to performance.
- Commodity pricing pressure
- Buyer benchmarking common
- Wage inflation resisted
- ABM uses outcome pricing + productivity tech
Buyers wield leverage on mega FM contracts—differentiate with tech, outcome pricing and KPIs
Buyers hold strong leverage—ABM reported $6.6 billion revenue in 2024 and top RFPs often exceed $10 million—forcing differentiation via tech, bundled SLAs and KPIs. FM contracts run 3–5 years so incumbents face rebid risk; transitions create operational risk mitigated by handover playbooks. Commodity janitorial services face intense price benchmarking, so ABM uses outcome pricing, dashboards and analytics to protect margins.
| Metric | 2024 | Buyer Impact |
|---|---|---|
| ABM revenue | $6.6B | Customer concentration risk |
| Top RFP size | >$10M | High buyer leverage |
| Contract length | 3–5 yrs | Periodic rebid risk |
What You See Is What You Get
ABM Porter's Five Forces Analysis
This preview shows the exact ABM Porter's Five Forces Analysis you'll receive after purchase—fully formatted and ready for immediate use. No mockups or placeholders: the document displayed is the final deliverable. Once you buy, you get instant access to this same file.

From Overview to Strategy Blueprint
ABM's Porter's Five Forces snapshot highlights buyer leverage, supplier dynamics, rivalry intensity, and threats from entrants and substitutes—revealing where margins and risks concentrate. This brief overview surfaces key pressures but omits detailed ratings, visuals, and quantified impacts. Unlock the full Porter's Five Forces Analysis for force-by-force scores, charts, and tailored strategic recommendations.
Suppliers Bargaining Power
Fragmented inputs keep leverage low
ABM sources chemicals, consumables, PPE and basic tools from many interchangeable vendors, keeping supplier pricing power low. The commodity nature of janitorial supplies and typical 1–3 year rebid cycles enable frequent rebids and switching. National distributors compete with regional wholesalers, and ABM’s scale—over 100,000 employees and multibillion-dollar services revenue in 2024—lets it secure volume rebates and favorable terms.
Specialized parts raise dependence
Engineering services rely on brand-specific OEM parts—HVAC components, elevators and BMS spares—often available from limited authorized dealers, with 2024 lead times commonly 8–14 weeks, increasing supplier leverage. Mission-critical equipment outages can drive emergency costs and premium sourcing, frequently exceeding $10,000 per hour in high-value facilities. ABM offsets risk through multi-vendor frameworks and preventative maintenance to reduce urgent replacement spend.
Labor agencies and unions matter
ABM relies on staffing agencies and unionized labor, with collective bargaining in key markets raising wage and work-rule rigidity; ABM reported roughly $7.0 billion revenue in 2024, making labor cost swings material to margins. Tight U.S. labor markets in 2024 pushed staffing agency markups and overtime exposure higher (industry temp payroll growth ~8% yr/yr), while unionization (~10% national rate) constrains flexibility. Workforce development and retention programs reduce reliance on agencies and lower overtime spend.
Tech platforms create switching frictions
Tech platforms embed stickiness via work-order systems, IoT sensors, robotics and access-control vendors; integration and data-migration costs can raise supplier power and, in 2024, switching projects for mid-size plants often exceed $1M and take 6–12 months. Proprietary APIs and certification requirements further lock customers in, while ABM mitigates risk with platform-agnostic architectures and selective in-house integrations.
- Integration costs: >$1M for mid-size sites (2024)
- Switch time: 6–12 months
- Defense: platform-agnostic + in-house integrations
Parking and security equipment niches
Gate systems, LPR cameras and security hardware have a concentrated supplier base, limiting buyer leverage and enabling suppliers to command higher margins for specialized components. Maintenance and SLA packages commonly bundle parts and service at premium rates, while long asset lifespans slow rebidding and extend supplier relationships. ABM offsets supplier power by negotiating lifecycle contracts that cap costs and guarantee uptime through defined KPIs and replacement schedules.
- Few qualified suppliers — increased supplier leverage
- Bundled SLAs — higher recurring margins
- Long asset lives — slower rebids
- ABM lifecycle contracts — cost caps and uptime guarantees
Mixed supplier power: low for janitorial scale; high for OEM spares, long leads, >$1M lock
Supplier power is mixed: low for commoditized janitorial inputs due to many vendors and ABM’s scale (≈$7.0B revenue, 100k employees in 2024), but high for OEM spares, security hardware and tech platforms with 8–14 week lead times and >$1M switch costs. Labor suppliers (agencies, unions ~10% rate) and emergency parts (> $10k/hr) amplify cost exposure; lifecycle contracts and multi-vendor sourcing mitigate risk.
| Category | 2024 Metric | Impact |
|---|---|---|
| Scale | $7.0B;100k emp | Lower price power |
| OEM parts | 8–14 wk lead | Higher supplier leverage |
| Switch costs | >$1M | High lock-in |
What is included in the product
Detailed Word Document
Tailored Porter's Five Forces analysis for ABM that uncovers competitive rivalry, buyer and supplier power, threat of new entrants and substitutes, and identifies disruptive trends and entry barriers to inform pricing, strategic positioning, and risk mitigation.
Customizable Excel Spreadsheet
ABM Porter's Five Forces delivers a single-sheet, customizable pressure map with spider charts and clean layout—no macros—so teams can instantly assess competitive threats, tweak inputs for new scenarios, and drop-ready visuals into decks or reports to resolve strategic uncertainty fast.
Customers Bargaining Power
Large enterprise RFPs drive price
Corporate, institutional and government buyers run competitive tenders with detailed SLAs and high spend concentration—top RFPs often exceed $10 million and buyers hold leverage as ABM reported $6.6 billion revenue in 2024, highlighting customer concentration risk. Buyers demand multi-site coverage and integrated services at scale, forcing ABM to differentiate beyond price via technology, bundled SLAs and measurable KPIs to win.
Switching costs are material but manageable
Transitions require workforce transfers, retraining, and data/process handoffs, creating measurable operational risk but no insurmountable barrier; typical FM contracts run 3–5 year cycles so incumbents can be displaced at each rebid. Detailed SOPs and documented handover playbooks materially reduce buyer risk and increase rebid participation. ABM increases stickiness using KPIs, real-time dashboards, and continuous improvement programs to tie performance to renewal decision-making.
Performance and compliance scrutiny
Buyers enforce KPIs on cleanliness, uptime, safety and ESG reporting, with missed metrics in 2024 increasingly triggering penalties or contract renegotiations; transparent reporting platforms have boosted buyer leverage. ABM, which reported about $6.1 billion in 2024 revenue, deploys analytics and QA audits to defend margins and support contract renewals.
Bundling can both dilute and amplify power
Integrated facility management contracts shift scope into one master vendor, cutting multi-vendor coordination and buyer time costs while concentrating pricing negotiations and increasing pressure on blended rates; cross-selling of services can soften price focus when clear value and measurable ROI are demonstrated, and ABM markets itself as a single throat to choke with service-level metrics.
- Consolidation reduces coordination overhead
- Pricing pressure on blended rates
- Cross-selling shifts conversation to value
- ABM emphasizes measurable ROI and single-vendor accountability
Price elasticity in low-differentiation tasks
Basic janitorial and day porter services function as commodities, so buyers readily benchmark rates to market and exert strong price pressure; wage inflation is typically rejected unless paired with measurable outcomes. ABM defends rates through outcome-based pricing and deployment of productivity technology to demonstrate efficiency gains and tie pay increases to performance.
- Commodity pricing pressure
- Buyer benchmarking common
- Wage inflation resisted
- ABM uses outcome pricing + productivity tech
Buyers wield leverage on mega FM contracts—differentiate with tech, outcome pricing and KPIs
Buyers hold strong leverage—ABM reported $6.6 billion revenue in 2024 and top RFPs often exceed $10 million—forcing differentiation via tech, bundled SLAs and KPIs. FM contracts run 3–5 years so incumbents face rebid risk; transitions create operational risk mitigated by handover playbooks. Commodity janitorial services face intense price benchmarking, so ABM uses outcome pricing, dashboards and analytics to protect margins.
| Metric | 2024 | Buyer Impact |
|---|---|---|
| ABM revenue | $6.6B | Customer concentration risk |
| Top RFP size | >$10M | High buyer leverage |
| Contract length | 3–5 yrs | Periodic rebid risk |
What You See Is What You Get
ABM Porter's Five Forces Analysis
This preview shows the exact ABM Porter's Five Forces Analysis you'll receive after purchase—fully formatted and ready for immediate use. No mockups or placeholders: the document displayed is the final deliverable. Once you buy, you get instant access to this same file.
Original: $10.00
-65%$10.00
$3.50Description
From Overview to Strategy Blueprint
ABM's Porter's Five Forces snapshot highlights buyer leverage, supplier dynamics, rivalry intensity, and threats from entrants and substitutes—revealing where margins and risks concentrate. This brief overview surfaces key pressures but omits detailed ratings, visuals, and quantified impacts. Unlock the full Porter's Five Forces Analysis for force-by-force scores, charts, and tailored strategic recommendations.
Suppliers Bargaining Power
Fragmented inputs keep leverage low
ABM sources chemicals, consumables, PPE and basic tools from many interchangeable vendors, keeping supplier pricing power low. The commodity nature of janitorial supplies and typical 1–3 year rebid cycles enable frequent rebids and switching. National distributors compete with regional wholesalers, and ABM’s scale—over 100,000 employees and multibillion-dollar services revenue in 2024—lets it secure volume rebates and favorable terms.
Specialized parts raise dependence
Engineering services rely on brand-specific OEM parts—HVAC components, elevators and BMS spares—often available from limited authorized dealers, with 2024 lead times commonly 8–14 weeks, increasing supplier leverage. Mission-critical equipment outages can drive emergency costs and premium sourcing, frequently exceeding $10,000 per hour in high-value facilities. ABM offsets risk through multi-vendor frameworks and preventative maintenance to reduce urgent replacement spend.
Labor agencies and unions matter
ABM relies on staffing agencies and unionized labor, with collective bargaining in key markets raising wage and work-rule rigidity; ABM reported roughly $7.0 billion revenue in 2024, making labor cost swings material to margins. Tight U.S. labor markets in 2024 pushed staffing agency markups and overtime exposure higher (industry temp payroll growth ~8% yr/yr), while unionization (~10% national rate) constrains flexibility. Workforce development and retention programs reduce reliance on agencies and lower overtime spend.
Tech platforms create switching frictions
Tech platforms embed stickiness via work-order systems, IoT sensors, robotics and access-control vendors; integration and data-migration costs can raise supplier power and, in 2024, switching projects for mid-size plants often exceed $1M and take 6–12 months. Proprietary APIs and certification requirements further lock customers in, while ABM mitigates risk with platform-agnostic architectures and selective in-house integrations.
- Integration costs: >$1M for mid-size sites (2024)
- Switch time: 6–12 months
- Defense: platform-agnostic + in-house integrations
Parking and security equipment niches
Gate systems, LPR cameras and security hardware have a concentrated supplier base, limiting buyer leverage and enabling suppliers to command higher margins for specialized components. Maintenance and SLA packages commonly bundle parts and service at premium rates, while long asset lifespans slow rebidding and extend supplier relationships. ABM offsets supplier power by negotiating lifecycle contracts that cap costs and guarantee uptime through defined KPIs and replacement schedules.
- Few qualified suppliers — increased supplier leverage
- Bundled SLAs — higher recurring margins
- Long asset lives — slower rebids
- ABM lifecycle contracts — cost caps and uptime guarantees
Mixed supplier power: low for janitorial scale; high for OEM spares, long leads, >$1M lock
Supplier power is mixed: low for commoditized janitorial inputs due to many vendors and ABM’s scale (≈$7.0B revenue, 100k employees in 2024), but high for OEM spares, security hardware and tech platforms with 8–14 week lead times and >$1M switch costs. Labor suppliers (agencies, unions ~10% rate) and emergency parts (> $10k/hr) amplify cost exposure; lifecycle contracts and multi-vendor sourcing mitigate risk.
| Category | 2024 Metric | Impact |
|---|---|---|
| Scale | $7.0B;100k emp | Lower price power |
| OEM parts | 8–14 wk lead | Higher supplier leverage |
| Switch costs | >$1M | High lock-in |
What is included in the product
Detailed Word Document
Tailored Porter's Five Forces analysis for ABM that uncovers competitive rivalry, buyer and supplier power, threat of new entrants and substitutes, and identifies disruptive trends and entry barriers to inform pricing, strategic positioning, and risk mitigation.
Customizable Excel Spreadsheet
ABM Porter's Five Forces delivers a single-sheet, customizable pressure map with spider charts and clean layout—no macros—so teams can instantly assess competitive threats, tweak inputs for new scenarios, and drop-ready visuals into decks or reports to resolve strategic uncertainty fast.
Customers Bargaining Power
Large enterprise RFPs drive price
Corporate, institutional and government buyers run competitive tenders with detailed SLAs and high spend concentration—top RFPs often exceed $10 million and buyers hold leverage as ABM reported $6.6 billion revenue in 2024, highlighting customer concentration risk. Buyers demand multi-site coverage and integrated services at scale, forcing ABM to differentiate beyond price via technology, bundled SLAs and measurable KPIs to win.
Switching costs are material but manageable
Transitions require workforce transfers, retraining, and data/process handoffs, creating measurable operational risk but no insurmountable barrier; typical FM contracts run 3–5 year cycles so incumbents can be displaced at each rebid. Detailed SOPs and documented handover playbooks materially reduce buyer risk and increase rebid participation. ABM increases stickiness using KPIs, real-time dashboards, and continuous improvement programs to tie performance to renewal decision-making.
Performance and compliance scrutiny
Buyers enforce KPIs on cleanliness, uptime, safety and ESG reporting, with missed metrics in 2024 increasingly triggering penalties or contract renegotiations; transparent reporting platforms have boosted buyer leverage. ABM, which reported about $6.1 billion in 2024 revenue, deploys analytics and QA audits to defend margins and support contract renewals.
Bundling can both dilute and amplify power
Integrated facility management contracts shift scope into one master vendor, cutting multi-vendor coordination and buyer time costs while concentrating pricing negotiations and increasing pressure on blended rates; cross-selling of services can soften price focus when clear value and measurable ROI are demonstrated, and ABM markets itself as a single throat to choke with service-level metrics.
- Consolidation reduces coordination overhead
- Pricing pressure on blended rates
- Cross-selling shifts conversation to value
- ABM emphasizes measurable ROI and single-vendor accountability
Price elasticity in low-differentiation tasks
Basic janitorial and day porter services function as commodities, so buyers readily benchmark rates to market and exert strong price pressure; wage inflation is typically rejected unless paired with measurable outcomes. ABM defends rates through outcome-based pricing and deployment of productivity technology to demonstrate efficiency gains and tie pay increases to performance.
- Commodity pricing pressure
- Buyer benchmarking common
- Wage inflation resisted
- ABM uses outcome pricing + productivity tech
Buyers wield leverage on mega FM contracts—differentiate with tech, outcome pricing and KPIs
Buyers hold strong leverage—ABM reported $6.6 billion revenue in 2024 and top RFPs often exceed $10 million—forcing differentiation via tech, bundled SLAs and KPIs. FM contracts run 3–5 years so incumbents face rebid risk; transitions create operational risk mitigated by handover playbooks. Commodity janitorial services face intense price benchmarking, so ABM uses outcome pricing, dashboards and analytics to protect margins.
| Metric | 2024 | Buyer Impact |
|---|---|---|
| ABM revenue | $6.6B | Customer concentration risk |
| Top RFP size | >$10M | High buyer leverage |
| Contract length | 3–5 yrs | Periodic rebid risk |
What You See Is What You Get
ABM Porter's Five Forces Analysis
This preview shows the exact ABM Porter's Five Forces Analysis you'll receive after purchase—fully formatted and ready for immediate use. No mockups or placeholders: the document displayed is the final deliverable. Once you buy, you get instant access to this same file.











