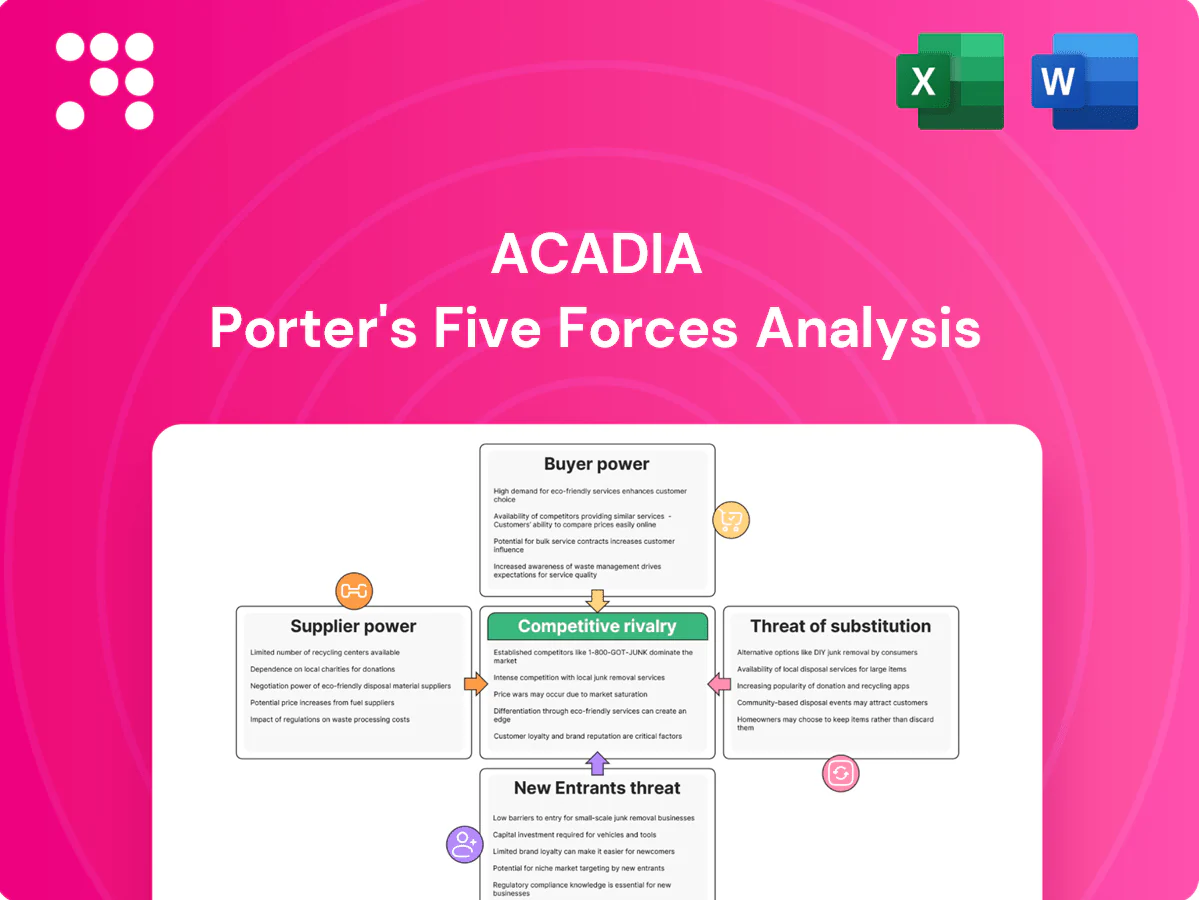
ACADIA Porter's Five Forces Analysis

Don't Miss the Bigger Picture
ACADIA faces moderate supplier power, intense competitive rivalry, and evolving buyer expectations that shape its pricing and innovation strategies. New entrants and substitutes pose selective threats depending on niche therapeutics and regulatory barriers. This snapshot highlights key pressures but omits force-by-force ratings and visuals. Unlock the full Porter's Five Forces Analysis to get the complete, consultant-grade breakdown for strategic action.
Suppliers Bargaining Power

Specialized API and excipient sources
ACADIA depends on high-purity, CNS-grade APIs and excipients often sourced from limited or single vendors, creating concentrated supplier power. Qualification and tech-transfer costs are high, and in 2024 regulatory filings continued to bind ACADIA to approved suppliers, raising switching barriers. Suppliers can demand premium terms given this lock-in. Any supplier disruption can delay manufacturing and commercialization timelines.
Contract manufacturing and CRO reliance
ACADIA outsources most manufacturing and clinical work to CMOs/CROs, tapping a CNS-specialist base that remains narrow as the global CRO market surged to about $75 billion in 2024, amplifying supplier leverage; capacity bottlenecks and stringent CNS quality standards further strengthen vendor bargaining power. Multi-vendor strategies lower single-source risk but increase coordination costs, while long-term contracts stabilize pricing yet create switching frictions and sunk costs.

Biologic and complex process know-how
Where processes are complex or proprietary, suppliers with unique biologic know-how gain negotiating strength, especially as the global biologics CDMO market reached about USD 18 billion in 2024 with an ~8% CAGR; process changes demand comparability and validation, slowing supplier transitions. Suppliers can leverage timelines tied to clinical or launch milestones, concentrating operational risk and raising costs for sponsors.

Clinical site and investigator access
High-quality neurology and psychiatry trial sites and KOL investigators are scarce, giving sites leverage as competition for patients intensifies; industry data show roughly 80% of trials miss enrollment timelines. Site-driven delays elevate direct trial costs and opportunity costs from postponed launches and lost peak sales. Preferred-site relationships lower risk but cannot eliminate site bargaining power or recruitment bottlenecks.
- Limited experienced CNS sites
- ~80% trials miss enrollment timelines
- Delays increase trial and opportunity costs
- Preferred-site ties mitigate but don’t remove leverage
Regulatory-compliance constraints
Regulatory-compliance constraints—cGMP, GCP and data-integrity requirements—shrink the pool of qualified vendors for ACADIA, increasing reliance on proven suppliers. FDA Form 483s or warning letters often trigger remediations that can cost up to millions and commonly take 6–18 months, tightening supply continuity. Approved vendor lists further narrow options during scale-up, giving compliant suppliers greater leverage over pricing and lead times.
Single-source CNS suppliers and scarce sites raise vendor power; 80% fail
ACADIA faces high supplier power due to single-source CNS-grade APIs/excipients, costly qualification and 2024 regulatory constraints that raise switching barriers. Outsourced CMOs/CROs (global CRO market ~USD 75B in 2024; biologics CDMO ~USD 18B) and scarce CNS trial sites (~80% trials miss enrollment) amplify leverage, while remediation costs (up to millions; 6–18 months) reinforce vendor influence.
| Metric | 2024 Figure |
|---|---|
| Global CRO market | ~USD 75B |
| Biologics CDMO | ~USD 18B |
| Trials missing enrollment | ~80% |
| Remediation cost/time | Up to millions; 6–18 months |
What is included in the product
 Detailed Word Document
Comprehensive Porter's Five Forces analysis for ACADIA that uncovers competitive drivers, supplier and buyer power, threat of substitutes, and entry barriers, identifying disruptive threats and strategic levers to protect market share. Fully editable for reports, investor materials, or strategy decks.

 Customizable Excel Spreadsheet
A clear, one-sheet summary of ACADIA's Porter's Five Forces that instantly visualizes competitive pressure with a spider chart, easily customizable for new data or scenarios and copy-ready for pitch decks—no macros required and integrates seamlessly into Excel dashboards.
Customers Bargaining Power

Payers and PBMs as price gatekeepers
In the U.S. payers and PBMs act as de facto price gatekeepers, with the top three PBMs (CVS Caremark, Cigna/Express Scripts, OptumRx) managing roughly 80% of prescription claims in 2024 and driving formulary access, step edits, and rebate terms for CNS drugs. Concentration among large payers and PBMs amplifies buyer power, with specialty drug rebates averaging near 30% in 2023–24. Payers increasingly demand outcomes and real‑world evidence to unlock favorable economics. Access decisions directly dictate volume and net pricing, often cutting realized revenue by tens of percent.
Specialists and treatment centers
Neurologists and psychiatrists are the primary prescribers for ACADIA therapies, exercising high clinical discretion by prioritizing efficacy, safety, monitoring burden and alignment with practice guidelines. Key opinion leader advocacy can materially speed uptake, while persistent clinician skepticism and safety concerns slow adoption. Robust education and patient support programs are critical to reduce buyer power and influence prescribing decisions.

Medicare and governmental programs
Significant exposure to Medicare in neurodegenerative conditions elevates public payer influence, with Medicare representing roughly 20% of US health spending. Policy shifts and aggressive price negotiations — impacting Medicare Part D (about 50 million enrollees in 2024) — can compress margins. Coverage determinations, prior authorizations and international reference pricing further constrain demand elasticity and list pricing abroad.

Patient affordability and assistance
High out-of-pocket costs drive initiation and adherence problems in chronic CNS therapy, with ~29% of patients reporting cost-related nonadherence in 2024 (KFF), while manufacturer patient-assistance programs reduced immediate OOP burdens but contributed to net price erosion—programs covered an estimated $15 billion in 2023 (IQVIA 2024). Advocacy groups increased payer and policy pressure, amplifying buyer leverage over realized net price.
Limited alternatives but high scrutiny
Buyers face limited therapeutic alternatives but apply high scrutiny to CNS safety and long-term outcomes, with health technology assessments (HTAs) in markets like the UK, Canada and Germany raising evidence thresholds in 2024 and tempering post-launch pricing power; off-label antipsychotics remain lower-cost substitutes that strengthen payer negotiating stances.
- HTA pressure: higher evidence bar in UK/CA/DE (2024)
- Off-label antipsychotics: lower-cost alternative
- Pricing leverage: constrained post-launch
PBMs ~80%, ~30% rebates squeeze specialty drugs
US payers/PBMs (top three ~80% 2024) set formulary and rebate terms (~30% specialty rebate), cutting realized revenue; Medicare Part D (~50M enrollees) and HTAs (UK/CA/DE 2024) tighten access. Neurologists/psychiatrists drive uptake; patient OOP sensitivity (~29% nonadherence) and $15B manufacturer assistance (2023) amplify buyer leverage on net price.
| Metric | Value (2023–24) |
|---|---|
| PBM share | ~80% |
| Specialty rebates | ~30% |
| Medicare Part D | ~50M enrollees |
| Cost-related nonadherence | ~29% |
| Patient assistance | $15B |
Preview Before You Purchase
ACADIA Porter's Five Forces Analysis
This preview shows the exact ACADIA Porter's Five Forces Analysis you'll receive immediately after purchase—fully formatted, professionally written, and ready for download. No placeholders or mockups: the file you see is the complete deliverable. Instant access, actionable insights, and ready-to-use content upon payment.

Don't Miss the Bigger Picture
ACADIA faces moderate supplier power, intense competitive rivalry, and evolving buyer expectations that shape its pricing and innovation strategies. New entrants and substitutes pose selective threats depending on niche therapeutics and regulatory barriers. This snapshot highlights key pressures but omits force-by-force ratings and visuals. Unlock the full Porter's Five Forces Analysis to get the complete, consultant-grade breakdown for strategic action.
Suppliers Bargaining Power
Specialized API and excipient sources
ACADIA depends on high-purity, CNS-grade APIs and excipients often sourced from limited or single vendors, creating concentrated supplier power. Qualification and tech-transfer costs are high, and in 2024 regulatory filings continued to bind ACADIA to approved suppliers, raising switching barriers. Suppliers can demand premium terms given this lock-in. Any supplier disruption can delay manufacturing and commercialization timelines.
Contract manufacturing and CRO reliance
ACADIA outsources most manufacturing and clinical work to CMOs/CROs, tapping a CNS-specialist base that remains narrow as the global CRO market surged to about $75 billion in 2024, amplifying supplier leverage; capacity bottlenecks and stringent CNS quality standards further strengthen vendor bargaining power. Multi-vendor strategies lower single-source risk but increase coordination costs, while long-term contracts stabilize pricing yet create switching frictions and sunk costs.
Biologic and complex process know-how
Where processes are complex or proprietary, suppliers with unique biologic know-how gain negotiating strength, especially as the global biologics CDMO market reached about USD 18 billion in 2024 with an ~8% CAGR; process changes demand comparability and validation, slowing supplier transitions. Suppliers can leverage timelines tied to clinical or launch milestones, concentrating operational risk and raising costs for sponsors.
Clinical site and investigator access
High-quality neurology and psychiatry trial sites and KOL investigators are scarce, giving sites leverage as competition for patients intensifies; industry data show roughly 80% of trials miss enrollment timelines. Site-driven delays elevate direct trial costs and opportunity costs from postponed launches and lost peak sales. Preferred-site relationships lower risk but cannot eliminate site bargaining power or recruitment bottlenecks.
- Limited experienced CNS sites
- ~80% trials miss enrollment timelines
- Delays increase trial and opportunity costs
- Preferred-site ties mitigate but don’t remove leverage
Regulatory-compliance constraints
Regulatory-compliance constraints—cGMP, GCP and data-integrity requirements—shrink the pool of qualified vendors for ACADIA, increasing reliance on proven suppliers. FDA Form 483s or warning letters often trigger remediations that can cost up to millions and commonly take 6–18 months, tightening supply continuity. Approved vendor lists further narrow options during scale-up, giving compliant suppliers greater leverage over pricing and lead times.
Single-source CNS suppliers and scarce sites raise vendor power; 80% fail
ACADIA faces high supplier power due to single-source CNS-grade APIs/excipients, costly qualification and 2024 regulatory constraints that raise switching barriers. Outsourced CMOs/CROs (global CRO market ~USD 75B in 2024; biologics CDMO ~USD 18B) and scarce CNS trial sites (~80% trials miss enrollment) amplify leverage, while remediation costs (up to millions; 6–18 months) reinforce vendor influence.
| Metric | 2024 Figure |
|---|---|
| Global CRO market | ~USD 75B |
| Biologics CDMO | ~USD 18B |
| Trials missing enrollment | ~80% |
| Remediation cost/time | Up to millions; 6–18 months |
What is included in the product
Detailed Word Document
Comprehensive Porter's Five Forces analysis for ACADIA that uncovers competitive drivers, supplier and buyer power, threat of substitutes, and entry barriers, identifying disruptive threats and strategic levers to protect market share. Fully editable for reports, investor materials, or strategy decks.
Customizable Excel Spreadsheet
A clear, one-sheet summary of ACADIA's Porter's Five Forces that instantly visualizes competitive pressure with a spider chart, easily customizable for new data or scenarios and copy-ready for pitch decks—no macros required and integrates seamlessly into Excel dashboards.
Customers Bargaining Power
Payers and PBMs as price gatekeepers
In the U.S. payers and PBMs act as de facto price gatekeepers, with the top three PBMs (CVS Caremark, Cigna/Express Scripts, OptumRx) managing roughly 80% of prescription claims in 2024 and driving formulary access, step edits, and rebate terms for CNS drugs. Concentration among large payers and PBMs amplifies buyer power, with specialty drug rebates averaging near 30% in 2023–24. Payers increasingly demand outcomes and real‑world evidence to unlock favorable economics. Access decisions directly dictate volume and net pricing, often cutting realized revenue by tens of percent.
Specialists and treatment centers
Neurologists and psychiatrists are the primary prescribers for ACADIA therapies, exercising high clinical discretion by prioritizing efficacy, safety, monitoring burden and alignment with practice guidelines. Key opinion leader advocacy can materially speed uptake, while persistent clinician skepticism and safety concerns slow adoption. Robust education and patient support programs are critical to reduce buyer power and influence prescribing decisions.
Medicare and governmental programs
Significant exposure to Medicare in neurodegenerative conditions elevates public payer influence, with Medicare representing roughly 20% of US health spending. Policy shifts and aggressive price negotiations — impacting Medicare Part D (about 50 million enrollees in 2024) — can compress margins. Coverage determinations, prior authorizations and international reference pricing further constrain demand elasticity and list pricing abroad.
Patient affordability and assistance
High out-of-pocket costs drive initiation and adherence problems in chronic CNS therapy, with ~29% of patients reporting cost-related nonadherence in 2024 (KFF), while manufacturer patient-assistance programs reduced immediate OOP burdens but contributed to net price erosion—programs covered an estimated $15 billion in 2023 (IQVIA 2024). Advocacy groups increased payer and policy pressure, amplifying buyer leverage over realized net price.
Limited alternatives but high scrutiny
Buyers face limited therapeutic alternatives but apply high scrutiny to CNS safety and long-term outcomes, with health technology assessments (HTAs) in markets like the UK, Canada and Germany raising evidence thresholds in 2024 and tempering post-launch pricing power; off-label antipsychotics remain lower-cost substitutes that strengthen payer negotiating stances.
- HTA pressure: higher evidence bar in UK/CA/DE (2024)
- Off-label antipsychotics: lower-cost alternative
- Pricing leverage: constrained post-launch
PBMs ~80%, ~30% rebates squeeze specialty drugs
US payers/PBMs (top three ~80% 2024) set formulary and rebate terms (~30% specialty rebate), cutting realized revenue; Medicare Part D (~50M enrollees) and HTAs (UK/CA/DE 2024) tighten access. Neurologists/psychiatrists drive uptake; patient OOP sensitivity (~29% nonadherence) and $15B manufacturer assistance (2023) amplify buyer leverage on net price.
| Metric | Value (2023–24) |
|---|---|
| PBM share | ~80% |
| Specialty rebates | ~30% |
| Medicare Part D | ~50M enrollees |
| Cost-related nonadherence | ~29% |
| Patient assistance | $15B |
Preview Before You Purchase
ACADIA Porter's Five Forces Analysis
This preview shows the exact ACADIA Porter's Five Forces Analysis you'll receive immediately after purchase—fully formatted, professionally written, and ready for download. No placeholders or mockups: the file you see is the complete deliverable. Instant access, actionable insights, and ready-to-use content upon payment.
Original: $10.00
-65%$10.00
$3.50Description
Don't Miss the Bigger Picture
ACADIA faces moderate supplier power, intense competitive rivalry, and evolving buyer expectations that shape its pricing and innovation strategies. New entrants and substitutes pose selective threats depending on niche therapeutics and regulatory barriers. This snapshot highlights key pressures but omits force-by-force ratings and visuals. Unlock the full Porter's Five Forces Analysis to get the complete, consultant-grade breakdown for strategic action.
Suppliers Bargaining Power
Specialized API and excipient sources
ACADIA depends on high-purity, CNS-grade APIs and excipients often sourced from limited or single vendors, creating concentrated supplier power. Qualification and tech-transfer costs are high, and in 2024 regulatory filings continued to bind ACADIA to approved suppliers, raising switching barriers. Suppliers can demand premium terms given this lock-in. Any supplier disruption can delay manufacturing and commercialization timelines.
Contract manufacturing and CRO reliance
ACADIA outsources most manufacturing and clinical work to CMOs/CROs, tapping a CNS-specialist base that remains narrow as the global CRO market surged to about $75 billion in 2024, amplifying supplier leverage; capacity bottlenecks and stringent CNS quality standards further strengthen vendor bargaining power. Multi-vendor strategies lower single-source risk but increase coordination costs, while long-term contracts stabilize pricing yet create switching frictions and sunk costs.
Biologic and complex process know-how
Where processes are complex or proprietary, suppliers with unique biologic know-how gain negotiating strength, especially as the global biologics CDMO market reached about USD 18 billion in 2024 with an ~8% CAGR; process changes demand comparability and validation, slowing supplier transitions. Suppliers can leverage timelines tied to clinical or launch milestones, concentrating operational risk and raising costs for sponsors.
Clinical site and investigator access
High-quality neurology and psychiatry trial sites and KOL investigators are scarce, giving sites leverage as competition for patients intensifies; industry data show roughly 80% of trials miss enrollment timelines. Site-driven delays elevate direct trial costs and opportunity costs from postponed launches and lost peak sales. Preferred-site relationships lower risk but cannot eliminate site bargaining power or recruitment bottlenecks.
- Limited experienced CNS sites
- ~80% trials miss enrollment timelines
- Delays increase trial and opportunity costs
- Preferred-site ties mitigate but don’t remove leverage
Regulatory-compliance constraints
Regulatory-compliance constraints—cGMP, GCP and data-integrity requirements—shrink the pool of qualified vendors for ACADIA, increasing reliance on proven suppliers. FDA Form 483s or warning letters often trigger remediations that can cost up to millions and commonly take 6–18 months, tightening supply continuity. Approved vendor lists further narrow options during scale-up, giving compliant suppliers greater leverage over pricing and lead times.
Single-source CNS suppliers and scarce sites raise vendor power; 80% fail
ACADIA faces high supplier power due to single-source CNS-grade APIs/excipients, costly qualification and 2024 regulatory constraints that raise switching barriers. Outsourced CMOs/CROs (global CRO market ~USD 75B in 2024; biologics CDMO ~USD 18B) and scarce CNS trial sites (~80% trials miss enrollment) amplify leverage, while remediation costs (up to millions; 6–18 months) reinforce vendor influence.
| Metric | 2024 Figure |
|---|---|
| Global CRO market | ~USD 75B |
| Biologics CDMO | ~USD 18B |
| Trials missing enrollment | ~80% |
| Remediation cost/time | Up to millions; 6–18 months |
What is included in the product
Detailed Word Document
Comprehensive Porter's Five Forces analysis for ACADIA that uncovers competitive drivers, supplier and buyer power, threat of substitutes, and entry barriers, identifying disruptive threats and strategic levers to protect market share. Fully editable for reports, investor materials, or strategy decks.
Customizable Excel Spreadsheet
A clear, one-sheet summary of ACADIA's Porter's Five Forces that instantly visualizes competitive pressure with a spider chart, easily customizable for new data or scenarios and copy-ready for pitch decks—no macros required and integrates seamlessly into Excel dashboards.
Customers Bargaining Power
Payers and PBMs as price gatekeepers
In the U.S. payers and PBMs act as de facto price gatekeepers, with the top three PBMs (CVS Caremark, Cigna/Express Scripts, OptumRx) managing roughly 80% of prescription claims in 2024 and driving formulary access, step edits, and rebate terms for CNS drugs. Concentration among large payers and PBMs amplifies buyer power, with specialty drug rebates averaging near 30% in 2023–24. Payers increasingly demand outcomes and real‑world evidence to unlock favorable economics. Access decisions directly dictate volume and net pricing, often cutting realized revenue by tens of percent.
Specialists and treatment centers
Neurologists and psychiatrists are the primary prescribers for ACADIA therapies, exercising high clinical discretion by prioritizing efficacy, safety, monitoring burden and alignment with practice guidelines. Key opinion leader advocacy can materially speed uptake, while persistent clinician skepticism and safety concerns slow adoption. Robust education and patient support programs are critical to reduce buyer power and influence prescribing decisions.
Medicare and governmental programs
Significant exposure to Medicare in neurodegenerative conditions elevates public payer influence, with Medicare representing roughly 20% of US health spending. Policy shifts and aggressive price negotiations — impacting Medicare Part D (about 50 million enrollees in 2024) — can compress margins. Coverage determinations, prior authorizations and international reference pricing further constrain demand elasticity and list pricing abroad.
Patient affordability and assistance
High out-of-pocket costs drive initiation and adherence problems in chronic CNS therapy, with ~29% of patients reporting cost-related nonadherence in 2024 (KFF), while manufacturer patient-assistance programs reduced immediate OOP burdens but contributed to net price erosion—programs covered an estimated $15 billion in 2023 (IQVIA 2024). Advocacy groups increased payer and policy pressure, amplifying buyer leverage over realized net price.
Limited alternatives but high scrutiny
Buyers face limited therapeutic alternatives but apply high scrutiny to CNS safety and long-term outcomes, with health technology assessments (HTAs) in markets like the UK, Canada and Germany raising evidence thresholds in 2024 and tempering post-launch pricing power; off-label antipsychotics remain lower-cost substitutes that strengthen payer negotiating stances.
- HTA pressure: higher evidence bar in UK/CA/DE (2024)
- Off-label antipsychotics: lower-cost alternative
- Pricing leverage: constrained post-launch
PBMs ~80%, ~30% rebates squeeze specialty drugs
US payers/PBMs (top three ~80% 2024) set formulary and rebate terms (~30% specialty rebate), cutting realized revenue; Medicare Part D (~50M enrollees) and HTAs (UK/CA/DE 2024) tighten access. Neurologists/psychiatrists drive uptake; patient OOP sensitivity (~29% nonadherence) and $15B manufacturer assistance (2023) amplify buyer leverage on net price.
| Metric | Value (2023–24) |
|---|---|
| PBM share | ~80% |
| Specialty rebates | ~30% |
| Medicare Part D | ~50M enrollees |
| Cost-related nonadherence | ~29% |
| Patient assistance | $15B |
Preview Before You Purchase
ACADIA Porter's Five Forces Analysis
This preview shows the exact ACADIA Porter's Five Forces Analysis you'll receive immediately after purchase—fully formatted, professionally written, and ready for download. No placeholders or mockups: the file you see is the complete deliverable. Instant access, actionable insights, and ready-to-use content upon payment.











