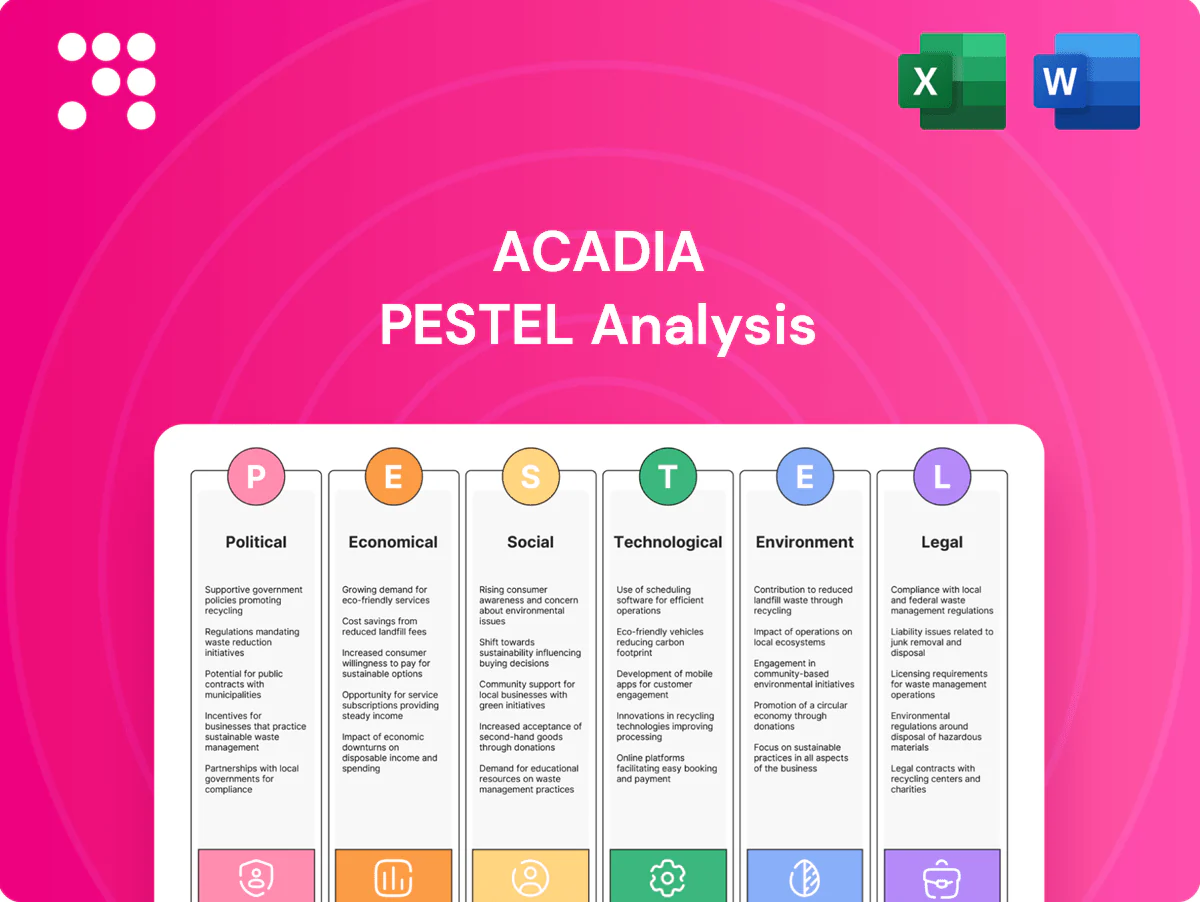
Acadia PESTLE Analysis

Your Shortcut to Market Insight Starts Here
Discover how political shifts, economic trends, and technological advances are shaping Acadia's strategic outlook in our concise PESTLE snapshot—perfect for investors and strategists. Buy the full analysis to unlock detailed risks, opportunities, and actionable recommendations for immediate use.
Political factors

Local zoning and land-use approvals
Street-retail and mixed-use projects depend on municipal zoning, variances and special permits, with typical US entitlement timelines ranging 12–24 months; pro-development councils can compress that to roughly 9–12 months. Restrictive boards commonly force downsizing or multi-quarter delays that increase carrying costs. Active stakeholder engagement, including early community outreach, materially improves approval odds and consistency across target cities reduces execution risk.
Tax policy and incentives
Property tax burdens vary widely—effective rates ranged from 0.28% in Hawaii to 2.44% in New Jersey in 2024—altering underwriting and cap-rate assumptions for Acadia assets. Abatements and TIF arrangements can materially boost redevelopment returns by lowering carrying costs and improving cash-on-cash in early years. Shifts in state and city tax regimes can compress NOI or enhance yields, so monitoring legislative cycles lets Acadia structure deals proactively. Negotiated incentives have improved IRRs on value-add funds by accelerating stabilization and reducing upfront tax expense.

Urban policy and public safety priorities
Cities’ allocations shape retail foot traffic: New York City’s 2024 budget earmarked roughly 11.5 billion for policing and 1.6 billion for sanitation, directly supporting public realm upkeep and perceived safety. Improved safety initiatives lift tenant demand and rents while deteriorating conditions depress occupancy; public-private partnerships such as BIDs are used to revitalize corridors. Location selection should weigh policy stability across metros.

Infrastructure and transit funding
Transit expansions and streetscape investments boost accessibility and retail vibrancy; the 2021 Infrastructure Investment and Jobs Act commits about 1.2 trillion USD in total federal infrastructure funding with roughly 89.9 billion USD for public transit over five years (2021–2026), so local projects tied to these streams can catalyze nearby densification. Delays or cuts in disbursements stall development pipelines; advocacy for complete-street projects supports street retail and higher pedestrian spend. Capital allocation should track planned infrastructure timelines and grant cycles through 2026 to avoid stranded investment.
- Track IIJA 2021 funding timing
- Prioritize complete-street advocacy
- Align capex with 2021–2026 grant cycles
Historic preservation and design review
Many urban assets face landmark controls and design committees that commonly add 5–15% in construction costs and 6–12 months to delivery, though they help preserve the neighborhood character that can drive 10–20% rent premiums for premium tenants. Early coordination with preservation authorities reduces rework, change orders and schedule risk. Budgets should explicitly include façade, material and approval contingency.
- cost-impact: 5–15%
- time-impact: 6–12 months
- rent-premium: 10–20%
- mitigation: early coordination, approval contingency
Entitlement delays, taxes and IIJA transit funding reshape development returns
Entitlement timelines typically 9–24 months (pro-development 9–12), with restrictive boards causing multi-quarter delays and higher carrying costs. Effective property tax rates ranged 0.28%–2.44% in 2024; abatements/TIFs improve early-year cashflow. IIJA allocates ~$89.9B for transit (2021–26) enabling densification; landmark controls add 5–15% cost and 6–12 months delay, mitigated by early engagement.
| Factor | Impact | Key Stat | Mitigation |
|---|---|---|---|
| Entitlements | Delay/carry | 9–24 months | Early outreach |
| Taxes | NOI/cap rates | 0.28%–2.44% (2024) | Abatements/TIF |
| Transit | Demand uplift | $89.9B transit (IIJA) | Align capex |
| Preservation | Cost/time | +5–15%, +6–12m | Coordination |
What is included in the product
 Detailed Word Document
Explores how external macro-environmental factors uniquely affect the Acadia across Political, Economic, Social, Technological, Environmental and Legal dimensions, with each section supported by current data and trends to identify specific risks and opportunities. Designed for executives, advisors and investors, it offers forward-looking insights, detailed sub-points and clean formatting ready for business plans or pitch decks.

 Customizable Excel Spreadsheet
A concise, visually segmented PESTLE summary of Acadia that’s easily dropped into presentations or shared across teams, enabling quick alignment on external risks and strategic positioning; editable notes let users tailor insights to region or business line.
Economic factors

Interest rates and cap rate spreads
REIT cost of capital and acquisition yields are highly rate sensitive: the 10-year Treasury was about 4.20% in July 2025, and typical US REIT cap-rate spreads around 300 basis points compress valuations and FFO when rates rise. Lower rates enable accretive growth by widening arbitrage between financing costs and property yields. Active hedging and prudent leverage preserve balance-sheet flexibility, while cap-rate spreads versus Treasuries guide buy-sell timing.
Consumer spending and retail sales cycles
Retail tenant health tracks employment, wage growth and consumer confidence; U.S. unemployment hovered near 3.7% mid-2025 and average hourly earnings rose roughly 4% YoY in 2024, supporting retail sales growth of about 4.5% YoY in 2024. Weak cycles drive tenant churn and rent concessions, while strong cycles lift Same-Property NOI. A shift toward necessity and experiential tenants stabilizes cash flow. Monitoring category-level sales cuts default risk.

Construction and redevelopment costs
Materials, labor, and contractor availability directly compress value-add returns as schedule slippage and premium labor raise costs; US CPI inflation averaged 3.4% in 2024, pressuring budgets. Inflation or supply bottlenecks can erode contingency buffers quickly. Phasing and GMP contracts help cap downside risk, while vendor diversification and early procurement improve deliverability and price predictability.

Credit markets and fund-raising conditions
Opportunistic funds hinge on LP appetite and lending liquidity; tight credit widens bid-ask spreads and creates distressed entry points while loose credit raises competition for assets. Maintaining dry powder—Preqin reports $1.56 trillion in global private equity dry powder as of Nov 2024—enables cycle-timed deployment. A strong track record lowers LP hurdle rates and speeds capital placement.
- LP appetite + lending liquidity determine deal flow
- Tight credit => wider spreads, distressed opportunities
- Loose credit => higher competition
- Dry powder $1.56T (Nov 2024) enables timing
- Track record reduces hurdle rates
E-commerce pressure and omnichannel adaptation
Shifts to online reduce tenant margins and force smaller store footprints as global e-commerce surpassed roughly $6 trillion in 2024, pressuring traditional retail rents and sales density.
Locations enabling BOPIS and last-mile delivery retain higher occupancy rates and command premium rents, while curating service, dining, and health uses mitigates displacement risk.
Data-driven tenanting—using POS and footfall analytics—aligns spaces with evolving spend patterns and boosts portfolio resilience.
- e-commerce ~$6T (2024)
- BOPIS/last-mile = higher occupancy
- Service/dining/health = lower vacancy
- Data-driven tenant mix = better yields
Entitlement delays, taxes and IIJA transit funding reshape development returns
10-yr Treasury ~4.20% (Jul 2025) raises REIT cap-rate pressure; typical cap-rate spreads ~300 bps affect valuations and FFO. US unemployment ~3.7% (mid-2025) and avg hourly earnings +4% YoY (2024) support retail demand. US CPI 3.4% (2024) and supply/labor shortages lift costs. Dry powder $1.56T (Nov 2024) shapes opportunistic deployment.
| Metric | Value |
|---|---|
| 10‑yr Treasury | 4.20% (Jul 2025) |
| Cap‑rate spread | ~300 bps |
| Unemployment | 3.7% (mid‑2025) |
| Avg hourly earnings | +4% YoY (2024) |
| CPI | 3.4% (2024) |
| Dry powder | $1.56T (Nov 2024) |
Full Version Awaits
Acadia PESTLE Analysis
The preview shown here is the exact Acadia PESTLE Analysis document you’ll receive after purchase—fully formatted and ready to use. This is the real file with complete content, structure, and professional layout. After checkout you can download this identical document instantly.

Your Shortcut to Market Insight Starts Here
Discover how political shifts, economic trends, and technological advances are shaping Acadia's strategic outlook in our concise PESTLE snapshot—perfect for investors and strategists. Buy the full analysis to unlock detailed risks, opportunities, and actionable recommendations for immediate use.
Political factors
Local zoning and land-use approvals
Street-retail and mixed-use projects depend on municipal zoning, variances and special permits, with typical US entitlement timelines ranging 12–24 months; pro-development councils can compress that to roughly 9–12 months. Restrictive boards commonly force downsizing or multi-quarter delays that increase carrying costs. Active stakeholder engagement, including early community outreach, materially improves approval odds and consistency across target cities reduces execution risk.
Tax policy and incentives
Property tax burdens vary widely—effective rates ranged from 0.28% in Hawaii to 2.44% in New Jersey in 2024—altering underwriting and cap-rate assumptions for Acadia assets. Abatements and TIF arrangements can materially boost redevelopment returns by lowering carrying costs and improving cash-on-cash in early years. Shifts in state and city tax regimes can compress NOI or enhance yields, so monitoring legislative cycles lets Acadia structure deals proactively. Negotiated incentives have improved IRRs on value-add funds by accelerating stabilization and reducing upfront tax expense.
Urban policy and public safety priorities
Cities’ allocations shape retail foot traffic: New York City’s 2024 budget earmarked roughly 11.5 billion for policing and 1.6 billion for sanitation, directly supporting public realm upkeep and perceived safety. Improved safety initiatives lift tenant demand and rents while deteriorating conditions depress occupancy; public-private partnerships such as BIDs are used to revitalize corridors. Location selection should weigh policy stability across metros.
Infrastructure and transit funding
Transit expansions and streetscape investments boost accessibility and retail vibrancy; the 2021 Infrastructure Investment and Jobs Act commits about 1.2 trillion USD in total federal infrastructure funding with roughly 89.9 billion USD for public transit over five years (2021–2026), so local projects tied to these streams can catalyze nearby densification. Delays or cuts in disbursements stall development pipelines; advocacy for complete-street projects supports street retail and higher pedestrian spend. Capital allocation should track planned infrastructure timelines and grant cycles through 2026 to avoid stranded investment.
- Track IIJA 2021 funding timing
- Prioritize complete-street advocacy
- Align capex with 2021–2026 grant cycles
Historic preservation and design review
Many urban assets face landmark controls and design committees that commonly add 5–15% in construction costs and 6–12 months to delivery, though they help preserve the neighborhood character that can drive 10–20% rent premiums for premium tenants. Early coordination with preservation authorities reduces rework, change orders and schedule risk. Budgets should explicitly include façade, material and approval contingency.
- cost-impact: 5–15%
- time-impact: 6–12 months
- rent-premium: 10–20%
- mitigation: early coordination, approval contingency
Entitlement delays, taxes and IIJA transit funding reshape development returns
Entitlement timelines typically 9–24 months (pro-development 9–12), with restrictive boards causing multi-quarter delays and higher carrying costs. Effective property tax rates ranged 0.28%–2.44% in 2024; abatements/TIFs improve early-year cashflow. IIJA allocates ~$89.9B for transit (2021–26) enabling densification; landmark controls add 5–15% cost and 6–12 months delay, mitigated by early engagement.
| Factor | Impact | Key Stat | Mitigation |
|---|---|---|---|
| Entitlements | Delay/carry | 9–24 months | Early outreach |
| Taxes | NOI/cap rates | 0.28%–2.44% (2024) | Abatements/TIF |
| Transit | Demand uplift | $89.9B transit (IIJA) | Align capex |
| Preservation | Cost/time | +5–15%, +6–12m | Coordination |
What is included in the product
Detailed Word Document
Explores how external macro-environmental factors uniquely affect the Acadia across Political, Economic, Social, Technological, Environmental and Legal dimensions, with each section supported by current data and trends to identify specific risks and opportunities. Designed for executives, advisors and investors, it offers forward-looking insights, detailed sub-points and clean formatting ready for business plans or pitch decks.
Customizable Excel Spreadsheet
A concise, visually segmented PESTLE summary of Acadia that’s easily dropped into presentations or shared across teams, enabling quick alignment on external risks and strategic positioning; editable notes let users tailor insights to region or business line.
Economic factors
Interest rates and cap rate spreads
REIT cost of capital and acquisition yields are highly rate sensitive: the 10-year Treasury was about 4.20% in July 2025, and typical US REIT cap-rate spreads around 300 basis points compress valuations and FFO when rates rise. Lower rates enable accretive growth by widening arbitrage between financing costs and property yields. Active hedging and prudent leverage preserve balance-sheet flexibility, while cap-rate spreads versus Treasuries guide buy-sell timing.
Consumer spending and retail sales cycles
Retail tenant health tracks employment, wage growth and consumer confidence; U.S. unemployment hovered near 3.7% mid-2025 and average hourly earnings rose roughly 4% YoY in 2024, supporting retail sales growth of about 4.5% YoY in 2024. Weak cycles drive tenant churn and rent concessions, while strong cycles lift Same-Property NOI. A shift toward necessity and experiential tenants stabilizes cash flow. Monitoring category-level sales cuts default risk.
Construction and redevelopment costs
Materials, labor, and contractor availability directly compress value-add returns as schedule slippage and premium labor raise costs; US CPI inflation averaged 3.4% in 2024, pressuring budgets. Inflation or supply bottlenecks can erode contingency buffers quickly. Phasing and GMP contracts help cap downside risk, while vendor diversification and early procurement improve deliverability and price predictability.
Credit markets and fund-raising conditions
Opportunistic funds hinge on LP appetite and lending liquidity; tight credit widens bid-ask spreads and creates distressed entry points while loose credit raises competition for assets. Maintaining dry powder—Preqin reports $1.56 trillion in global private equity dry powder as of Nov 2024—enables cycle-timed deployment. A strong track record lowers LP hurdle rates and speeds capital placement.
- LP appetite + lending liquidity determine deal flow
- Tight credit => wider spreads, distressed opportunities
- Loose credit => higher competition
- Dry powder $1.56T (Nov 2024) enables timing
- Track record reduces hurdle rates
E-commerce pressure and omnichannel adaptation
Shifts to online reduce tenant margins and force smaller store footprints as global e-commerce surpassed roughly $6 trillion in 2024, pressuring traditional retail rents and sales density.
Locations enabling BOPIS and last-mile delivery retain higher occupancy rates and command premium rents, while curating service, dining, and health uses mitigates displacement risk.
Data-driven tenanting—using POS and footfall analytics—aligns spaces with evolving spend patterns and boosts portfolio resilience.
- e-commerce ~$6T (2024)
- BOPIS/last-mile = higher occupancy
- Service/dining/health = lower vacancy
- Data-driven tenant mix = better yields
Entitlement delays, taxes and IIJA transit funding reshape development returns
10-yr Treasury ~4.20% (Jul 2025) raises REIT cap-rate pressure; typical cap-rate spreads ~300 bps affect valuations and FFO. US unemployment ~3.7% (mid-2025) and avg hourly earnings +4% YoY (2024) support retail demand. US CPI 3.4% (2024) and supply/labor shortages lift costs. Dry powder $1.56T (Nov 2024) shapes opportunistic deployment.
| Metric | Value |
|---|---|
| 10‑yr Treasury | 4.20% (Jul 2025) |
| Cap‑rate spread | ~300 bps |
| Unemployment | 3.7% (mid‑2025) |
| Avg hourly earnings | +4% YoY (2024) |
| CPI | 3.4% (2024) |
| Dry powder | $1.56T (Nov 2024) |
Full Version Awaits
Acadia PESTLE Analysis
The preview shown here is the exact Acadia PESTLE Analysis document you’ll receive after purchase—fully formatted and ready to use. This is the real file with complete content, structure, and professional layout. After checkout you can download this identical document instantly.
Description
Your Shortcut to Market Insight Starts Here
Discover how political shifts, economic trends, and technological advances are shaping Acadia's strategic outlook in our concise PESTLE snapshot—perfect for investors and strategists. Buy the full analysis to unlock detailed risks, opportunities, and actionable recommendations for immediate use.
Political factors
Local zoning and land-use approvals
Street-retail and mixed-use projects depend on municipal zoning, variances and special permits, with typical US entitlement timelines ranging 12–24 months; pro-development councils can compress that to roughly 9–12 months. Restrictive boards commonly force downsizing or multi-quarter delays that increase carrying costs. Active stakeholder engagement, including early community outreach, materially improves approval odds and consistency across target cities reduces execution risk.
Tax policy and incentives
Property tax burdens vary widely—effective rates ranged from 0.28% in Hawaii to 2.44% in New Jersey in 2024—altering underwriting and cap-rate assumptions for Acadia assets. Abatements and TIF arrangements can materially boost redevelopment returns by lowering carrying costs and improving cash-on-cash in early years. Shifts in state and city tax regimes can compress NOI or enhance yields, so monitoring legislative cycles lets Acadia structure deals proactively. Negotiated incentives have improved IRRs on value-add funds by accelerating stabilization and reducing upfront tax expense.
Urban policy and public safety priorities
Cities’ allocations shape retail foot traffic: New York City’s 2024 budget earmarked roughly 11.5 billion for policing and 1.6 billion for sanitation, directly supporting public realm upkeep and perceived safety. Improved safety initiatives lift tenant demand and rents while deteriorating conditions depress occupancy; public-private partnerships such as BIDs are used to revitalize corridors. Location selection should weigh policy stability across metros.
Infrastructure and transit funding
Transit expansions and streetscape investments boost accessibility and retail vibrancy; the 2021 Infrastructure Investment and Jobs Act commits about 1.2 trillion USD in total federal infrastructure funding with roughly 89.9 billion USD for public transit over five years (2021–2026), so local projects tied to these streams can catalyze nearby densification. Delays or cuts in disbursements stall development pipelines; advocacy for complete-street projects supports street retail and higher pedestrian spend. Capital allocation should track planned infrastructure timelines and grant cycles through 2026 to avoid stranded investment.
- Track IIJA 2021 funding timing
- Prioritize complete-street advocacy
- Align capex with 2021–2026 grant cycles
Historic preservation and design review
Many urban assets face landmark controls and design committees that commonly add 5–15% in construction costs and 6–12 months to delivery, though they help preserve the neighborhood character that can drive 10–20% rent premiums for premium tenants. Early coordination with preservation authorities reduces rework, change orders and schedule risk. Budgets should explicitly include façade, material and approval contingency.
- cost-impact: 5–15%
- time-impact: 6–12 months
- rent-premium: 10–20%
- mitigation: early coordination, approval contingency
Entitlement delays, taxes and IIJA transit funding reshape development returns
Entitlement timelines typically 9–24 months (pro-development 9–12), with restrictive boards causing multi-quarter delays and higher carrying costs. Effective property tax rates ranged 0.28%–2.44% in 2024; abatements/TIFs improve early-year cashflow. IIJA allocates ~$89.9B for transit (2021–26) enabling densification; landmark controls add 5–15% cost and 6–12 months delay, mitigated by early engagement.
| Factor | Impact | Key Stat | Mitigation |
|---|---|---|---|
| Entitlements | Delay/carry | 9–24 months | Early outreach |
| Taxes | NOI/cap rates | 0.28%–2.44% (2024) | Abatements/TIF |
| Transit | Demand uplift | $89.9B transit (IIJA) | Align capex |
| Preservation | Cost/time | +5–15%, +6–12m | Coordination |
What is included in the product
Detailed Word Document
Explores how external macro-environmental factors uniquely affect the Acadia across Political, Economic, Social, Technological, Environmental and Legal dimensions, with each section supported by current data and trends to identify specific risks and opportunities. Designed for executives, advisors and investors, it offers forward-looking insights, detailed sub-points and clean formatting ready for business plans or pitch decks.
Customizable Excel Spreadsheet
A concise, visually segmented PESTLE summary of Acadia that’s easily dropped into presentations or shared across teams, enabling quick alignment on external risks and strategic positioning; editable notes let users tailor insights to region or business line.
Economic factors
Interest rates and cap rate spreads
REIT cost of capital and acquisition yields are highly rate sensitive: the 10-year Treasury was about 4.20% in July 2025, and typical US REIT cap-rate spreads around 300 basis points compress valuations and FFO when rates rise. Lower rates enable accretive growth by widening arbitrage between financing costs and property yields. Active hedging and prudent leverage preserve balance-sheet flexibility, while cap-rate spreads versus Treasuries guide buy-sell timing.
Consumer spending and retail sales cycles
Retail tenant health tracks employment, wage growth and consumer confidence; U.S. unemployment hovered near 3.7% mid-2025 and average hourly earnings rose roughly 4% YoY in 2024, supporting retail sales growth of about 4.5% YoY in 2024. Weak cycles drive tenant churn and rent concessions, while strong cycles lift Same-Property NOI. A shift toward necessity and experiential tenants stabilizes cash flow. Monitoring category-level sales cuts default risk.
Construction and redevelopment costs
Materials, labor, and contractor availability directly compress value-add returns as schedule slippage and premium labor raise costs; US CPI inflation averaged 3.4% in 2024, pressuring budgets. Inflation or supply bottlenecks can erode contingency buffers quickly. Phasing and GMP contracts help cap downside risk, while vendor diversification and early procurement improve deliverability and price predictability.
Credit markets and fund-raising conditions
Opportunistic funds hinge on LP appetite and lending liquidity; tight credit widens bid-ask spreads and creates distressed entry points while loose credit raises competition for assets. Maintaining dry powder—Preqin reports $1.56 trillion in global private equity dry powder as of Nov 2024—enables cycle-timed deployment. A strong track record lowers LP hurdle rates and speeds capital placement.
- LP appetite + lending liquidity determine deal flow
- Tight credit => wider spreads, distressed opportunities
- Loose credit => higher competition
- Dry powder $1.56T (Nov 2024) enables timing
- Track record reduces hurdle rates
E-commerce pressure and omnichannel adaptation
Shifts to online reduce tenant margins and force smaller store footprints as global e-commerce surpassed roughly $6 trillion in 2024, pressuring traditional retail rents and sales density.
Locations enabling BOPIS and last-mile delivery retain higher occupancy rates and command premium rents, while curating service, dining, and health uses mitigates displacement risk.
Data-driven tenanting—using POS and footfall analytics—aligns spaces with evolving spend patterns and boosts portfolio resilience.
- e-commerce ~$6T (2024)
- BOPIS/last-mile = higher occupancy
- Service/dining/health = lower vacancy
- Data-driven tenant mix = better yields
Entitlement delays, taxes and IIJA transit funding reshape development returns
10-yr Treasury ~4.20% (Jul 2025) raises REIT cap-rate pressure; typical cap-rate spreads ~300 bps affect valuations and FFO. US unemployment ~3.7% (mid-2025) and avg hourly earnings +4% YoY (2024) support retail demand. US CPI 3.4% (2024) and supply/labor shortages lift costs. Dry powder $1.56T (Nov 2024) shapes opportunistic deployment.
| Metric | Value |
|---|---|
| 10‑yr Treasury | 4.20% (Jul 2025) |
| Cap‑rate spread | ~300 bps |
| Unemployment | 3.7% (mid‑2025) |
| Avg hourly earnings | +4% YoY (2024) |
| CPI | 3.4% (2024) |
| Dry powder | $1.56T (Nov 2024) |
Full Version Awaits
Acadia PESTLE Analysis
The preview shown here is the exact Acadia PESTLE Analysis document you’ll receive after purchase—fully formatted and ready to use. This is the real file with complete content, structure, and professional layout. After checkout you can download this identical document instantly.











