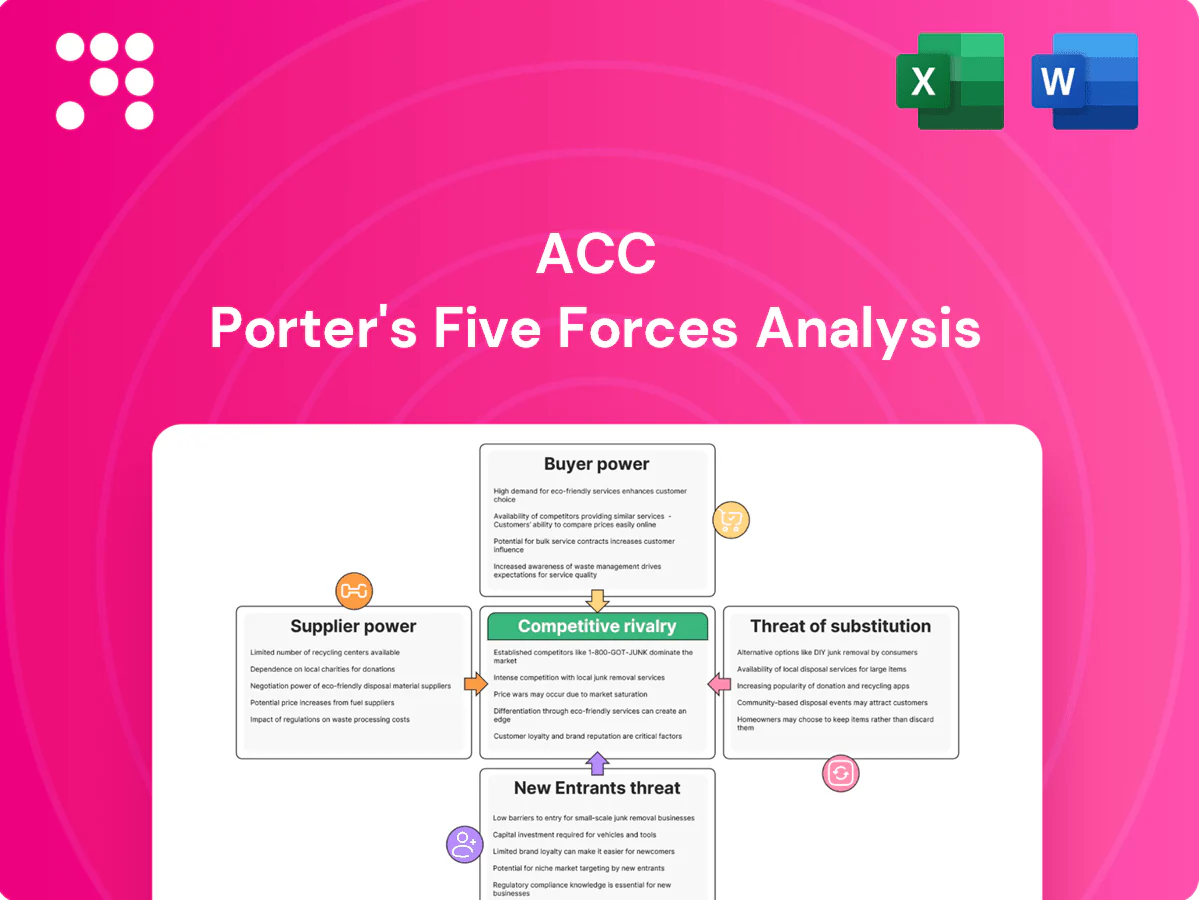
ACC Porter's Five Forces Analysis

Don't Miss the Bigger Picture
ACC faces varied competitive pressures across supplier leverage, buyer bargaining, substitutes and entry threats—this brief snapshot outlines key tension points and strategic levers in three concise sentences. The full Porter's Five Forces Analysis unlocks force-by-force ratings, visuals and business implications tailored to ACC. Purchase the complete report for a consultant-grade Excel and Word deliverable ready for strategy or investor use.
Suppliers Bargaining Power

Raw material concentration
ACC sources limestone, gypsum, fly ash and slag from captive mines and third parties, and regional limestone scarcity gives local quarry owners pricing leverage where captive reserves are limited. Fly ash and slag dependency on coal plants and steel mills creates inter-industry supply risk; India generates roughly 200 million tonnes of fly ash annually (2024), but regional availability and quality variability can push input prices up and tighten contractual terms.
Energy and fuel dependence
Fuel (coal, petcoke) and power drive roughly 30–40% of cement production costs for ACC, with imported coal and volatile international prices amplifying supplier leverage; India imported about 15–25% of its coal in recent years, raising exposure to forex and API2 swings. Domestic allocation rules and spot-price volatility further strengthen suppliers, while alternative fuels and renewable PPAs can reduce this over time but require significant capex and multi-year transition plans, making energy procurement strategy critical to margin stability.

Logistics and freight providers
Cement is freight‑intensive, relying on rail rakes, ports and trucking fleets; rail typically handles over 50% of long‑haul tonnage while trucking covers roughly 70% of last‑mile moves (2024), so logistics costs materially affect margins. Seasonal bottlenecks and regulated rail rake allocation in 2024 increased carrier leverage, but proximity to demand centres lowers exposure; multimodal networks and higher route density dilute supplier power by enabling rail‑to‑road substitution.

Equipment and maintenance OEMs
Specialized kiln, mill and automation OEMs (KHD, FLSmidth, Thyssenkrupp) dominate spares and services, creating supplier leverage; long AMC contracts (commonly 3–5 years) and technical lock‑in raise switching costs while plants target 98–99% uptime, limiting bargaining flexibility.
- OEM concentration: high
- AMC length: 3–5 years
- Uptime target: 98–99%
- Mitigants: multi‑sourcing, in‑house maintenance
Regulatory and land permissions
Regulatory and land permissions function as non-market suppliers for ACC: mining leases, environmental clearances and water extraction rights create binding constraints that can delay projects and raise compliance costs, with India hosting 18 percent of the world population but only about 4 percent of global freshwater, intensifying water permitting pressure. Permit timelines directly affect capacity utilization and can force stoppages or de-bottlenecking, increasing unit costs and negotiation leverage for stakeholders.
- Mining leases: leverage via renewal/transfer timelines
- Environmental clearances: can delay projects months–years
- Water rights: high demand vs limited supply (India: 18% pop, 4% freshwater)
- Stakeholders: communities and regulators add negotiation layers
Suppliers squeeze margins: fuel 30–40%, coal imports 15–25%
Suppliers exert moderate‑to‑high power: fuel/power (30–40% of costs) and imported coal exposure (15–25% of coal) raise leverage; fly ash/slag availability (India ~200 Mt/yr, 2024) and regional limestone scarcity tighten inputs. Logistics (rail >50% long‑haul; trucking ~70% last‑mile, 2024) and OEM spares/AMCs (3–5 yr, uptime 98–99%) increase switching costs; permits and water (India: 18% pop, 4% freshwater) add non‑market constraints.
| Factor | Key metric (2024) |
|---|---|
| Fuel & power | 30–40% costs |
| Coal imports | 15–25% |
| Fly ash | ~200 Mt/yr |
| Logistics | Rail >50% long‑haul; Truck 70% last‑mile |
| OEM/AMCs | 3–5 yr; uptime 98–99% |
| Water stress | India 18% pop, 4% freshwater |
What is included in the product
 Detailed Word Document
Provides a tailored Porter's Five Forces assessment for ACC, uncovering competitive intensity, supplier and buyer power, threat of substitutes and new entrants, and highlighting disruptive forces and strategic levers to protect market share and profitability.

 Customizable Excel Spreadsheet
Clear one-sheet ACC Porter’s Five Forces summary that instantly visualizes competitive pressure with a spider chart, lets you customize force levels for evolving market conditions, and drops straight into pitch decks or Excel dashboards—no macros or finance expertise required.
Customers Bargaining Power

Fragmented retail vs bulk buyers
Retail housing demand is highly fragmented, which limits individual buyer bargaining power and lets ACC defend pricing through brand strength and a broad product portfolio, though channel partners (dealers, retailers) remain influential. Institutional bulk buyers such as EPC contractors and government agencies aggregate volumes and press aggressively on price and credit terms, making negotiation dynamics far tougher in institutional than in retail segments.
Price sensitivity and switching ease
Cement grades are highly standardized (sold commonly in 50‑kg bags) with modest perceived differentiation, so switching between brands is easy; with India consuming about 370 million tonnes in 2023–24, even 1–2% unit price moves scale into material budget shifts on large projects. Local availability and dealer networks therefore drive purchase choice more than technical features, and low switching costs amplify buyer leverage over price and terms.

Dealer and distributor influence
Channel partners control on-ground availability, credit and last-mile service—top dealers in 2024 still account for roughly 40% of volumes, letting them demand better margins, rebates (typically 5–8%) and marketing support. High-throughput dealers negotiate longer payment terms (average 30–45 days) and exclusivity. Growing digital tools and direct engagement (digital penetration ~30% in 2024) can rebalance power by enabling direct sales and real-time inventory. Incentives, payment terms and territorial exclusivity remain key levers.

Quality assurance and service add-ons
Ready-mix services, technical advisory and products like water-resistant cement raise perceived value so buyers tolerate 5–8% pricing premiums for reliable execution; when ACC resolves site issues (consistency, curing, delivery timing) customers accept firmer pricing. Warranty and performance guarantees lower buyer risk and bundled solutions shift negotiations away from price-only leverage.
- Value-added services: RMC, technical support, specialty cements
- Pricing impact: typical 5–8% premium
- Risk mitigation: warranties reduce claim exposure
- Negotiation effect: bundles curb price-only bargaining
Tender-driven procurement
Tender-driven procurement for public infra and large private projects in 2024 remains L1-focused, compressing margins and standardizing contract terms, which raises buyer power and narrows supplier differentiation. Pre-qualification and 3–5-year performance records still favor incumbents, while aggressive bid strategy and regional capacity utilization decide award outcomes.
- Impact: L1 focus often trims contractor margins by 2–4 ppt
- Barrier: Pre-qual & performance history favor market leaders
- Levers: Bid pricing, local capacity, and backlog determine success
Fragmented retail and tender-driven buying squeeze margins; digital channels win premiums
Retail fragmentation limits individual buyer power despite ACC brand; institutional/tender buyers (370 mt 2023–24) drive tougher price/credit terms. Channel dealers (~40% volumes) extract 5–8% rebates and 30–45 day terms, while digital sales (~30% 2024) and RMC/specialty cements support 5–8% premiums and reduce pure price bargaining; L1 tendering trims margins 2–4 ppt.
| Metric | Value | Impact |
|---|---|---|
| Consumption 2023–24 | 370 mt | Large project price sensitivity |
| Top dealers | ~40% | Channel bargaining power |
| Digital penetration 2024 | ~30% | Direct sales leverage |
| Dealer rebates | 5–8% | Margin pressure |
| Payment terms | 30–45 days | Working capital strain |
| Value-add premium | 5–8% | Reduces price-only leverage |
| L1 tender effect | −2–4 ppt | Compresses margins |
Full Version Awaits
ACC Porter's Five Forces Analysis
This preview shows the exact ACC Porter's Five Forces Analysis you'll receive upon purchase—no placeholders or samples. The full, professionally formatted document examines competitive rivalry, supplier and buyer power, and the threats of new entrants and substitutes, plus strategic implications. You'll get instant access to this same file, ready to download and use.

Don't Miss the Bigger Picture
ACC faces varied competitive pressures across supplier leverage, buyer bargaining, substitutes and entry threats—this brief snapshot outlines key tension points and strategic levers in three concise sentences. The full Porter's Five Forces Analysis unlocks force-by-force ratings, visuals and business implications tailored to ACC. Purchase the complete report for a consultant-grade Excel and Word deliverable ready for strategy or investor use.
Suppliers Bargaining Power
Raw material concentration
ACC sources limestone, gypsum, fly ash and slag from captive mines and third parties, and regional limestone scarcity gives local quarry owners pricing leverage where captive reserves are limited. Fly ash and slag dependency on coal plants and steel mills creates inter-industry supply risk; India generates roughly 200 million tonnes of fly ash annually (2024), but regional availability and quality variability can push input prices up and tighten contractual terms.
Energy and fuel dependence
Fuel (coal, petcoke) and power drive roughly 30–40% of cement production costs for ACC, with imported coal and volatile international prices amplifying supplier leverage; India imported about 15–25% of its coal in recent years, raising exposure to forex and API2 swings. Domestic allocation rules and spot-price volatility further strengthen suppliers, while alternative fuels and renewable PPAs can reduce this over time but require significant capex and multi-year transition plans, making energy procurement strategy critical to margin stability.
Logistics and freight providers
Cement is freight‑intensive, relying on rail rakes, ports and trucking fleets; rail typically handles over 50% of long‑haul tonnage while trucking covers roughly 70% of last‑mile moves (2024), so logistics costs materially affect margins. Seasonal bottlenecks and regulated rail rake allocation in 2024 increased carrier leverage, but proximity to demand centres lowers exposure; multimodal networks and higher route density dilute supplier power by enabling rail‑to‑road substitution.
Equipment and maintenance OEMs
Specialized kiln, mill and automation OEMs (KHD, FLSmidth, Thyssenkrupp) dominate spares and services, creating supplier leverage; long AMC contracts (commonly 3–5 years) and technical lock‑in raise switching costs while plants target 98–99% uptime, limiting bargaining flexibility.
- OEM concentration: high
- AMC length: 3–5 years
- Uptime target: 98–99%
- Mitigants: multi‑sourcing, in‑house maintenance
Regulatory and land permissions
Regulatory and land permissions function as non-market suppliers for ACC: mining leases, environmental clearances and water extraction rights create binding constraints that can delay projects and raise compliance costs, with India hosting 18 percent of the world population but only about 4 percent of global freshwater, intensifying water permitting pressure. Permit timelines directly affect capacity utilization and can force stoppages or de-bottlenecking, increasing unit costs and negotiation leverage for stakeholders.
- Mining leases: leverage via renewal/transfer timelines
- Environmental clearances: can delay projects months–years
- Water rights: high demand vs limited supply (India: 18% pop, 4% freshwater)
- Stakeholders: communities and regulators add negotiation layers
Suppliers squeeze margins: fuel 30–40%, coal imports 15–25%
Suppliers exert moderate‑to‑high power: fuel/power (30–40% of costs) and imported coal exposure (15–25% of coal) raise leverage; fly ash/slag availability (India ~200 Mt/yr, 2024) and regional limestone scarcity tighten inputs. Logistics (rail >50% long‑haul; trucking ~70% last‑mile, 2024) and OEM spares/AMCs (3–5 yr, uptime 98–99%) increase switching costs; permits and water (India: 18% pop, 4% freshwater) add non‑market constraints.
| Factor | Key metric (2024) |
|---|---|
| Fuel & power | 30–40% costs |
| Coal imports | 15–25% |
| Fly ash | ~200 Mt/yr |
| Logistics | Rail >50% long‑haul; Truck 70% last‑mile |
| OEM/AMCs | 3–5 yr; uptime 98–99% |
| Water stress | India 18% pop, 4% freshwater |
What is included in the product
Detailed Word Document
Provides a tailored Porter's Five Forces assessment for ACC, uncovering competitive intensity, supplier and buyer power, threat of substitutes and new entrants, and highlighting disruptive forces and strategic levers to protect market share and profitability.
Customizable Excel Spreadsheet
Clear one-sheet ACC Porter’s Five Forces summary that instantly visualizes competitive pressure with a spider chart, lets you customize force levels for evolving market conditions, and drops straight into pitch decks or Excel dashboards—no macros or finance expertise required.
Customers Bargaining Power
Fragmented retail vs bulk buyers
Retail housing demand is highly fragmented, which limits individual buyer bargaining power and lets ACC defend pricing through brand strength and a broad product portfolio, though channel partners (dealers, retailers) remain influential. Institutional bulk buyers such as EPC contractors and government agencies aggregate volumes and press aggressively on price and credit terms, making negotiation dynamics far tougher in institutional than in retail segments.
Price sensitivity and switching ease
Cement grades are highly standardized (sold commonly in 50‑kg bags) with modest perceived differentiation, so switching between brands is easy; with India consuming about 370 million tonnes in 2023–24, even 1–2% unit price moves scale into material budget shifts on large projects. Local availability and dealer networks therefore drive purchase choice more than technical features, and low switching costs amplify buyer leverage over price and terms.
Dealer and distributor influence
Channel partners control on-ground availability, credit and last-mile service—top dealers in 2024 still account for roughly 40% of volumes, letting them demand better margins, rebates (typically 5–8%) and marketing support. High-throughput dealers negotiate longer payment terms (average 30–45 days) and exclusivity. Growing digital tools and direct engagement (digital penetration ~30% in 2024) can rebalance power by enabling direct sales and real-time inventory. Incentives, payment terms and territorial exclusivity remain key levers.
Quality assurance and service add-ons
Ready-mix services, technical advisory and products like water-resistant cement raise perceived value so buyers tolerate 5–8% pricing premiums for reliable execution; when ACC resolves site issues (consistency, curing, delivery timing) customers accept firmer pricing. Warranty and performance guarantees lower buyer risk and bundled solutions shift negotiations away from price-only leverage.
- Value-added services: RMC, technical support, specialty cements
- Pricing impact: typical 5–8% premium
- Risk mitigation: warranties reduce claim exposure
- Negotiation effect: bundles curb price-only bargaining
Tender-driven procurement
Tender-driven procurement for public infra and large private projects in 2024 remains L1-focused, compressing margins and standardizing contract terms, which raises buyer power and narrows supplier differentiation. Pre-qualification and 3–5-year performance records still favor incumbents, while aggressive bid strategy and regional capacity utilization decide award outcomes.
- Impact: L1 focus often trims contractor margins by 2–4 ppt
- Barrier: Pre-qual & performance history favor market leaders
- Levers: Bid pricing, local capacity, and backlog determine success
Fragmented retail and tender-driven buying squeeze margins; digital channels win premiums
Retail fragmentation limits individual buyer power despite ACC brand; institutional/tender buyers (370 mt 2023–24) drive tougher price/credit terms. Channel dealers (~40% volumes) extract 5–8% rebates and 30–45 day terms, while digital sales (~30% 2024) and RMC/specialty cements support 5–8% premiums and reduce pure price bargaining; L1 tendering trims margins 2–4 ppt.
| Metric | Value | Impact |
|---|---|---|
| Consumption 2023–24 | 370 mt | Large project price sensitivity |
| Top dealers | ~40% | Channel bargaining power |
| Digital penetration 2024 | ~30% | Direct sales leverage |
| Dealer rebates | 5–8% | Margin pressure |
| Payment terms | 30–45 days | Working capital strain |
| Value-add premium | 5–8% | Reduces price-only leverage |
| L1 tender effect | −2–4 ppt | Compresses margins |
Full Version Awaits
ACC Porter's Five Forces Analysis
This preview shows the exact ACC Porter's Five Forces Analysis you'll receive upon purchase—no placeholders or samples. The full, professionally formatted document examines competitive rivalry, supplier and buyer power, and the threats of new entrants and substitutes, plus strategic implications. You'll get instant access to this same file, ready to download and use.
Original: $10.00
-65%$10.00
$3.50Description
Don't Miss the Bigger Picture
ACC faces varied competitive pressures across supplier leverage, buyer bargaining, substitutes and entry threats—this brief snapshot outlines key tension points and strategic levers in three concise sentences. The full Porter's Five Forces Analysis unlocks force-by-force ratings, visuals and business implications tailored to ACC. Purchase the complete report for a consultant-grade Excel and Word deliverable ready for strategy or investor use.
Suppliers Bargaining Power
Raw material concentration
ACC sources limestone, gypsum, fly ash and slag from captive mines and third parties, and regional limestone scarcity gives local quarry owners pricing leverage where captive reserves are limited. Fly ash and slag dependency on coal plants and steel mills creates inter-industry supply risk; India generates roughly 200 million tonnes of fly ash annually (2024), but regional availability and quality variability can push input prices up and tighten contractual terms.
Energy and fuel dependence
Fuel (coal, petcoke) and power drive roughly 30–40% of cement production costs for ACC, with imported coal and volatile international prices amplifying supplier leverage; India imported about 15–25% of its coal in recent years, raising exposure to forex and API2 swings. Domestic allocation rules and spot-price volatility further strengthen suppliers, while alternative fuels and renewable PPAs can reduce this over time but require significant capex and multi-year transition plans, making energy procurement strategy critical to margin stability.
Logistics and freight providers
Cement is freight‑intensive, relying on rail rakes, ports and trucking fleets; rail typically handles over 50% of long‑haul tonnage while trucking covers roughly 70% of last‑mile moves (2024), so logistics costs materially affect margins. Seasonal bottlenecks and regulated rail rake allocation in 2024 increased carrier leverage, but proximity to demand centres lowers exposure; multimodal networks and higher route density dilute supplier power by enabling rail‑to‑road substitution.
Equipment and maintenance OEMs
Specialized kiln, mill and automation OEMs (KHD, FLSmidth, Thyssenkrupp) dominate spares and services, creating supplier leverage; long AMC contracts (commonly 3–5 years) and technical lock‑in raise switching costs while plants target 98–99% uptime, limiting bargaining flexibility.
- OEM concentration: high
- AMC length: 3–5 years
- Uptime target: 98–99%
- Mitigants: multi‑sourcing, in‑house maintenance
Regulatory and land permissions
Regulatory and land permissions function as non-market suppliers for ACC: mining leases, environmental clearances and water extraction rights create binding constraints that can delay projects and raise compliance costs, with India hosting 18 percent of the world population but only about 4 percent of global freshwater, intensifying water permitting pressure. Permit timelines directly affect capacity utilization and can force stoppages or de-bottlenecking, increasing unit costs and negotiation leverage for stakeholders.
- Mining leases: leverage via renewal/transfer timelines
- Environmental clearances: can delay projects months–years
- Water rights: high demand vs limited supply (India: 18% pop, 4% freshwater)
- Stakeholders: communities and regulators add negotiation layers
Suppliers squeeze margins: fuel 30–40%, coal imports 15–25%
Suppliers exert moderate‑to‑high power: fuel/power (30–40% of costs) and imported coal exposure (15–25% of coal) raise leverage; fly ash/slag availability (India ~200 Mt/yr, 2024) and regional limestone scarcity tighten inputs. Logistics (rail >50% long‑haul; trucking ~70% last‑mile, 2024) and OEM spares/AMCs (3–5 yr, uptime 98–99%) increase switching costs; permits and water (India: 18% pop, 4% freshwater) add non‑market constraints.
| Factor | Key metric (2024) |
|---|---|
| Fuel & power | 30–40% costs |
| Coal imports | 15–25% |
| Fly ash | ~200 Mt/yr |
| Logistics | Rail >50% long‑haul; Truck 70% last‑mile |
| OEM/AMCs | 3–5 yr; uptime 98–99% |
| Water stress | India 18% pop, 4% freshwater |
What is included in the product
Detailed Word Document
Provides a tailored Porter's Five Forces assessment for ACC, uncovering competitive intensity, supplier and buyer power, threat of substitutes and new entrants, and highlighting disruptive forces and strategic levers to protect market share and profitability.
Customizable Excel Spreadsheet
Clear one-sheet ACC Porter’s Five Forces summary that instantly visualizes competitive pressure with a spider chart, lets you customize force levels for evolving market conditions, and drops straight into pitch decks or Excel dashboards—no macros or finance expertise required.
Customers Bargaining Power
Fragmented retail vs bulk buyers
Retail housing demand is highly fragmented, which limits individual buyer bargaining power and lets ACC defend pricing through brand strength and a broad product portfolio, though channel partners (dealers, retailers) remain influential. Institutional bulk buyers such as EPC contractors and government agencies aggregate volumes and press aggressively on price and credit terms, making negotiation dynamics far tougher in institutional than in retail segments.
Price sensitivity and switching ease
Cement grades are highly standardized (sold commonly in 50‑kg bags) with modest perceived differentiation, so switching between brands is easy; with India consuming about 370 million tonnes in 2023–24, even 1–2% unit price moves scale into material budget shifts on large projects. Local availability and dealer networks therefore drive purchase choice more than technical features, and low switching costs amplify buyer leverage over price and terms.
Dealer and distributor influence
Channel partners control on-ground availability, credit and last-mile service—top dealers in 2024 still account for roughly 40% of volumes, letting them demand better margins, rebates (typically 5–8%) and marketing support. High-throughput dealers negotiate longer payment terms (average 30–45 days) and exclusivity. Growing digital tools and direct engagement (digital penetration ~30% in 2024) can rebalance power by enabling direct sales and real-time inventory. Incentives, payment terms and territorial exclusivity remain key levers.
Quality assurance and service add-ons
Ready-mix services, technical advisory and products like water-resistant cement raise perceived value so buyers tolerate 5–8% pricing premiums for reliable execution; when ACC resolves site issues (consistency, curing, delivery timing) customers accept firmer pricing. Warranty and performance guarantees lower buyer risk and bundled solutions shift negotiations away from price-only leverage.
- Value-added services: RMC, technical support, specialty cements
- Pricing impact: typical 5–8% premium
- Risk mitigation: warranties reduce claim exposure
- Negotiation effect: bundles curb price-only bargaining
Tender-driven procurement
Tender-driven procurement for public infra and large private projects in 2024 remains L1-focused, compressing margins and standardizing contract terms, which raises buyer power and narrows supplier differentiation. Pre-qualification and 3–5-year performance records still favor incumbents, while aggressive bid strategy and regional capacity utilization decide award outcomes.
- Impact: L1 focus often trims contractor margins by 2–4 ppt
- Barrier: Pre-qual & performance history favor market leaders
- Levers: Bid pricing, local capacity, and backlog determine success
Fragmented retail and tender-driven buying squeeze margins; digital channels win premiums
Retail fragmentation limits individual buyer power despite ACC brand; institutional/tender buyers (370 mt 2023–24) drive tougher price/credit terms. Channel dealers (~40% volumes) extract 5–8% rebates and 30–45 day terms, while digital sales (~30% 2024) and RMC/specialty cements support 5–8% premiums and reduce pure price bargaining; L1 tendering trims margins 2–4 ppt.
| Metric | Value | Impact |
|---|---|---|
| Consumption 2023–24 | 370 mt | Large project price sensitivity |
| Top dealers | ~40% | Channel bargaining power |
| Digital penetration 2024 | ~30% | Direct sales leverage |
| Dealer rebates | 5–8% | Margin pressure |
| Payment terms | 30–45 days | Working capital strain |
| Value-add premium | 5–8% | Reduces price-only leverage |
| L1 tender effect | −2–4 ppt | Compresses margins |
Full Version Awaits
ACC Porter's Five Forces Analysis
This preview shows the exact ACC Porter's Five Forces Analysis you'll receive upon purchase—no placeholders or samples. The full, professionally formatted document examines competitive rivalry, supplier and buyer power, and the threats of new entrants and substitutes, plus strategic implications. You'll get instant access to this same file, ready to download and use.











