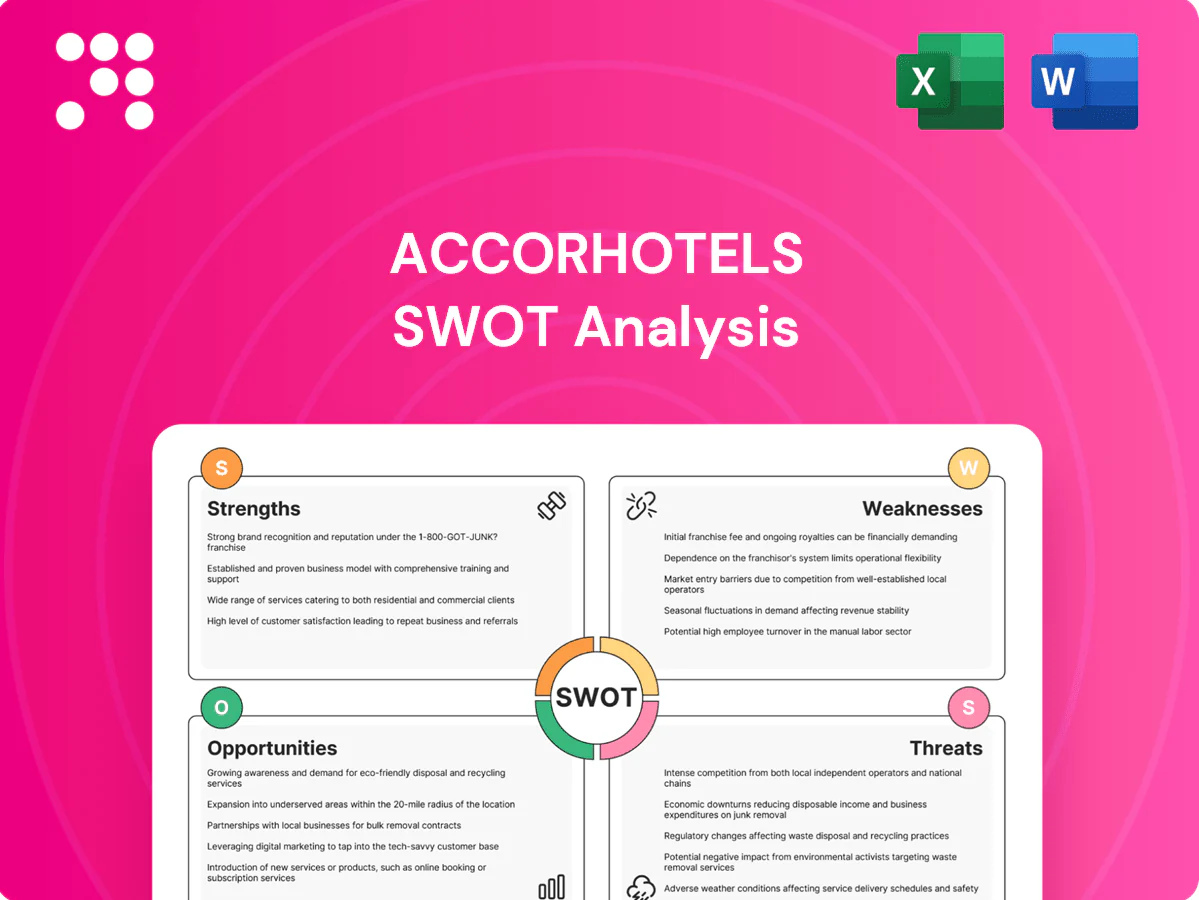
AccorHotels SWOT Analysis

Elevate Your Analysis with the Complete SWOT Report
AccorHotels' SWOT analysis highlights its global brand portfolio, digital push and asset-light strategy, balanced against competitive pressure, margin sensitivity, and evolving travel patterns. Discover strategic opportunities and material risks with expert commentary and financial context. Purchase the full, editable SWOT (Word + Excel) to plan, pitch, or invest with confidence.
Strengths

Diversified brand portfolio
Accor's diversified portfolio spans economy to luxury across roughly 40 brands and 5,500+ hotels in 110 countries, serving multiple guest segments and price points. This breadth hedges demand swings and enables cross-selling across leisure, business and extended-stay occasions. Owner-friendly, asset-light models place over 80% of rooms under management/franchise, aiding owner attraction. ALL loyalty exceeds ~68 million members, sustaining global appeal.
Asset-light management & franchise model
By prioritizing management and franchise agreements, Accor scales with lower capital intensity, operating over 5,600 hotels across 110 countries while more than 70% of its rooms are under management/franchise, not ownership. This asset-light mix boosts return on invested capital and strengthens cash-flow resilience by limiting capex needs. It cuts balance-sheet risk versus owning real estate and enables faster market entry and exit.

Global footprint and distribution
Accor's global footprint spans over 110 countries with more than 5,000 hotels, diversifying revenue across regions and travel cycles. Its direct digital channels and distribution partnerships boost occupancy and yield; loyalty program ALL, with roughly 70 million members (2023), amplifies network effects. These factors drive higher RevPAR and support pricing power in key markets.

Loyalty ecosystem and lifestyle offerings
Accor’s ALL loyalty program bundles hotels, F&B and Experiences to drive repeat business, with 70m+ members reported by 2024. Lifestyle brands and co-working offerings extend engagement beyond overnight stays, increasing frequency and length of visit. This enriches first-party data and wallet share, lifting ancillary revenue potential across F&B, events and co-working.
- 70m+ ALL members (2024)
- Lifestyle/co-working ~10% of portfolio
- Members deliver higher ancillary spend, estimated uplift c.15%
Operational know-how and owner relationships
Decades of operating expertise support standardized quality and tight cost control, with Accor operating over 5,300 hotels across 110 countries and more than 40 brands, driving consistent guest standards and margins. Strong owner relationships and an asset-light model enable steady pipeline growth and competitive conversions from independents. Shared services and centralized procurement scale lower unit costs, boosting franchise economics.
- Network size: >5,300 hotels, 110 countries
- Brand breadth: 40+ brands
- Asset-light focus: owner partnerships drive conversions
- Scale benefits: centralized procurement lowers unit costs
Global hotel platform - ~5,600 hotels in 110 countries; >80% asset-light
Accor operates ~5,600 hotels in 110 countries with 70m+ ALL members and >80% rooms under management/franchise, delivering asset-light scalability, stronger ROIC and cash-flow resilience. Brand breadth (40+) and centralized procurement lower unit costs and boost owner conversions; lifestyle/co-working and loyalty raise ancillary spend and RevPAR.
| Metric | Value |
|---|---|
| Hotels | ~5,600 |
| Countries | 110 |
| ALL members | 70m+ |
| Asset-light | >80% Mngt/Franchise |
What is included in the product
 Detailed Word Document
Provides a concise SWOT analysis of AccorHotels, highlighting key strengths, weaknesses, opportunities, and threats to assess its competitive position, growth drivers, operational gaps, and market risks.

 Customizable Excel Spreadsheet
Provides a concise AccorHotels SWOT matrix for fast strategic alignment and executive snapshots, enabling quick edits to reflect market shifts and easy integration into reports, slides, and internal reviews.
Weaknesses

Exposure to cyclical travel demand
Revenues are highly sensitive to macro shocks that depress leisure and corporate travel, as seen when international arrivals fell 74% in 2020 (UNWTO); Accor, with over 5,500 hotels in 110 countries, faces occupancy swings that undermine margin stability. Volatility in occupancy drives uneven regional recovery—UNWTO reported arrivals reached about 88% of 2019 levels in 2023—making forecasting and capacity planning more complex across markets.
Brand overlap and complexity
Accor’s portfolio of over 40 brands across roughly 5,500 hotels in 110 countries can confuse consumers and dilute clear positioning between economy, midscale and luxury banners. Brand overlaps force higher marketing and segmentation spend to differentiate offerings, increasing unit-level spend for owners. Complexity complicates owner decisions and portfolio optimization, and slows roll-out of group-wide innovations and loyalty initiatives across diverse banners.

Dependence on third-party distribution
Accor remains exposed as OTAs and meta-search channels—dominated by Booking Holdings and Expedia with around 70% share—continue to capture a large share of bookings, forcing commission rates often in the 15–25% range. This reliance raises customer acquisition costs versus direct bookings, reduces ownership of guest data and upsell potential, and creates channel conflicts that limit pricing flexibility and margin management.

Europe-centric revenue mix
Accor's Europe-centric revenue mix keeps a majority of revenues tied to a single region, making results sensitive to European GDP swings, tourism trends and regulatory shifts; FY2024 reporting continued to show Europe as the largest geographic contributor. Seasonality and rising cost inflation in core markets have compressed margins, while limited penetration in some faster-growing APAC and Americas segments lags peers. Currency swings, notably EUR movements versus USD and key emerging-market currencies, add earnings volatility.
- Regional concentration: Europe dominant in FY2024 results
- Margin pressure: seasonality + cost inflation in core markets
- Growth gap: underexposure to APAC/Americas versus peers
- FX risk: EUR volatility impacts reported earnings
Integration and execution risks
Integration and execution risks are acute for Accor as mergers, conversions and lifestyle brand rollouts demand consistent integration; systems harmonization and culture alignment across its network of over 5,800 hotels in 110 countries (2024) take time. Slippage can inflate cost and impair guest experience, risking erosion of intended synergies and projected margin uplift.
- Conversion pipeline: higher IT/CAPEX burden
- Culture: multi-brand staff retraining delays
- Financial: slippage reduces synergy realization
Shocks, brand overlap ~5,800 hotels; OTA ~70%
Revenue exposed to demand shocks (international arrivals fell 74% in 2020; UNWTO) and uneven recovery (arrivals ~88% of 2019 in 2023) causing occupancy and margin volatility. Large, overlapping 40+ brand portfolio across ~5,800 hotels in 110 countries (2024) dilutes positioning and raises marketing/owner costs. Heavy OTA share (~70%) and 15–25% commissions erode direct-booking margins and guest-data control; Europe remains Accor’s largest revenue region (FY2024).
| Metric | Value |
|---|---|
| Hotels (2024) | ~5,800 |
| Countries | 110 |
| OTA market share | ~70% |
| OTA commission | 15–25% |
| Intl arrivals drop (2020) | −74% (UNWTO) |
| Arrivals vs 2019 (2023) | ~88% (UNWTO) |
Full Version Awaits
AccorHotels SWOT Analysis
This is the actual SWOT analysis document for AccorHotels you’ll receive upon purchase—no surprises, just professional quality. The preview below is taken directly from the full report and reflects the same structured, editable content. Purchase unlocks the complete, in-depth version including strengths, weaknesses, opportunities and threats. Use it immediately for strategic planning or investor analysis.

Elevate Your Analysis with the Complete SWOT Report
AccorHotels' SWOT analysis highlights its global brand portfolio, digital push and asset-light strategy, balanced against competitive pressure, margin sensitivity, and evolving travel patterns. Discover strategic opportunities and material risks with expert commentary and financial context. Purchase the full, editable SWOT (Word + Excel) to plan, pitch, or invest with confidence.
Strengths
Diversified brand portfolio
Accor's diversified portfolio spans economy to luxury across roughly 40 brands and 5,500+ hotels in 110 countries, serving multiple guest segments and price points. This breadth hedges demand swings and enables cross-selling across leisure, business and extended-stay occasions. Owner-friendly, asset-light models place over 80% of rooms under management/franchise, aiding owner attraction. ALL loyalty exceeds ~68 million members, sustaining global appeal.
Asset-light management & franchise model
By prioritizing management and franchise agreements, Accor scales with lower capital intensity, operating over 5,600 hotels across 110 countries while more than 70% of its rooms are under management/franchise, not ownership. This asset-light mix boosts return on invested capital and strengthens cash-flow resilience by limiting capex needs. It cuts balance-sheet risk versus owning real estate and enables faster market entry and exit.
Global footprint and distribution
Accor's global footprint spans over 110 countries with more than 5,000 hotels, diversifying revenue across regions and travel cycles. Its direct digital channels and distribution partnerships boost occupancy and yield; loyalty program ALL, with roughly 70 million members (2023), amplifies network effects. These factors drive higher RevPAR and support pricing power in key markets.
Loyalty ecosystem and lifestyle offerings
Accor’s ALL loyalty program bundles hotels, F&B and Experiences to drive repeat business, with 70m+ members reported by 2024. Lifestyle brands and co-working offerings extend engagement beyond overnight stays, increasing frequency and length of visit. This enriches first-party data and wallet share, lifting ancillary revenue potential across F&B, events and co-working.
- 70m+ ALL members (2024)
- Lifestyle/co-working ~10% of portfolio
- Members deliver higher ancillary spend, estimated uplift c.15%
Operational know-how and owner relationships
Decades of operating expertise support standardized quality and tight cost control, with Accor operating over 5,300 hotels across 110 countries and more than 40 brands, driving consistent guest standards and margins. Strong owner relationships and an asset-light model enable steady pipeline growth and competitive conversions from independents. Shared services and centralized procurement scale lower unit costs, boosting franchise economics.
- Network size: >5,300 hotels, 110 countries
- Brand breadth: 40+ brands
- Asset-light focus: owner partnerships drive conversions
- Scale benefits: centralized procurement lowers unit costs
Global hotel platform - ~5,600 hotels in 110 countries; >80% asset-light
Accor operates ~5,600 hotels in 110 countries with 70m+ ALL members and >80% rooms under management/franchise, delivering asset-light scalability, stronger ROIC and cash-flow resilience. Brand breadth (40+) and centralized procurement lower unit costs and boost owner conversions; lifestyle/co-working and loyalty raise ancillary spend and RevPAR.
| Metric | Value |
|---|---|
| Hotels | ~5,600 |
| Countries | 110 |
| ALL members | 70m+ |
| Asset-light | >80% Mngt/Franchise |
What is included in the product
Detailed Word Document
Provides a concise SWOT analysis of AccorHotels, highlighting key strengths, weaknesses, opportunities, and threats to assess its competitive position, growth drivers, operational gaps, and market risks.
Customizable Excel Spreadsheet
Provides a concise AccorHotels SWOT matrix for fast strategic alignment and executive snapshots, enabling quick edits to reflect market shifts and easy integration into reports, slides, and internal reviews.
Weaknesses
Exposure to cyclical travel demand
Revenues are highly sensitive to macro shocks that depress leisure and corporate travel, as seen when international arrivals fell 74% in 2020 (UNWTO); Accor, with over 5,500 hotels in 110 countries, faces occupancy swings that undermine margin stability. Volatility in occupancy drives uneven regional recovery—UNWTO reported arrivals reached about 88% of 2019 levels in 2023—making forecasting and capacity planning more complex across markets.
Brand overlap and complexity
Accor’s portfolio of over 40 brands across roughly 5,500 hotels in 110 countries can confuse consumers and dilute clear positioning between economy, midscale and luxury banners. Brand overlaps force higher marketing and segmentation spend to differentiate offerings, increasing unit-level spend for owners. Complexity complicates owner decisions and portfolio optimization, and slows roll-out of group-wide innovations and loyalty initiatives across diverse banners.
Dependence on third-party distribution
Accor remains exposed as OTAs and meta-search channels—dominated by Booking Holdings and Expedia with around 70% share—continue to capture a large share of bookings, forcing commission rates often in the 15–25% range. This reliance raises customer acquisition costs versus direct bookings, reduces ownership of guest data and upsell potential, and creates channel conflicts that limit pricing flexibility and margin management.
Europe-centric revenue mix
Accor's Europe-centric revenue mix keeps a majority of revenues tied to a single region, making results sensitive to European GDP swings, tourism trends and regulatory shifts; FY2024 reporting continued to show Europe as the largest geographic contributor. Seasonality and rising cost inflation in core markets have compressed margins, while limited penetration in some faster-growing APAC and Americas segments lags peers. Currency swings, notably EUR movements versus USD and key emerging-market currencies, add earnings volatility.
- Regional concentration: Europe dominant in FY2024 results
- Margin pressure: seasonality + cost inflation in core markets
- Growth gap: underexposure to APAC/Americas versus peers
- FX risk: EUR volatility impacts reported earnings
Integration and execution risks
Integration and execution risks are acute for Accor as mergers, conversions and lifestyle brand rollouts demand consistent integration; systems harmonization and culture alignment across its network of over 5,800 hotels in 110 countries (2024) take time. Slippage can inflate cost and impair guest experience, risking erosion of intended synergies and projected margin uplift.
- Conversion pipeline: higher IT/CAPEX burden
- Culture: multi-brand staff retraining delays
- Financial: slippage reduces synergy realization
Shocks, brand overlap ~5,800 hotels; OTA ~70%
Revenue exposed to demand shocks (international arrivals fell 74% in 2020; UNWTO) and uneven recovery (arrivals ~88% of 2019 in 2023) causing occupancy and margin volatility. Large, overlapping 40+ brand portfolio across ~5,800 hotels in 110 countries (2024) dilutes positioning and raises marketing/owner costs. Heavy OTA share (~70%) and 15–25% commissions erode direct-booking margins and guest-data control; Europe remains Accor’s largest revenue region (FY2024).
| Metric | Value |
|---|---|
| Hotels (2024) | ~5,800 |
| Countries | 110 |
| OTA market share | ~70% |
| OTA commission | 15–25% |
| Intl arrivals drop (2020) | −74% (UNWTO) |
| Arrivals vs 2019 (2023) | ~88% (UNWTO) |
Full Version Awaits
AccorHotels SWOT Analysis
This is the actual SWOT analysis document for AccorHotels you’ll receive upon purchase—no surprises, just professional quality. The preview below is taken directly from the full report and reflects the same structured, editable content. Purchase unlocks the complete, in-depth version including strengths, weaknesses, opportunities and threats. Use it immediately for strategic planning or investor analysis.
Original: $10.00
-65%$10.00
$3.50Description
Elevate Your Analysis with the Complete SWOT Report
AccorHotels' SWOT analysis highlights its global brand portfolio, digital push and asset-light strategy, balanced against competitive pressure, margin sensitivity, and evolving travel patterns. Discover strategic opportunities and material risks with expert commentary and financial context. Purchase the full, editable SWOT (Word + Excel) to plan, pitch, or invest with confidence.
Strengths
Diversified brand portfolio
Accor's diversified portfolio spans economy to luxury across roughly 40 brands and 5,500+ hotels in 110 countries, serving multiple guest segments and price points. This breadth hedges demand swings and enables cross-selling across leisure, business and extended-stay occasions. Owner-friendly, asset-light models place over 80% of rooms under management/franchise, aiding owner attraction. ALL loyalty exceeds ~68 million members, sustaining global appeal.
Asset-light management & franchise model
By prioritizing management and franchise agreements, Accor scales with lower capital intensity, operating over 5,600 hotels across 110 countries while more than 70% of its rooms are under management/franchise, not ownership. This asset-light mix boosts return on invested capital and strengthens cash-flow resilience by limiting capex needs. It cuts balance-sheet risk versus owning real estate and enables faster market entry and exit.
Global footprint and distribution
Accor's global footprint spans over 110 countries with more than 5,000 hotels, diversifying revenue across regions and travel cycles. Its direct digital channels and distribution partnerships boost occupancy and yield; loyalty program ALL, with roughly 70 million members (2023), amplifies network effects. These factors drive higher RevPAR and support pricing power in key markets.
Loyalty ecosystem and lifestyle offerings
Accor’s ALL loyalty program bundles hotels, F&B and Experiences to drive repeat business, with 70m+ members reported by 2024. Lifestyle brands and co-working offerings extend engagement beyond overnight stays, increasing frequency and length of visit. This enriches first-party data and wallet share, lifting ancillary revenue potential across F&B, events and co-working.
- 70m+ ALL members (2024)
- Lifestyle/co-working ~10% of portfolio
- Members deliver higher ancillary spend, estimated uplift c.15%
Operational know-how and owner relationships
Decades of operating expertise support standardized quality and tight cost control, with Accor operating over 5,300 hotels across 110 countries and more than 40 brands, driving consistent guest standards and margins. Strong owner relationships and an asset-light model enable steady pipeline growth and competitive conversions from independents. Shared services and centralized procurement scale lower unit costs, boosting franchise economics.
- Network size: >5,300 hotels, 110 countries
- Brand breadth: 40+ brands
- Asset-light focus: owner partnerships drive conversions
- Scale benefits: centralized procurement lowers unit costs
Global hotel platform - ~5,600 hotels in 110 countries; >80% asset-light
Accor operates ~5,600 hotels in 110 countries with 70m+ ALL members and >80% rooms under management/franchise, delivering asset-light scalability, stronger ROIC and cash-flow resilience. Brand breadth (40+) and centralized procurement lower unit costs and boost owner conversions; lifestyle/co-working and loyalty raise ancillary spend and RevPAR.
| Metric | Value |
|---|---|
| Hotels | ~5,600 |
| Countries | 110 |
| ALL members | 70m+ |
| Asset-light | >80% Mngt/Franchise |
What is included in the product
Detailed Word Document
Provides a concise SWOT analysis of AccorHotels, highlighting key strengths, weaknesses, opportunities, and threats to assess its competitive position, growth drivers, operational gaps, and market risks.
Customizable Excel Spreadsheet
Provides a concise AccorHotels SWOT matrix for fast strategic alignment and executive snapshots, enabling quick edits to reflect market shifts and easy integration into reports, slides, and internal reviews.
Weaknesses
Exposure to cyclical travel demand
Revenues are highly sensitive to macro shocks that depress leisure and corporate travel, as seen when international arrivals fell 74% in 2020 (UNWTO); Accor, with over 5,500 hotels in 110 countries, faces occupancy swings that undermine margin stability. Volatility in occupancy drives uneven regional recovery—UNWTO reported arrivals reached about 88% of 2019 levels in 2023—making forecasting and capacity planning more complex across markets.
Brand overlap and complexity
Accor’s portfolio of over 40 brands across roughly 5,500 hotels in 110 countries can confuse consumers and dilute clear positioning between economy, midscale and luxury banners. Brand overlaps force higher marketing and segmentation spend to differentiate offerings, increasing unit-level spend for owners. Complexity complicates owner decisions and portfolio optimization, and slows roll-out of group-wide innovations and loyalty initiatives across diverse banners.
Dependence on third-party distribution
Accor remains exposed as OTAs and meta-search channels—dominated by Booking Holdings and Expedia with around 70% share—continue to capture a large share of bookings, forcing commission rates often in the 15–25% range. This reliance raises customer acquisition costs versus direct bookings, reduces ownership of guest data and upsell potential, and creates channel conflicts that limit pricing flexibility and margin management.
Europe-centric revenue mix
Accor's Europe-centric revenue mix keeps a majority of revenues tied to a single region, making results sensitive to European GDP swings, tourism trends and regulatory shifts; FY2024 reporting continued to show Europe as the largest geographic contributor. Seasonality and rising cost inflation in core markets have compressed margins, while limited penetration in some faster-growing APAC and Americas segments lags peers. Currency swings, notably EUR movements versus USD and key emerging-market currencies, add earnings volatility.
- Regional concentration: Europe dominant in FY2024 results
- Margin pressure: seasonality + cost inflation in core markets
- Growth gap: underexposure to APAC/Americas versus peers
- FX risk: EUR volatility impacts reported earnings
Integration and execution risks
Integration and execution risks are acute for Accor as mergers, conversions and lifestyle brand rollouts demand consistent integration; systems harmonization and culture alignment across its network of over 5,800 hotels in 110 countries (2024) take time. Slippage can inflate cost and impair guest experience, risking erosion of intended synergies and projected margin uplift.
- Conversion pipeline: higher IT/CAPEX burden
- Culture: multi-brand staff retraining delays
- Financial: slippage reduces synergy realization
Shocks, brand overlap ~5,800 hotels; OTA ~70%
Revenue exposed to demand shocks (international arrivals fell 74% in 2020; UNWTO) and uneven recovery (arrivals ~88% of 2019 in 2023) causing occupancy and margin volatility. Large, overlapping 40+ brand portfolio across ~5,800 hotels in 110 countries (2024) dilutes positioning and raises marketing/owner costs. Heavy OTA share (~70%) and 15–25% commissions erode direct-booking margins and guest-data control; Europe remains Accor’s largest revenue region (FY2024).
| Metric | Value |
|---|---|
| Hotels (2024) | ~5,800 |
| Countries | 110 |
| OTA market share | ~70% |
| OTA commission | 15–25% |
| Intl arrivals drop (2020) | −74% (UNWTO) |
| Arrivals vs 2019 (2023) | ~88% (UNWTO) |
Full Version Awaits
AccorHotels SWOT Analysis
This is the actual SWOT analysis document for AccorHotels you’ll receive upon purchase—no surprises, just professional quality. The preview below is taken directly from the full report and reflects the same structured, editable content. Purchase unlocks the complete, in-depth version including strengths, weaknesses, opportunities and threats. Use it immediately for strategic planning or investor analysis.











