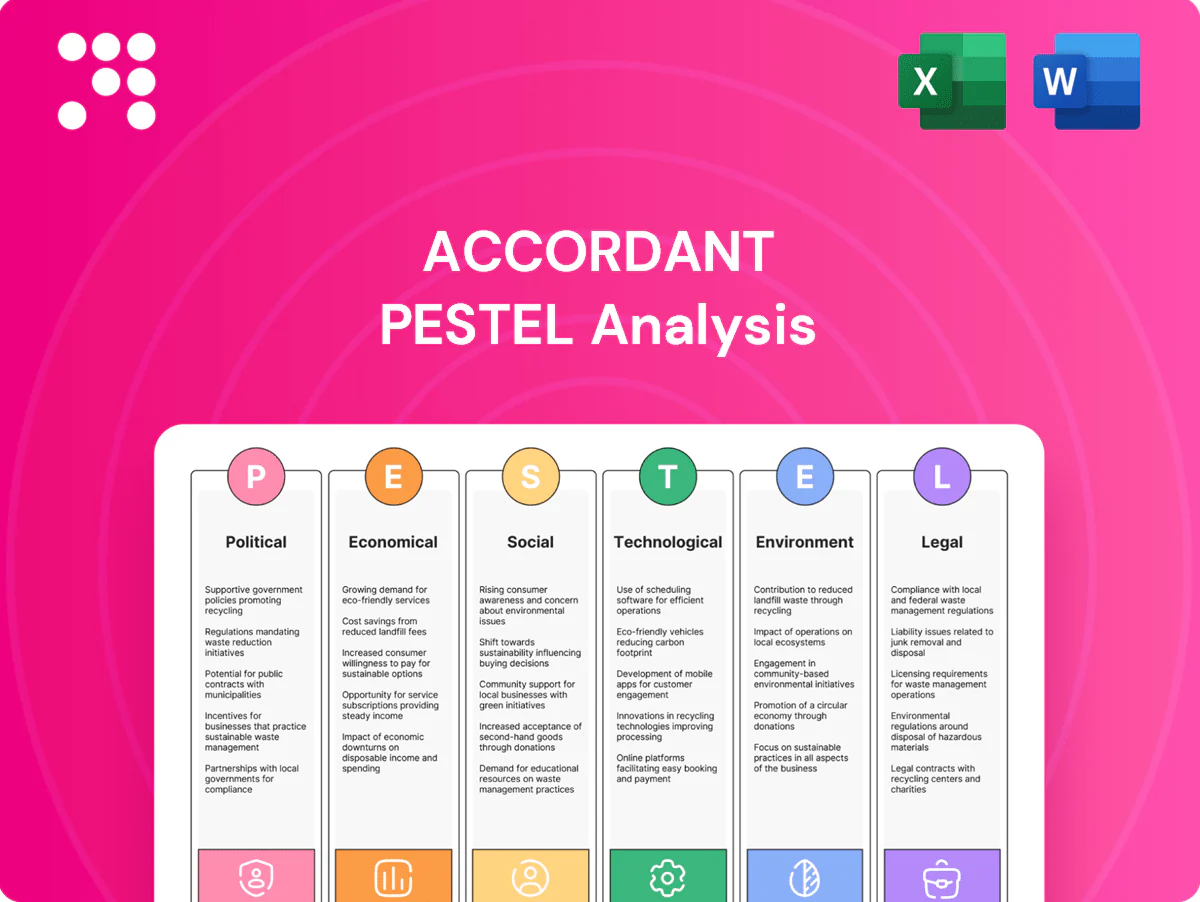
Accordant PESTLE Analysis

Your Shortcut to Market Insight Starts Here
Discover how political shifts, economic cycles, and tech disruption are shaping Accordant’s strategic path in our concise PESTLE snapshot. This analysis highlights risks and opportunity levers investors and strategists need to act on today. Ready-made and research-backed, the full PESTLE delivers detailed, actionable insights—purchase now to access the complete report.
Political factors

Shifting federal reimbursement policy
Medicare and Medicaid account for roughly 50% of U.S. hospital revenue, so annual CMS rulemaking—altering DRG payments, quality programs, and telehealth coverage—directly shifts demand for revenue cycle optimization. Accordant must monitor IPPS/OPPS rule changes and recalibrate clients’ coding, documentation, and billing workflows in real time. Proactive policy monitoring is a marketable differentiator in advisory engagements.
Election cycles and healthcare priorities
Administrative changes can redirect funding, enforcement intensity, and incentives across value-based care and price transparency, affecting markets where Medicare enrollment reached about 66 million beneficiaries in 2024 and HHS targets 50% value-based payments by 2030. Policy volatility can shift client budgets and timing for consulting projects as enforcement (CMS price-transparency fines up to $2 million) changes. Accordant should scenario-plan for swings that impact revenue capture and compliance. Thought leadership can position clients for multi-year transitions.

State-level Medicaid and regulatory diversity
State Medicaid expansion varies—as of July 2025 forty states plus DC have expanded eligibility—while Medicaid managed care covers roughly 80% of enrollees nationally, and state HIE and interoperability policies differ widely. Multi-state health systems therefore need localized documentation and billing compliance. Accordant can tailor state-specific playbooks for prior auth, coverage rules, and audit defense. Local policy intelligence shortens time-to-ROI by reducing denials and accelerating reimbursements.

Government price transparency and competition
Government price-transparency rules (CMS rule effective Jan 1, 2021) pressure margins and expose pricing strategies; commercial rates commonly run 2–3x Medicare and CMS may levy civil monetary penalties up to $300/day for noncompliance. Increased scrutiny drives revenue integrity and CDI to justify charges; Accordant can align documentation to clinical severity and support fair pricing narratives amid consolidation pressures.
- CMS rule effective 2021
- Commercial rates ~2–3x Medicare
- Penalties up to $300/day
- Consolidation raises integration need
Public health preparedness funding
Policy emphasis on preparedness, backed by CDC PHEP funding near $700 million annually, drives hospitals to invest in data, analytics, and reporting to meet requirements; federal grants and DMI-era allocations (roughly $1 billion directed to data modernization efforts) subsidize HIM upgrades and interoperability projects. Accordant helps map preparedness metrics to documentation standards, linking compliance to operational resilience and reimbursement pathways.
- Preparedness funding: CDC PHEP ≈ $700M
- Data modernization: ≈ $1B in federal allocations
- Impact: grants finance HIM/interoperability
- Accordant role: map metrics to documentation for compliance + reimbursement
≈50% Medicare/Medicaid revenue prompts RCM & HIM investment
Medicare/Medicaid ≈50% of hospital revenue; 66M Medicare beneficiaries (2024) shift demand for revenue-cycle optimization. As of July 2025, 40 states+DC expanded Medicaid; state rules require localized billing playbooks. Price-transparency enforcement (penalties ≈$300/day; CMS fines up to $2M) and preparedness/data funding drive investment in HIM and interoperability.
| Metric | Value | Impact |
|---|---|---|
| Medicare/Medicaid share | ≈50% | Revenue sensitivity |
| Medicare beneficiaries | 66M (2024) | Demand for optimization |
| Medicaid expansion | 40 states + DC (Jul 2025) | Local compliance |
| Price-transparency penalty | ≈$300/day | Compliance spend |
| CMS fines | Up to $2M | Risk exposure |
| CDC PHEP | ≈$700M | Preparedness funding |
| Data modernization | ≈$1B | HIM/interoperability investment |
What is included in the product
 Detailed Word Document
Explores how external macro-environmental factors uniquely affect the Accordant across Political, Economic, Social, Technological, Environmental, and Legal dimensions, with each category expanded into detailed, business-specific sub-points. Every section is backed by current data and forward-looking insights to support executives, consultants, and entrepreneurs in scenario planning, risk mitigation, and opportunity identification.

 Customizable Excel Spreadsheet
A compact, editable PESTLE snapshot organized by category for quick sharing in meetings, presentations, or client reports—uses plain language and visual segmentation to speed alignment and decision-making.
Economic factors

Margin pressure and cost containment
Rising labor, supply and drug costs have pushed many U.S. hospitals into negative operating margins (median negative in 2023), while revenue cycle leakage—commonly 3–5% of gross revenue—now threatens cash flow. Accordant’s RCM optimization and denial-prevention programs deliver rapid payback by recapturing net revenue. Business cases tied to projected net revenue lift and ROI drive faster approvals.
Payer mix shifts and bad debt risk
Shifts toward public payers—now roughly half of the U.S. payer mix—compress yields versus commercial rates while patient responsibility has climbed (average single-plan deductible ~$1,760 in 2023). Economic slowdowns drive higher uncompensated care and tougher collections; Accordant builds patient financial engagement and propensity-to-pay pathways, plus enhanced eligibility and documentation workflows to help stabilize cash and reduce bad debt.

Consolidation and integration waves
Waves of M&A, joint ventures and physician practice acquisitions have pushed over 50% of US physicians into system employment, creating highly fragmented RCM and HIM stacks. Integration demands standardized policies, coding and KPIs across sites; Accordant can lead PMOs to harmonize EHR workflows and charge capture. Realizing synergies—often a mid-single-digit to low-double-digit percent revenue improvement—depends on disciplined CDI and revenue integrity.

Capital constraints and ROI scrutiny
Higher interest rates (Federal funds target 5.25–5.50% as of July 2025) and tighter corporate balance sheets delay large IT purchases, forcing ROI scrutiny and prioritization of near-term paybacks. Consulting engagements must demonstrate quick wins and staged benefits; Accordant can adopt phased delivery with shared-savings or value-based pricing to de-risk buys. Benchmarking and dashboards validate financial impact and support renewal decisions.
- Phased delivery: reduces upfront capex
- Shared-savings: aligns incentives
- Dashboards: prove ROI monthly/quarterly
Value-based payment and risk contracts
Shift to bundled payments and ACO models ties revenue to outcomes and documentation; as of 2024 CMS ACOs cover >12 million beneficiaries and bundled-payment pilots reported 5–10% episode cost reductions. Accurate risk adjustment and HCC capture act as economic levers—better capture can raise risk-adjusted revenue by up to ~10–15% per patient. Accordant can align CDI with quality and utilization metrics to support both fee-for-service and risk-based streams.
- Revenue tied to outcomes: >12M ACO beneficiaries (2024)
- Episode savings: 5–10% in bundled pilots
- HCC capture: potential +10–15% risk-adjusted revenue
≈50% Medicare/Medicaid revenue prompts RCM & HIM investment
Rising labor, supply and drug costs pushed many U.S. hospitals to median negative operating margins in 2023 while revenue leakage (3–5% of gross rev) stresses cash; Accordant’s RCM/denial programs recapture net revenue with rapid payback. Public payers now ~50% of mix and patient deductibles (~$1,760 in 2023) raise bad debt; Accordant strengthens financial engagement and eligibility. Higher rates (Fed 5.25–5.50% Jul 2025) force phased, ROI-driven deployments and shared-savings models.
| Metric | Value | Impact |
|---|---|---|
| Revenue leakage | 3–5% | Cash pressure |
| Public payer mix | ~50% | Lower yields |
| Avg deductible | $1,760 (2023) | Higher patient liability |
| Fed funds | 5.25–5.50% (Jul 2025) | Capex scrutiny |
| ACO reach | >12M (2024) | Risk-based revenue |
Preview Before You Purchase
Accordant PESTLE Analysis
The preview shown here is the exact Accordant PESTLE Analysis you’ll receive after purchase—fully formatted, professionally structured, and ready to use. No placeholders or teasers: the content, layout, and insights visible now are the final document you’ll download instantly after payment. This is the real product, delivered exactly as shown.

Your Shortcut to Market Insight Starts Here
Discover how political shifts, economic cycles, and tech disruption are shaping Accordant’s strategic path in our concise PESTLE snapshot. This analysis highlights risks and opportunity levers investors and strategists need to act on today. Ready-made and research-backed, the full PESTLE delivers detailed, actionable insights—purchase now to access the complete report.
Political factors
Shifting federal reimbursement policy
Medicare and Medicaid account for roughly 50% of U.S. hospital revenue, so annual CMS rulemaking—altering DRG payments, quality programs, and telehealth coverage—directly shifts demand for revenue cycle optimization. Accordant must monitor IPPS/OPPS rule changes and recalibrate clients’ coding, documentation, and billing workflows in real time. Proactive policy monitoring is a marketable differentiator in advisory engagements.
Election cycles and healthcare priorities
Administrative changes can redirect funding, enforcement intensity, and incentives across value-based care and price transparency, affecting markets where Medicare enrollment reached about 66 million beneficiaries in 2024 and HHS targets 50% value-based payments by 2030. Policy volatility can shift client budgets and timing for consulting projects as enforcement (CMS price-transparency fines up to $2 million) changes. Accordant should scenario-plan for swings that impact revenue capture and compliance. Thought leadership can position clients for multi-year transitions.
State-level Medicaid and regulatory diversity
State Medicaid expansion varies—as of July 2025 forty states plus DC have expanded eligibility—while Medicaid managed care covers roughly 80% of enrollees nationally, and state HIE and interoperability policies differ widely. Multi-state health systems therefore need localized documentation and billing compliance. Accordant can tailor state-specific playbooks for prior auth, coverage rules, and audit defense. Local policy intelligence shortens time-to-ROI by reducing denials and accelerating reimbursements.
Government price transparency and competition
Government price-transparency rules (CMS rule effective Jan 1, 2021) pressure margins and expose pricing strategies; commercial rates commonly run 2–3x Medicare and CMS may levy civil monetary penalties up to $300/day for noncompliance. Increased scrutiny drives revenue integrity and CDI to justify charges; Accordant can align documentation to clinical severity and support fair pricing narratives amid consolidation pressures.
- CMS rule effective 2021
- Commercial rates ~2–3x Medicare
- Penalties up to $300/day
- Consolidation raises integration need
Public health preparedness funding
Policy emphasis on preparedness, backed by CDC PHEP funding near $700 million annually, drives hospitals to invest in data, analytics, and reporting to meet requirements; federal grants and DMI-era allocations (roughly $1 billion directed to data modernization efforts) subsidize HIM upgrades and interoperability projects. Accordant helps map preparedness metrics to documentation standards, linking compliance to operational resilience and reimbursement pathways.
- Preparedness funding: CDC PHEP ≈ $700M
- Data modernization: ≈ $1B in federal allocations
- Impact: grants finance HIM/interoperability
- Accordant role: map metrics to documentation for compliance + reimbursement
≈50% Medicare/Medicaid revenue prompts RCM & HIM investment
Medicare/Medicaid ≈50% of hospital revenue; 66M Medicare beneficiaries (2024) shift demand for revenue-cycle optimization. As of July 2025, 40 states+DC expanded Medicaid; state rules require localized billing playbooks. Price-transparency enforcement (penalties ≈$300/day; CMS fines up to $2M) and preparedness/data funding drive investment in HIM and interoperability.
| Metric | Value | Impact |
|---|---|---|
| Medicare/Medicaid share | ≈50% | Revenue sensitivity |
| Medicare beneficiaries | 66M (2024) | Demand for optimization |
| Medicaid expansion | 40 states + DC (Jul 2025) | Local compliance |
| Price-transparency penalty | ≈$300/day | Compliance spend |
| CMS fines | Up to $2M | Risk exposure |
| CDC PHEP | ≈$700M | Preparedness funding |
| Data modernization | ≈$1B | HIM/interoperability investment |
What is included in the product
Detailed Word Document
Explores how external macro-environmental factors uniquely affect the Accordant across Political, Economic, Social, Technological, Environmental, and Legal dimensions, with each category expanded into detailed, business-specific sub-points. Every section is backed by current data and forward-looking insights to support executives, consultants, and entrepreneurs in scenario planning, risk mitigation, and opportunity identification.
Customizable Excel Spreadsheet
A compact, editable PESTLE snapshot organized by category for quick sharing in meetings, presentations, or client reports—uses plain language and visual segmentation to speed alignment and decision-making.
Economic factors
Margin pressure and cost containment
Rising labor, supply and drug costs have pushed many U.S. hospitals into negative operating margins (median negative in 2023), while revenue cycle leakage—commonly 3–5% of gross revenue—now threatens cash flow. Accordant’s RCM optimization and denial-prevention programs deliver rapid payback by recapturing net revenue. Business cases tied to projected net revenue lift and ROI drive faster approvals.
Payer mix shifts and bad debt risk
Shifts toward public payers—now roughly half of the U.S. payer mix—compress yields versus commercial rates while patient responsibility has climbed (average single-plan deductible ~$1,760 in 2023). Economic slowdowns drive higher uncompensated care and tougher collections; Accordant builds patient financial engagement and propensity-to-pay pathways, plus enhanced eligibility and documentation workflows to help stabilize cash and reduce bad debt.
Consolidation and integration waves
Waves of M&A, joint ventures and physician practice acquisitions have pushed over 50% of US physicians into system employment, creating highly fragmented RCM and HIM stacks. Integration demands standardized policies, coding and KPIs across sites; Accordant can lead PMOs to harmonize EHR workflows and charge capture. Realizing synergies—often a mid-single-digit to low-double-digit percent revenue improvement—depends on disciplined CDI and revenue integrity.
Capital constraints and ROI scrutiny
Higher interest rates (Federal funds target 5.25–5.50% as of July 2025) and tighter corporate balance sheets delay large IT purchases, forcing ROI scrutiny and prioritization of near-term paybacks. Consulting engagements must demonstrate quick wins and staged benefits; Accordant can adopt phased delivery with shared-savings or value-based pricing to de-risk buys. Benchmarking and dashboards validate financial impact and support renewal decisions.
- Phased delivery: reduces upfront capex
- Shared-savings: aligns incentives
- Dashboards: prove ROI monthly/quarterly
Value-based payment and risk contracts
Shift to bundled payments and ACO models ties revenue to outcomes and documentation; as of 2024 CMS ACOs cover >12 million beneficiaries and bundled-payment pilots reported 5–10% episode cost reductions. Accurate risk adjustment and HCC capture act as economic levers—better capture can raise risk-adjusted revenue by up to ~10–15% per patient. Accordant can align CDI with quality and utilization metrics to support both fee-for-service and risk-based streams.
- Revenue tied to outcomes: >12M ACO beneficiaries (2024)
- Episode savings: 5–10% in bundled pilots
- HCC capture: potential +10–15% risk-adjusted revenue
≈50% Medicare/Medicaid revenue prompts RCM & HIM investment
Rising labor, supply and drug costs pushed many U.S. hospitals to median negative operating margins in 2023 while revenue leakage (3–5% of gross rev) stresses cash; Accordant’s RCM/denial programs recapture net revenue with rapid payback. Public payers now ~50% of mix and patient deductibles (~$1,760 in 2023) raise bad debt; Accordant strengthens financial engagement and eligibility. Higher rates (Fed 5.25–5.50% Jul 2025) force phased, ROI-driven deployments and shared-savings models.
| Metric | Value | Impact |
|---|---|---|
| Revenue leakage | 3–5% | Cash pressure |
| Public payer mix | ~50% | Lower yields |
| Avg deductible | $1,760 (2023) | Higher patient liability |
| Fed funds | 5.25–5.50% (Jul 2025) | Capex scrutiny |
| ACO reach | >12M (2024) | Risk-based revenue |
Preview Before You Purchase
Accordant PESTLE Analysis
The preview shown here is the exact Accordant PESTLE Analysis you’ll receive after purchase—fully formatted, professionally structured, and ready to use. No placeholders or teasers: the content, layout, and insights visible now are the final document you’ll download instantly after payment. This is the real product, delivered exactly as shown.
Original: $10.00
-65%$10.00
$3.50Description
Your Shortcut to Market Insight Starts Here
Discover how political shifts, economic cycles, and tech disruption are shaping Accordant’s strategic path in our concise PESTLE snapshot. This analysis highlights risks and opportunity levers investors and strategists need to act on today. Ready-made and research-backed, the full PESTLE delivers detailed, actionable insights—purchase now to access the complete report.
Political factors
Shifting federal reimbursement policy
Medicare and Medicaid account for roughly 50% of U.S. hospital revenue, so annual CMS rulemaking—altering DRG payments, quality programs, and telehealth coverage—directly shifts demand for revenue cycle optimization. Accordant must monitor IPPS/OPPS rule changes and recalibrate clients’ coding, documentation, and billing workflows in real time. Proactive policy monitoring is a marketable differentiator in advisory engagements.
Election cycles and healthcare priorities
Administrative changes can redirect funding, enforcement intensity, and incentives across value-based care and price transparency, affecting markets where Medicare enrollment reached about 66 million beneficiaries in 2024 and HHS targets 50% value-based payments by 2030. Policy volatility can shift client budgets and timing for consulting projects as enforcement (CMS price-transparency fines up to $2 million) changes. Accordant should scenario-plan for swings that impact revenue capture and compliance. Thought leadership can position clients for multi-year transitions.
State-level Medicaid and regulatory diversity
State Medicaid expansion varies—as of July 2025 forty states plus DC have expanded eligibility—while Medicaid managed care covers roughly 80% of enrollees nationally, and state HIE and interoperability policies differ widely. Multi-state health systems therefore need localized documentation and billing compliance. Accordant can tailor state-specific playbooks for prior auth, coverage rules, and audit defense. Local policy intelligence shortens time-to-ROI by reducing denials and accelerating reimbursements.
Government price transparency and competition
Government price-transparency rules (CMS rule effective Jan 1, 2021) pressure margins and expose pricing strategies; commercial rates commonly run 2–3x Medicare and CMS may levy civil monetary penalties up to $300/day for noncompliance. Increased scrutiny drives revenue integrity and CDI to justify charges; Accordant can align documentation to clinical severity and support fair pricing narratives amid consolidation pressures.
- CMS rule effective 2021
- Commercial rates ~2–3x Medicare
- Penalties up to $300/day
- Consolidation raises integration need
Public health preparedness funding
Policy emphasis on preparedness, backed by CDC PHEP funding near $700 million annually, drives hospitals to invest in data, analytics, and reporting to meet requirements; federal grants and DMI-era allocations (roughly $1 billion directed to data modernization efforts) subsidize HIM upgrades and interoperability projects. Accordant helps map preparedness metrics to documentation standards, linking compliance to operational resilience and reimbursement pathways.
- Preparedness funding: CDC PHEP ≈ $700M
- Data modernization: ≈ $1B in federal allocations
- Impact: grants finance HIM/interoperability
- Accordant role: map metrics to documentation for compliance + reimbursement
≈50% Medicare/Medicaid revenue prompts RCM & HIM investment
Medicare/Medicaid ≈50% of hospital revenue; 66M Medicare beneficiaries (2024) shift demand for revenue-cycle optimization. As of July 2025, 40 states+DC expanded Medicaid; state rules require localized billing playbooks. Price-transparency enforcement (penalties ≈$300/day; CMS fines up to $2M) and preparedness/data funding drive investment in HIM and interoperability.
| Metric | Value | Impact |
|---|---|---|
| Medicare/Medicaid share | ≈50% | Revenue sensitivity |
| Medicare beneficiaries | 66M (2024) | Demand for optimization |
| Medicaid expansion | 40 states + DC (Jul 2025) | Local compliance |
| Price-transparency penalty | ≈$300/day | Compliance spend |
| CMS fines | Up to $2M | Risk exposure |
| CDC PHEP | ≈$700M | Preparedness funding |
| Data modernization | ≈$1B | HIM/interoperability investment |
What is included in the product
Detailed Word Document
Explores how external macro-environmental factors uniquely affect the Accordant across Political, Economic, Social, Technological, Environmental, and Legal dimensions, with each category expanded into detailed, business-specific sub-points. Every section is backed by current data and forward-looking insights to support executives, consultants, and entrepreneurs in scenario planning, risk mitigation, and opportunity identification.
Customizable Excel Spreadsheet
A compact, editable PESTLE snapshot organized by category for quick sharing in meetings, presentations, or client reports—uses plain language and visual segmentation to speed alignment and decision-making.
Economic factors
Margin pressure and cost containment
Rising labor, supply and drug costs have pushed many U.S. hospitals into negative operating margins (median negative in 2023), while revenue cycle leakage—commonly 3–5% of gross revenue—now threatens cash flow. Accordant’s RCM optimization and denial-prevention programs deliver rapid payback by recapturing net revenue. Business cases tied to projected net revenue lift and ROI drive faster approvals.
Payer mix shifts and bad debt risk
Shifts toward public payers—now roughly half of the U.S. payer mix—compress yields versus commercial rates while patient responsibility has climbed (average single-plan deductible ~$1,760 in 2023). Economic slowdowns drive higher uncompensated care and tougher collections; Accordant builds patient financial engagement and propensity-to-pay pathways, plus enhanced eligibility and documentation workflows to help stabilize cash and reduce bad debt.
Consolidation and integration waves
Waves of M&A, joint ventures and physician practice acquisitions have pushed over 50% of US physicians into system employment, creating highly fragmented RCM and HIM stacks. Integration demands standardized policies, coding and KPIs across sites; Accordant can lead PMOs to harmonize EHR workflows and charge capture. Realizing synergies—often a mid-single-digit to low-double-digit percent revenue improvement—depends on disciplined CDI and revenue integrity.
Capital constraints and ROI scrutiny
Higher interest rates (Federal funds target 5.25–5.50% as of July 2025) and tighter corporate balance sheets delay large IT purchases, forcing ROI scrutiny and prioritization of near-term paybacks. Consulting engagements must demonstrate quick wins and staged benefits; Accordant can adopt phased delivery with shared-savings or value-based pricing to de-risk buys. Benchmarking and dashboards validate financial impact and support renewal decisions.
- Phased delivery: reduces upfront capex
- Shared-savings: aligns incentives
- Dashboards: prove ROI monthly/quarterly
Value-based payment and risk contracts
Shift to bundled payments and ACO models ties revenue to outcomes and documentation; as of 2024 CMS ACOs cover >12 million beneficiaries and bundled-payment pilots reported 5–10% episode cost reductions. Accurate risk adjustment and HCC capture act as economic levers—better capture can raise risk-adjusted revenue by up to ~10–15% per patient. Accordant can align CDI with quality and utilization metrics to support both fee-for-service and risk-based streams.
- Revenue tied to outcomes: >12M ACO beneficiaries (2024)
- Episode savings: 5–10% in bundled pilots
- HCC capture: potential +10–15% risk-adjusted revenue
≈50% Medicare/Medicaid revenue prompts RCM & HIM investment
Rising labor, supply and drug costs pushed many U.S. hospitals to median negative operating margins in 2023 while revenue leakage (3–5% of gross rev) stresses cash; Accordant’s RCM/denial programs recapture net revenue with rapid payback. Public payers now ~50% of mix and patient deductibles (~$1,760 in 2023) raise bad debt; Accordant strengthens financial engagement and eligibility. Higher rates (Fed 5.25–5.50% Jul 2025) force phased, ROI-driven deployments and shared-savings models.
| Metric | Value | Impact |
|---|---|---|
| Revenue leakage | 3–5% | Cash pressure |
| Public payer mix | ~50% | Lower yields |
| Avg deductible | $1,760 (2023) | Higher patient liability |
| Fed funds | 5.25–5.50% (Jul 2025) | Capex scrutiny |
| ACO reach | >12M (2024) | Risk-based revenue |
Preview Before You Purchase
Accordant PESTLE Analysis
The preview shown here is the exact Accordant PESTLE Analysis you’ll receive after purchase—fully formatted, professionally structured, and ready to use. No placeholders or teasers: the content, layout, and insights visible now are the final document you’ll download instantly after payment. This is the real product, delivered exactly as shown.











