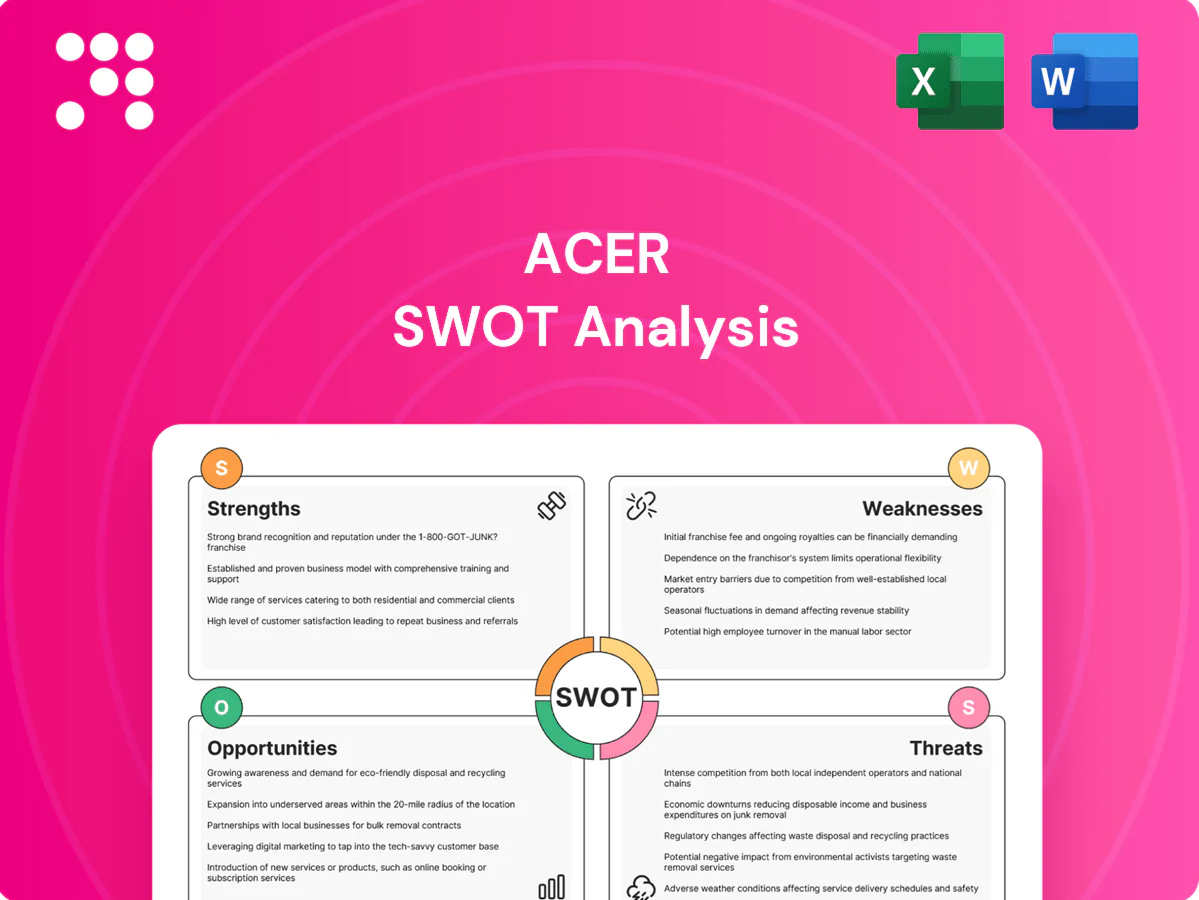
Acer SWOT Analysis

Go Beyond the Preview—Access the Full Strategic Report
Acer's SWOT analysis highlights its global brand reach, strong supply chain capabilities, and challenges from thin margins and intense PC competition. It identifies growth opportunities in gaming, cloud services, and emerging markets while flagging risks like component shortages and shifting consumer trends. Purchase the full SWOT analysis to get a detailed, editable report and Excel matrix—ideal for investors, strategists, and advisors.
Strengths

Diversified hardware portfolio
Covering PCs, tablets, servers, displays and peripherals spreads Acer’s revenue across categories and reduces dependence on a single product cycle. This portfolio allows cross-selling and bundled solutions for enterprise and consumer clients, strengthening average deal value. Being a top-5 global PC vendor in 2024 (IDC) illustrates scale that supports resilience against segment-specific downturns.
Global brand and distribution
Acer maintains broad retail and e-commerce reach across regions, operating in over 160 countries which supports rapid distribution. Strong channel partnerships accelerate market entry and product availability across offline and online retailers. Brand recognition in the value-to-mid segments sustains unit volumes, while scale efficiencies lower procurement and logistics costs, enhancing margin resilience.

Cost-competitive manufacturing
Lean supply-chain management and long-standing ODM partnerships keep Acer's unit costs low, enabling aggressive pricing across competitive PC segments.
These efficiencies preserve margins in commoditized categories, allowing Acer to sustain profitability despite price pressure.
Disciplined cost control supports frequent product refresh cycles without significant price hikes, reinforcing market responsiveness and value positioning.

Innovation in niche segments
Acer’s focused innovation in gaming (Predator), creator PCs (ConceptD/ProCreator) and rugged Enduro devices differentiates its portfolio, enabling feature-rich SKUs that attract enthusiasts and professionals. These specialized models carry higher ASPs and margins versus mainstream notebooks, fostering loyalty through performance and design while insulating Acer from pure price-led competition.
- Predator/ConceptD/Enduro focus
- Higher ASPs and margins
- Enthusiast loyalty via features
- Shield vs price competition
Ecosystem and services extensions
Acer leverages adjacencies—VR devices, e-business solutions and utilities—to boost product stickiness; the global AR/VR market reached about $37 billion in 2024, creating addressable demand for hardware-plus-services. Services and integrated support create recurring revenue and higher customer lifetime value, smoothing the cyclical PC hardware dips seen in recent years.
- VR/AR market ~37B (2024)
- Services = recurring revenue, higher CLV
- Ecosystem mitigates hardware seasonality
- Adjacencies increase customer stickiness
Diversified PC portfolio, top-5 scale and 160+ country reach fuel margin resilience
Diversified portfolio across PCs, displays and peripherals reduces single-cycle risk and enables cross-selling; top-5 global PC vendor in 2024 (IDC) evidences scale. Global reach in 160+ countries and strong channel partnerships support volume and margin resilience. Lean supply chain and ODM ties enable competitive pricing while niche Predator/ConceptD/Enduro lines lift ASPs and loyalty.
| Metric | Value |
|---|---|
| Global PC rank (IDC 2024) | Top-5 |
| Market presence | 160+ countries |
| AR/VR market (2024) | $37B |
What is included in the product
 Detailed Word Document
Delivers a strategic overview of Acer’s internal and external business factors, outlining strengths, weaknesses, opportunities and threats that shape its competitive position and future growth prospects.

 Customizable Excel Spreadsheet
Provides a concise, editable Acer SWOT matrix for fast strategic alignment and decision-making, easing stakeholder presentations and allowing quick updates to reflect shifting market priorities.
Weaknesses

High exposure to PC cycles
Acer still derives the majority of its revenue from PC products, leaving core revenues tied to global PC demand; Acer held roughly 6%–7% of global PC market share in 2023 per IDC. Market saturation and longer refresh cycles have pressured growth as global shipments fell year-over-year, compressing volumes and margins during downturns. Diversification into cloud, IoT and services remains a work-in-progress.
Thin margins in commoditized tiers
Intense price competition caps profitability in Acer's entry and mid-range devices, reflected in a FY2024 gross margin near 7% as the company noted pressure on low-end ASPs. Feature parity across OEMs erodes differentiation, forcing promotional pricing. Currency swings and component cost volatility further squeeze margins, making sustained expansion difficult without a meaningful shift toward premium mix.

Limited premium brand perception
Compared with top-tier rivals, Acer's premium brand equity is weaker, reflected in its roughly 6–7% global PC market share in 2024 (IDC), trailing Apple and Lenovo; this constrains pricing power in flagship categories. Weaker brand status forces higher marketing spend per unit to justify elevated ASPs, while attempts to stretch into high-end segments often meet consumer resistance and slower uptake.

Supply chain vulnerability
Acer’s reliance on global components and ODM partners increases exposure to supply disruptions, with geopolitics and logistics bottlenecks often delaying shipments and raising sourcing costs. Fixed-price OEM contracts limit rapid cost pass-through, squeezing margins when component prices spike. Volatile lead times complicate production planning and inventory management across product lines.
- Dependency on ODMs
- Geopolitical/logistics risk
- Fixed-price margin pressure
- Lead-time volatility
Fragmented product focus
Fragmented product focus dilutes R&D and marketing, spreading investments thin across laptops, desktops, monitors, and peripherals and risking weaker innovation in core segments. Managing a large SKU base raises supply-chain and inventory complexity, increasing costs and lead times. Overlapping offerings can confuse buyers and slow execution on higher-margin growth areas.
PC-focused vendor with 6-7% share faces ~7% margin squeeze
Acer remains PC‑centric with ~6–7% global market share (IDC 2024) and FY2024 gross margin near 7%, exposing revenue to weak PC demand and longer refresh cycles. Intense low‑end price competition and weak premium brand equity limit ASPs and margin expansion. Heavy ODM reliance and supply volatility raise costs and complicate inventory across a fragmented, high‑SKU portfolio.
| Metric | Value |
|---|---|
| Global PC share (2024) | 6–7% (IDC) |
| FY2024 gross margin | ~7% |
| SKU breadth | High — multi categories |
| ODM dependence | Significant |
Full Version Awaits
Acer SWOT Analysis
This is the actual SWOT analysis document you’ll receive upon purchase—no surprises, just professional quality. The preview below is taken directly from the full SWOT report you'll get; purchase unlocks the entire in-depth version. The file shown is the real, editable analysis ready to download after payment.

Go Beyond the Preview—Access the Full Strategic Report
Acer's SWOT analysis highlights its global brand reach, strong supply chain capabilities, and challenges from thin margins and intense PC competition. It identifies growth opportunities in gaming, cloud services, and emerging markets while flagging risks like component shortages and shifting consumer trends. Purchase the full SWOT analysis to get a detailed, editable report and Excel matrix—ideal for investors, strategists, and advisors.
Strengths
Diversified hardware portfolio
Covering PCs, tablets, servers, displays and peripherals spreads Acer’s revenue across categories and reduces dependence on a single product cycle. This portfolio allows cross-selling and bundled solutions for enterprise and consumer clients, strengthening average deal value. Being a top-5 global PC vendor in 2024 (IDC) illustrates scale that supports resilience against segment-specific downturns.
Global brand and distribution
Acer maintains broad retail and e-commerce reach across regions, operating in over 160 countries which supports rapid distribution. Strong channel partnerships accelerate market entry and product availability across offline and online retailers. Brand recognition in the value-to-mid segments sustains unit volumes, while scale efficiencies lower procurement and logistics costs, enhancing margin resilience.
Cost-competitive manufacturing
Lean supply-chain management and long-standing ODM partnerships keep Acer's unit costs low, enabling aggressive pricing across competitive PC segments.
These efficiencies preserve margins in commoditized categories, allowing Acer to sustain profitability despite price pressure.
Disciplined cost control supports frequent product refresh cycles without significant price hikes, reinforcing market responsiveness and value positioning.
Innovation in niche segments
Acer’s focused innovation in gaming (Predator), creator PCs (ConceptD/ProCreator) and rugged Enduro devices differentiates its portfolio, enabling feature-rich SKUs that attract enthusiasts and professionals. These specialized models carry higher ASPs and margins versus mainstream notebooks, fostering loyalty through performance and design while insulating Acer from pure price-led competition.
- Predator/ConceptD/Enduro focus
- Higher ASPs and margins
- Enthusiast loyalty via features
- Shield vs price competition
Ecosystem and services extensions
Acer leverages adjacencies—VR devices, e-business solutions and utilities—to boost product stickiness; the global AR/VR market reached about $37 billion in 2024, creating addressable demand for hardware-plus-services. Services and integrated support create recurring revenue and higher customer lifetime value, smoothing the cyclical PC hardware dips seen in recent years.
- VR/AR market ~37B (2024)
- Services = recurring revenue, higher CLV
- Ecosystem mitigates hardware seasonality
- Adjacencies increase customer stickiness
Diversified PC portfolio, top-5 scale and 160+ country reach fuel margin resilience
Diversified portfolio across PCs, displays and peripherals reduces single-cycle risk and enables cross-selling; top-5 global PC vendor in 2024 (IDC) evidences scale. Global reach in 160+ countries and strong channel partnerships support volume and margin resilience. Lean supply chain and ODM ties enable competitive pricing while niche Predator/ConceptD/Enduro lines lift ASPs and loyalty.
| Metric | Value |
|---|---|
| Global PC rank (IDC 2024) | Top-5 |
| Market presence | 160+ countries |
| AR/VR market (2024) | $37B |
What is included in the product
Detailed Word Document
Delivers a strategic overview of Acer’s internal and external business factors, outlining strengths, weaknesses, opportunities and threats that shape its competitive position and future growth prospects.
Customizable Excel Spreadsheet
Provides a concise, editable Acer SWOT matrix for fast strategic alignment and decision-making, easing stakeholder presentations and allowing quick updates to reflect shifting market priorities.
Weaknesses
High exposure to PC cycles
Acer still derives the majority of its revenue from PC products, leaving core revenues tied to global PC demand; Acer held roughly 6%–7% of global PC market share in 2023 per IDC. Market saturation and longer refresh cycles have pressured growth as global shipments fell year-over-year, compressing volumes and margins during downturns. Diversification into cloud, IoT and services remains a work-in-progress.
Thin margins in commoditized tiers
Intense price competition caps profitability in Acer's entry and mid-range devices, reflected in a FY2024 gross margin near 7% as the company noted pressure on low-end ASPs. Feature parity across OEMs erodes differentiation, forcing promotional pricing. Currency swings and component cost volatility further squeeze margins, making sustained expansion difficult without a meaningful shift toward premium mix.
Limited premium brand perception
Compared with top-tier rivals, Acer's premium brand equity is weaker, reflected in its roughly 6–7% global PC market share in 2024 (IDC), trailing Apple and Lenovo; this constrains pricing power in flagship categories. Weaker brand status forces higher marketing spend per unit to justify elevated ASPs, while attempts to stretch into high-end segments often meet consumer resistance and slower uptake.
Supply chain vulnerability
Acer’s reliance on global components and ODM partners increases exposure to supply disruptions, with geopolitics and logistics bottlenecks often delaying shipments and raising sourcing costs. Fixed-price OEM contracts limit rapid cost pass-through, squeezing margins when component prices spike. Volatile lead times complicate production planning and inventory management across product lines.
- Dependency on ODMs
- Geopolitical/logistics risk
- Fixed-price margin pressure
- Lead-time volatility
Fragmented product focus
Fragmented product focus dilutes R&D and marketing, spreading investments thin across laptops, desktops, monitors, and peripherals and risking weaker innovation in core segments. Managing a large SKU base raises supply-chain and inventory complexity, increasing costs and lead times. Overlapping offerings can confuse buyers and slow execution on higher-margin growth areas.
PC-focused vendor with 6-7% share faces ~7% margin squeeze
Acer remains PC‑centric with ~6–7% global market share (IDC 2024) and FY2024 gross margin near 7%, exposing revenue to weak PC demand and longer refresh cycles. Intense low‑end price competition and weak premium brand equity limit ASPs and margin expansion. Heavy ODM reliance and supply volatility raise costs and complicate inventory across a fragmented, high‑SKU portfolio.
| Metric | Value |
|---|---|
| Global PC share (2024) | 6–7% (IDC) |
| FY2024 gross margin | ~7% |
| SKU breadth | High — multi categories |
| ODM dependence | Significant |
Full Version Awaits
Acer SWOT Analysis
This is the actual SWOT analysis document you’ll receive upon purchase—no surprises, just professional quality. The preview below is taken directly from the full SWOT report you'll get; purchase unlocks the entire in-depth version. The file shown is the real, editable analysis ready to download after payment.
Description
Go Beyond the Preview—Access the Full Strategic Report
Acer's SWOT analysis highlights its global brand reach, strong supply chain capabilities, and challenges from thin margins and intense PC competition. It identifies growth opportunities in gaming, cloud services, and emerging markets while flagging risks like component shortages and shifting consumer trends. Purchase the full SWOT analysis to get a detailed, editable report and Excel matrix—ideal for investors, strategists, and advisors.
Strengths
Diversified hardware portfolio
Covering PCs, tablets, servers, displays and peripherals spreads Acer’s revenue across categories and reduces dependence on a single product cycle. This portfolio allows cross-selling and bundled solutions for enterprise and consumer clients, strengthening average deal value. Being a top-5 global PC vendor in 2024 (IDC) illustrates scale that supports resilience against segment-specific downturns.
Global brand and distribution
Acer maintains broad retail and e-commerce reach across regions, operating in over 160 countries which supports rapid distribution. Strong channel partnerships accelerate market entry and product availability across offline and online retailers. Brand recognition in the value-to-mid segments sustains unit volumes, while scale efficiencies lower procurement and logistics costs, enhancing margin resilience.
Cost-competitive manufacturing
Lean supply-chain management and long-standing ODM partnerships keep Acer's unit costs low, enabling aggressive pricing across competitive PC segments.
These efficiencies preserve margins in commoditized categories, allowing Acer to sustain profitability despite price pressure.
Disciplined cost control supports frequent product refresh cycles without significant price hikes, reinforcing market responsiveness and value positioning.
Innovation in niche segments
Acer’s focused innovation in gaming (Predator), creator PCs (ConceptD/ProCreator) and rugged Enduro devices differentiates its portfolio, enabling feature-rich SKUs that attract enthusiasts and professionals. These specialized models carry higher ASPs and margins versus mainstream notebooks, fostering loyalty through performance and design while insulating Acer from pure price-led competition.
- Predator/ConceptD/Enduro focus
- Higher ASPs and margins
- Enthusiast loyalty via features
- Shield vs price competition
Ecosystem and services extensions
Acer leverages adjacencies—VR devices, e-business solutions and utilities—to boost product stickiness; the global AR/VR market reached about $37 billion in 2024, creating addressable demand for hardware-plus-services. Services and integrated support create recurring revenue and higher customer lifetime value, smoothing the cyclical PC hardware dips seen in recent years.
- VR/AR market ~37B (2024)
- Services = recurring revenue, higher CLV
- Ecosystem mitigates hardware seasonality
- Adjacencies increase customer stickiness
Diversified PC portfolio, top-5 scale and 160+ country reach fuel margin resilience
Diversified portfolio across PCs, displays and peripherals reduces single-cycle risk and enables cross-selling; top-5 global PC vendor in 2024 (IDC) evidences scale. Global reach in 160+ countries and strong channel partnerships support volume and margin resilience. Lean supply chain and ODM ties enable competitive pricing while niche Predator/ConceptD/Enduro lines lift ASPs and loyalty.
| Metric | Value |
|---|---|
| Global PC rank (IDC 2024) | Top-5 |
| Market presence | 160+ countries |
| AR/VR market (2024) | $37B |
What is included in the product
Detailed Word Document
Delivers a strategic overview of Acer’s internal and external business factors, outlining strengths, weaknesses, opportunities and threats that shape its competitive position and future growth prospects.
Customizable Excel Spreadsheet
Provides a concise, editable Acer SWOT matrix for fast strategic alignment and decision-making, easing stakeholder presentations and allowing quick updates to reflect shifting market priorities.
Weaknesses
High exposure to PC cycles
Acer still derives the majority of its revenue from PC products, leaving core revenues tied to global PC demand; Acer held roughly 6%–7% of global PC market share in 2023 per IDC. Market saturation and longer refresh cycles have pressured growth as global shipments fell year-over-year, compressing volumes and margins during downturns. Diversification into cloud, IoT and services remains a work-in-progress.
Thin margins in commoditized tiers
Intense price competition caps profitability in Acer's entry and mid-range devices, reflected in a FY2024 gross margin near 7% as the company noted pressure on low-end ASPs. Feature parity across OEMs erodes differentiation, forcing promotional pricing. Currency swings and component cost volatility further squeeze margins, making sustained expansion difficult without a meaningful shift toward premium mix.
Limited premium brand perception
Compared with top-tier rivals, Acer's premium brand equity is weaker, reflected in its roughly 6–7% global PC market share in 2024 (IDC), trailing Apple and Lenovo; this constrains pricing power in flagship categories. Weaker brand status forces higher marketing spend per unit to justify elevated ASPs, while attempts to stretch into high-end segments often meet consumer resistance and slower uptake.
Supply chain vulnerability
Acer’s reliance on global components and ODM partners increases exposure to supply disruptions, with geopolitics and logistics bottlenecks often delaying shipments and raising sourcing costs. Fixed-price OEM contracts limit rapid cost pass-through, squeezing margins when component prices spike. Volatile lead times complicate production planning and inventory management across product lines.
- Dependency on ODMs
- Geopolitical/logistics risk
- Fixed-price margin pressure
- Lead-time volatility
Fragmented product focus
Fragmented product focus dilutes R&D and marketing, spreading investments thin across laptops, desktops, monitors, and peripherals and risking weaker innovation in core segments. Managing a large SKU base raises supply-chain and inventory complexity, increasing costs and lead times. Overlapping offerings can confuse buyers and slow execution on higher-margin growth areas.
PC-focused vendor with 6-7% share faces ~7% margin squeeze
Acer remains PC‑centric with ~6–7% global market share (IDC 2024) and FY2024 gross margin near 7%, exposing revenue to weak PC demand and longer refresh cycles. Intense low‑end price competition and weak premium brand equity limit ASPs and margin expansion. Heavy ODM reliance and supply volatility raise costs and complicate inventory across a fragmented, high‑SKU portfolio.
| Metric | Value |
|---|---|
| Global PC share (2024) | 6–7% (IDC) |
| FY2024 gross margin | ~7% |
| SKU breadth | High — multi categories |
| ODM dependence | Significant |
Full Version Awaits
Acer SWOT Analysis
This is the actual SWOT analysis document you’ll receive upon purchase—no surprises, just professional quality. The preview below is taken directly from the full SWOT report you'll get; purchase unlocks the entire in-depth version. The file shown is the real, editable analysis ready to download after payment.











