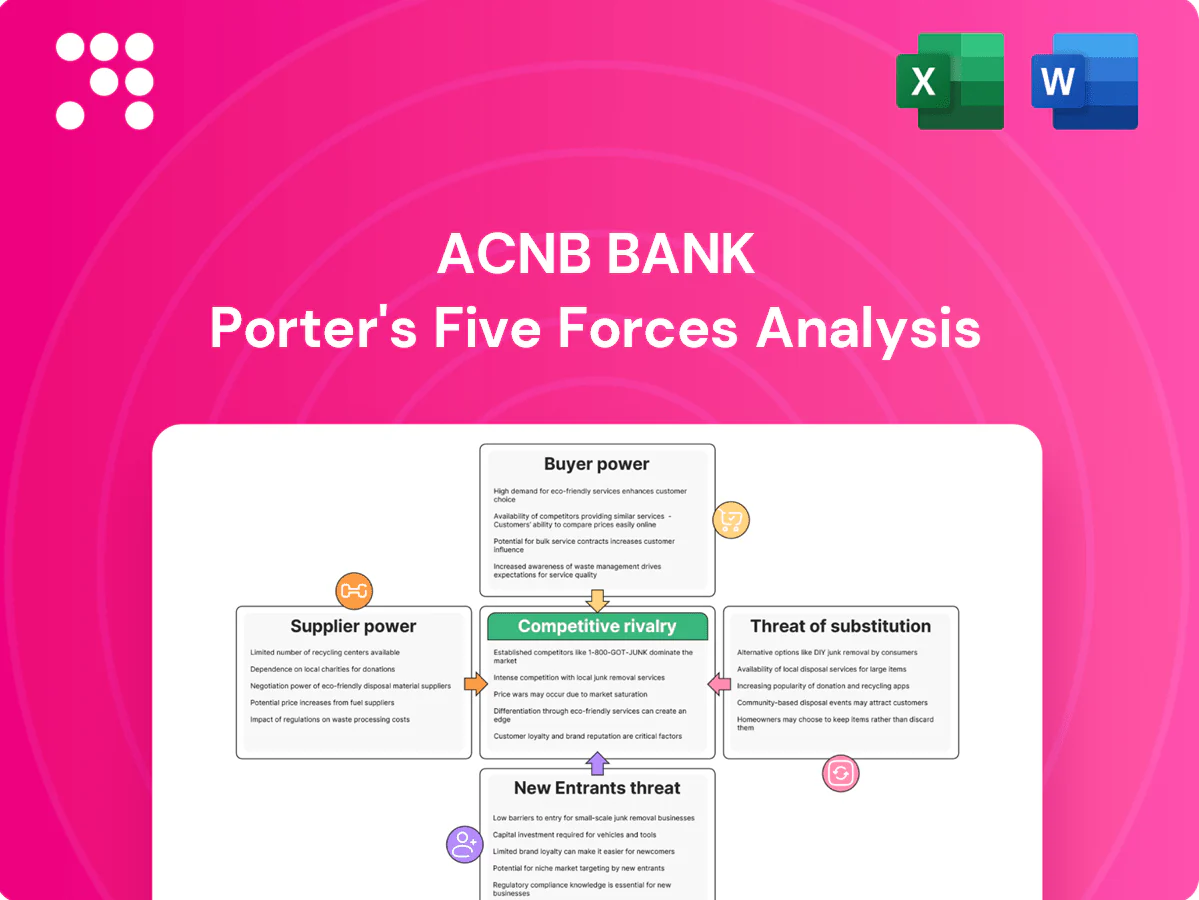
ACNB Bank Porter's Five Forces Analysis

Go Beyond the Preview—Access the Full Strategic Report
ACNB Bank faces a mix of regional strengths and rising digital threats, with moderate buyer power, concentrated suppliers, and barriers shaped by regulation and branch footprint. Competitive intensity is driven by community banks and fintech challengers, while substitutes pressure margins via digital payments. This snapshot hints at strategic levers—capital allocation, tech investment, and partnership play. Unlock the full Porter's Five Forces Analysis to explore ACNB Bank’s competitive dynamics and actionable implications.
Suppliers Bargaining Power

Concentrated core processors
ACNB depends on concentrated core providers such as Fiserv, FIS and Jack Henry, creating significant switching costs and vendor lock-in; these vendors are the dominant core-system suppliers for US banks, limiting alternatives and giving leverage on pricing and contract terms. Complex integrations and regulatory compliance increase dependency, while industry-standard multi-year contracts further entrench supplier power.
Funding from deposits/wholesale
Depositors and wholesale lenders supply ACNB’s primary input—funds; with the federal funds rate around 5.25–5.50% in 2024, depositors pushed into higher-yield products, compressing margins. Increased reliance on FHLB lines and brokered CDs raises funding costs and can introduce covenants that constrain balance-sheet flexibility. A deeper mix of diversified, stable core deposits materially reduces this supplier bargaining power and interest-rate sensitivity.

Specialist third-party services
Specialist third-party services—credit bureaus, appraisal firms, compliance regtech and card networks—hold niche capabilities and pricing power that are largely non-negotiable for a community bank; the Big Three credit bureaus control roughly 90% of US consumer credit data (2024). Visa and Mastercard together process about 80% of card transactions (2024), so their fee schedules and rules directly affect ACNB’s margins. Service disruptions or sudden price hikes can delay lending and card services, while dual-sourcing reduces vendor risk but raises operating costs.

Talent and cybersecurity vendors
- Wage pressure: higher pay vs regional peers
- Talent gap: BLS 32% growth; ISC2 3.4M gap
- Vendor lock-in: MSSCs, tool integration
- Compliance friction: certifications/audits
Cloud and fintech integrations
Cloud hosting and API-led fintech integrations give ACNB rapid digital features but create supplier dependency; in 2024 AWS (32%), Azure (23%) and GCP (12%) dominance concentrates bargaining power and egress fees (commonly $0.02–$0.09/GB) and tiered pricing can be unfavorable at small scale. Vendor due diligence, SLAs and certification needs limit flexibility, while strategic fintech partnerships can offset costs and reduce lock-in risk.
- APIs enable speed but increase reliance
- 2024 cloud share: AWS 32% Azure 23% GCP 12%
- Egress fees ~$0.02–$0.09/GB hurt small banks
- SLAs/due diligence constrain agility
Concentrated suppliers and rising rates tighten margins; dual-sourcing offers limited relief
ACNB faces high supplier power from core-processor lock-in (Fiserv/FIS/Jack Henry), concentrated cloud and card networks, and funding providers; rate pressure (fed funds 5.25–5.50% in 2024) raises deposit costs and reliance on FHLB/brokered funding. Niche vendors (credit bureaus 90% share; Visa/Mastercard ~80%) and scarce talent (BLS 32% growth; ISC2 3.4M gap) limit bargaining leverage. Dual-sourcing and fintech partnerships reduce but do not eliminate supplier risk.
| Supplier | Influence | 2024 Metric |
|---|---|---|
| Core processors | High; switching costs | Concentrated market |
| Card networks | Fee control | ~80% market share |
| Credit bureaus | Data monopoly | ~90% share |
| Cloud | Pricing/egress | AWS 32% Azure 23% GCP 12%; $0.02–$0.09/GB |
| Funding | Margin pressure | Fed funds 5.25–5.50% |
| Talent | Wage pressure | BLS 32% growth; 3.4M gap |
What is included in the product
 Detailed Word Document
Analyzes competitive rivalry, buyer and supplier power, threats from new entrants and substitutes, and industry dynamics shaping ACNB Bank’s pricing and profitability, highlighting disruptive threats and barriers that protect incumbents.

 Customizable Excel Spreadsheet
A concise one-sheet Porter’s Five Forces analysis for ACNB Bank that clarifies competitive pressures and accelerates board-level decisions. Easily customizable pressure levels and radar-chart visuals—ready to drop into decks or Excel dashboards without macros.
Customers Bargaining Power

Rate-sensitive depositors
Consumers and SMBs in South Central PA/MD can easily rate-shop across banks and credit unions, with online tools and promotional CDs pushing price transparency and yields—high-yield offers exceeded 4% in 2024. Higher-beta deposits that reprice quickly raise customer bargaining power and force ACNB to match local promos. Relationship benefits like business banking services lower churn but do not eliminate sensitivity to rates.
Negotiating commercial clients
Larger commercial borrowers can extract lower loan rates, relaxed covenants and fee waivers, often bundling treasury services for discounts; competing proposals from regional banks intensify leverage. ACNB Financial, with roughly $3.7 billion in assets (2023), leans on local decisioning and faster turnaround to partially offset price pressure. Rapid service can preserve margins even when competitors bid aggressively.

Low switching costs digitally
Digital account opening and ACH portability mean over 70% of new retail accounts were opened digitally in 2024, lowering friction to switch and raising customers’ bargaining power.
Bill-pay history and direct deposits impart some stickiness, but industry churn rates near 10–15% show this is not insurmountable.
Fintech UX now sets convenience expectations, so ACNB must match functionality and mobile-first features to retain users.

Wealth/Trust fee sensitivity
Wealth clients compare advisory fees and performance intensively; by 2024 robo-advisor median fees sat near 0.25% while traditional advisor AUM fees averaged about 0.70%, pressuring margins. ETF adoption and fee compression continue to erode pricing power. ACNB can justify higher fees through fiduciary trust services, local advisory relationships and transparent reporting to reduce churn.
- Fee pressure: robo ~0.25% vs advisor ~0.70% (2024)
- Differentiation: fiduciary trust/local advice
- Retention: transparent reporting curbs churn
Community relationship offset
ACNB’s deep local ties, roughly 30 branch locations in its Pennsylvania footprint as of 2024, and relationship banking shift customer focus away from pure price competition; small businesses prize direct banker access and tailored credit solutions, strengthening retention. Community sponsorships and visible presence create measurable goodwill that softens buyer bargaining power across ACNB’s markets.
- Local branches: ~30 (2024)
- Small biz priority: banker access & tailored credit
- Brand equity: sponsorships → reduced price sensitivity
Deposits >4% and 70% digital onboarding squeeze margins
Customers exhibit high bargaining power: rate-sensitive retail deposits (high-yield >4% in 2024), digital switching (70% of new accounts opened digitally in 2024) and churn ~10–15% pressure pricing, while businesses extract concessions by bundling services. ACNB ($3.7B assets, 2023) offsets with 30 branches, local decisioning and fiduciary differentiation.
| Metric | 2024/2023 |
|---|---|
| High-yield offers | >4% |
| Digital new accounts | 70% |
| Churn | 10–15% |
| Wealth fees (median) | robo 0.25% / advisor 0.70% |
| Branches / Assets | ~30 / $3.7B (2023) |
Full Version Awaits
ACNB Bank Porter's Five Forces Analysis
This preview shows the exact Porter’s Five Forces analysis of ACNB Bank you’ll receive after purchase—no placeholders or mockups. The document assesses competitive rivalry, supplier and buyer power, threat of entry and substitution, and strategic implications. It is professionally formatted and ready for immediate download. What you see is the final deliverable.

Go Beyond the Preview—Access the Full Strategic Report
ACNB Bank faces a mix of regional strengths and rising digital threats, with moderate buyer power, concentrated suppliers, and barriers shaped by regulation and branch footprint. Competitive intensity is driven by community banks and fintech challengers, while substitutes pressure margins via digital payments. This snapshot hints at strategic levers—capital allocation, tech investment, and partnership play. Unlock the full Porter's Five Forces Analysis to explore ACNB Bank’s competitive dynamics and actionable implications.
Suppliers Bargaining Power
Concentrated core processors
ACNB depends on concentrated core providers such as Fiserv, FIS and Jack Henry, creating significant switching costs and vendor lock-in; these vendors are the dominant core-system suppliers for US banks, limiting alternatives and giving leverage on pricing and contract terms. Complex integrations and regulatory compliance increase dependency, while industry-standard multi-year contracts further entrench supplier power.
Funding from deposits/wholesale
Depositors and wholesale lenders supply ACNB’s primary input—funds; with the federal funds rate around 5.25–5.50% in 2024, depositors pushed into higher-yield products, compressing margins. Increased reliance on FHLB lines and brokered CDs raises funding costs and can introduce covenants that constrain balance-sheet flexibility. A deeper mix of diversified, stable core deposits materially reduces this supplier bargaining power and interest-rate sensitivity.
Specialist third-party services
Specialist third-party services—credit bureaus, appraisal firms, compliance regtech and card networks—hold niche capabilities and pricing power that are largely non-negotiable for a community bank; the Big Three credit bureaus control roughly 90% of US consumer credit data (2024). Visa and Mastercard together process about 80% of card transactions (2024), so their fee schedules and rules directly affect ACNB’s margins. Service disruptions or sudden price hikes can delay lending and card services, while dual-sourcing reduces vendor risk but raises operating costs.
Talent and cybersecurity vendors
- Wage pressure: higher pay vs regional peers
- Talent gap: BLS 32% growth; ISC2 3.4M gap
- Vendor lock-in: MSSCs, tool integration
- Compliance friction: certifications/audits
Cloud and fintech integrations
Cloud hosting and API-led fintech integrations give ACNB rapid digital features but create supplier dependency; in 2024 AWS (32%), Azure (23%) and GCP (12%) dominance concentrates bargaining power and egress fees (commonly $0.02–$0.09/GB) and tiered pricing can be unfavorable at small scale. Vendor due diligence, SLAs and certification needs limit flexibility, while strategic fintech partnerships can offset costs and reduce lock-in risk.
- APIs enable speed but increase reliance
- 2024 cloud share: AWS 32% Azure 23% GCP 12%
- Egress fees ~$0.02–$0.09/GB hurt small banks
- SLAs/due diligence constrain agility
Concentrated suppliers and rising rates tighten margins; dual-sourcing offers limited relief
ACNB faces high supplier power from core-processor lock-in (Fiserv/FIS/Jack Henry), concentrated cloud and card networks, and funding providers; rate pressure (fed funds 5.25–5.50% in 2024) raises deposit costs and reliance on FHLB/brokered funding. Niche vendors (credit bureaus 90% share; Visa/Mastercard ~80%) and scarce talent (BLS 32% growth; ISC2 3.4M gap) limit bargaining leverage. Dual-sourcing and fintech partnerships reduce but do not eliminate supplier risk.
| Supplier | Influence | 2024 Metric |
|---|---|---|
| Core processors | High; switching costs | Concentrated market |
| Card networks | Fee control | ~80% market share |
| Credit bureaus | Data monopoly | ~90% share |
| Cloud | Pricing/egress | AWS 32% Azure 23% GCP 12%; $0.02–$0.09/GB |
| Funding | Margin pressure | Fed funds 5.25–5.50% |
| Talent | Wage pressure | BLS 32% growth; 3.4M gap |
What is included in the product
Detailed Word Document
Analyzes competitive rivalry, buyer and supplier power, threats from new entrants and substitutes, and industry dynamics shaping ACNB Bank’s pricing and profitability, highlighting disruptive threats and barriers that protect incumbents.
Customizable Excel Spreadsheet
A concise one-sheet Porter’s Five Forces analysis for ACNB Bank that clarifies competitive pressures and accelerates board-level decisions. Easily customizable pressure levels and radar-chart visuals—ready to drop into decks or Excel dashboards without macros.
Customers Bargaining Power
Rate-sensitive depositors
Consumers and SMBs in South Central PA/MD can easily rate-shop across banks and credit unions, with online tools and promotional CDs pushing price transparency and yields—high-yield offers exceeded 4% in 2024. Higher-beta deposits that reprice quickly raise customer bargaining power and force ACNB to match local promos. Relationship benefits like business banking services lower churn but do not eliminate sensitivity to rates.
Negotiating commercial clients
Larger commercial borrowers can extract lower loan rates, relaxed covenants and fee waivers, often bundling treasury services for discounts; competing proposals from regional banks intensify leverage. ACNB Financial, with roughly $3.7 billion in assets (2023), leans on local decisioning and faster turnaround to partially offset price pressure. Rapid service can preserve margins even when competitors bid aggressively.
Low switching costs digitally
Digital account opening and ACH portability mean over 70% of new retail accounts were opened digitally in 2024, lowering friction to switch and raising customers’ bargaining power.
Bill-pay history and direct deposits impart some stickiness, but industry churn rates near 10–15% show this is not insurmountable.
Fintech UX now sets convenience expectations, so ACNB must match functionality and mobile-first features to retain users.
Wealth/Trust fee sensitivity
Wealth clients compare advisory fees and performance intensively; by 2024 robo-advisor median fees sat near 0.25% while traditional advisor AUM fees averaged about 0.70%, pressuring margins. ETF adoption and fee compression continue to erode pricing power. ACNB can justify higher fees through fiduciary trust services, local advisory relationships and transparent reporting to reduce churn.
- Fee pressure: robo ~0.25% vs advisor ~0.70% (2024)
- Differentiation: fiduciary trust/local advice
- Retention: transparent reporting curbs churn
Community relationship offset
ACNB’s deep local ties, roughly 30 branch locations in its Pennsylvania footprint as of 2024, and relationship banking shift customer focus away from pure price competition; small businesses prize direct banker access and tailored credit solutions, strengthening retention. Community sponsorships and visible presence create measurable goodwill that softens buyer bargaining power across ACNB’s markets.
- Local branches: ~30 (2024)
- Small biz priority: banker access & tailored credit
- Brand equity: sponsorships → reduced price sensitivity
Deposits >4% and 70% digital onboarding squeeze margins
Customers exhibit high bargaining power: rate-sensitive retail deposits (high-yield >4% in 2024), digital switching (70% of new accounts opened digitally in 2024) and churn ~10–15% pressure pricing, while businesses extract concessions by bundling services. ACNB ($3.7B assets, 2023) offsets with 30 branches, local decisioning and fiduciary differentiation.
| Metric | 2024/2023 |
|---|---|
| High-yield offers | >4% |
| Digital new accounts | 70% |
| Churn | 10–15% |
| Wealth fees (median) | robo 0.25% / advisor 0.70% |
| Branches / Assets | ~30 / $3.7B (2023) |
Full Version Awaits
ACNB Bank Porter's Five Forces Analysis
This preview shows the exact Porter’s Five Forces analysis of ACNB Bank you’ll receive after purchase—no placeholders or mockups. The document assesses competitive rivalry, supplier and buyer power, threat of entry and substitution, and strategic implications. It is professionally formatted and ready for immediate download. What you see is the final deliverable.
Original: $10.00
-65%$10.00
$3.50Description
Go Beyond the Preview—Access the Full Strategic Report
ACNB Bank faces a mix of regional strengths and rising digital threats, with moderate buyer power, concentrated suppliers, and barriers shaped by regulation and branch footprint. Competitive intensity is driven by community banks and fintech challengers, while substitutes pressure margins via digital payments. This snapshot hints at strategic levers—capital allocation, tech investment, and partnership play. Unlock the full Porter's Five Forces Analysis to explore ACNB Bank’s competitive dynamics and actionable implications.
Suppliers Bargaining Power
Concentrated core processors
ACNB depends on concentrated core providers such as Fiserv, FIS and Jack Henry, creating significant switching costs and vendor lock-in; these vendors are the dominant core-system suppliers for US banks, limiting alternatives and giving leverage on pricing and contract terms. Complex integrations and regulatory compliance increase dependency, while industry-standard multi-year contracts further entrench supplier power.
Funding from deposits/wholesale
Depositors and wholesale lenders supply ACNB’s primary input—funds; with the federal funds rate around 5.25–5.50% in 2024, depositors pushed into higher-yield products, compressing margins. Increased reliance on FHLB lines and brokered CDs raises funding costs and can introduce covenants that constrain balance-sheet flexibility. A deeper mix of diversified, stable core deposits materially reduces this supplier bargaining power and interest-rate sensitivity.
Specialist third-party services
Specialist third-party services—credit bureaus, appraisal firms, compliance regtech and card networks—hold niche capabilities and pricing power that are largely non-negotiable for a community bank; the Big Three credit bureaus control roughly 90% of US consumer credit data (2024). Visa and Mastercard together process about 80% of card transactions (2024), so their fee schedules and rules directly affect ACNB’s margins. Service disruptions or sudden price hikes can delay lending and card services, while dual-sourcing reduces vendor risk but raises operating costs.
Talent and cybersecurity vendors
- Wage pressure: higher pay vs regional peers
- Talent gap: BLS 32% growth; ISC2 3.4M gap
- Vendor lock-in: MSSCs, tool integration
- Compliance friction: certifications/audits
Cloud and fintech integrations
Cloud hosting and API-led fintech integrations give ACNB rapid digital features but create supplier dependency; in 2024 AWS (32%), Azure (23%) and GCP (12%) dominance concentrates bargaining power and egress fees (commonly $0.02–$0.09/GB) and tiered pricing can be unfavorable at small scale. Vendor due diligence, SLAs and certification needs limit flexibility, while strategic fintech partnerships can offset costs and reduce lock-in risk.
- APIs enable speed but increase reliance
- 2024 cloud share: AWS 32% Azure 23% GCP 12%
- Egress fees ~$0.02–$0.09/GB hurt small banks
- SLAs/due diligence constrain agility
Concentrated suppliers and rising rates tighten margins; dual-sourcing offers limited relief
ACNB faces high supplier power from core-processor lock-in (Fiserv/FIS/Jack Henry), concentrated cloud and card networks, and funding providers; rate pressure (fed funds 5.25–5.50% in 2024) raises deposit costs and reliance on FHLB/brokered funding. Niche vendors (credit bureaus 90% share; Visa/Mastercard ~80%) and scarce talent (BLS 32% growth; ISC2 3.4M gap) limit bargaining leverage. Dual-sourcing and fintech partnerships reduce but do not eliminate supplier risk.
| Supplier | Influence | 2024 Metric |
|---|---|---|
| Core processors | High; switching costs | Concentrated market |
| Card networks | Fee control | ~80% market share |
| Credit bureaus | Data monopoly | ~90% share |
| Cloud | Pricing/egress | AWS 32% Azure 23% GCP 12%; $0.02–$0.09/GB |
| Funding | Margin pressure | Fed funds 5.25–5.50% |
| Talent | Wage pressure | BLS 32% growth; 3.4M gap |
What is included in the product
Detailed Word Document
Analyzes competitive rivalry, buyer and supplier power, threats from new entrants and substitutes, and industry dynamics shaping ACNB Bank’s pricing and profitability, highlighting disruptive threats and barriers that protect incumbents.
Customizable Excel Spreadsheet
A concise one-sheet Porter’s Five Forces analysis for ACNB Bank that clarifies competitive pressures and accelerates board-level decisions. Easily customizable pressure levels and radar-chart visuals—ready to drop into decks or Excel dashboards without macros.
Customers Bargaining Power
Rate-sensitive depositors
Consumers and SMBs in South Central PA/MD can easily rate-shop across banks and credit unions, with online tools and promotional CDs pushing price transparency and yields—high-yield offers exceeded 4% in 2024. Higher-beta deposits that reprice quickly raise customer bargaining power and force ACNB to match local promos. Relationship benefits like business banking services lower churn but do not eliminate sensitivity to rates.
Negotiating commercial clients
Larger commercial borrowers can extract lower loan rates, relaxed covenants and fee waivers, often bundling treasury services for discounts; competing proposals from regional banks intensify leverage. ACNB Financial, with roughly $3.7 billion in assets (2023), leans on local decisioning and faster turnaround to partially offset price pressure. Rapid service can preserve margins even when competitors bid aggressively.
Low switching costs digitally
Digital account opening and ACH portability mean over 70% of new retail accounts were opened digitally in 2024, lowering friction to switch and raising customers’ bargaining power.
Bill-pay history and direct deposits impart some stickiness, but industry churn rates near 10–15% show this is not insurmountable.
Fintech UX now sets convenience expectations, so ACNB must match functionality and mobile-first features to retain users.
Wealth/Trust fee sensitivity
Wealth clients compare advisory fees and performance intensively; by 2024 robo-advisor median fees sat near 0.25% while traditional advisor AUM fees averaged about 0.70%, pressuring margins. ETF adoption and fee compression continue to erode pricing power. ACNB can justify higher fees through fiduciary trust services, local advisory relationships and transparent reporting to reduce churn.
- Fee pressure: robo ~0.25% vs advisor ~0.70% (2024)
- Differentiation: fiduciary trust/local advice
- Retention: transparent reporting curbs churn
Community relationship offset
ACNB’s deep local ties, roughly 30 branch locations in its Pennsylvania footprint as of 2024, and relationship banking shift customer focus away from pure price competition; small businesses prize direct banker access and tailored credit solutions, strengthening retention. Community sponsorships and visible presence create measurable goodwill that softens buyer bargaining power across ACNB’s markets.
- Local branches: ~30 (2024)
- Small biz priority: banker access & tailored credit
- Brand equity: sponsorships → reduced price sensitivity
Deposits >4% and 70% digital onboarding squeeze margins
Customers exhibit high bargaining power: rate-sensitive retail deposits (high-yield >4% in 2024), digital switching (70% of new accounts opened digitally in 2024) and churn ~10–15% pressure pricing, while businesses extract concessions by bundling services. ACNB ($3.7B assets, 2023) offsets with 30 branches, local decisioning and fiduciary differentiation.
| Metric | 2024/2023 |
|---|---|
| High-yield offers | >4% |
| Digital new accounts | 70% |
| Churn | 10–15% |
| Wealth fees (median) | robo 0.25% / advisor 0.70% |
| Branches / Assets | ~30 / $3.7B (2023) |
Full Version Awaits
ACNB Bank Porter's Five Forces Analysis
This preview shows the exact Porter’s Five Forces analysis of ACNB Bank you’ll receive after purchase—no placeholders or mockups. The document assesses competitive rivalry, supplier and buyer power, threat of entry and substitution, and strategic implications. It is professionally formatted and ready for immediate download. What you see is the final deliverable.











