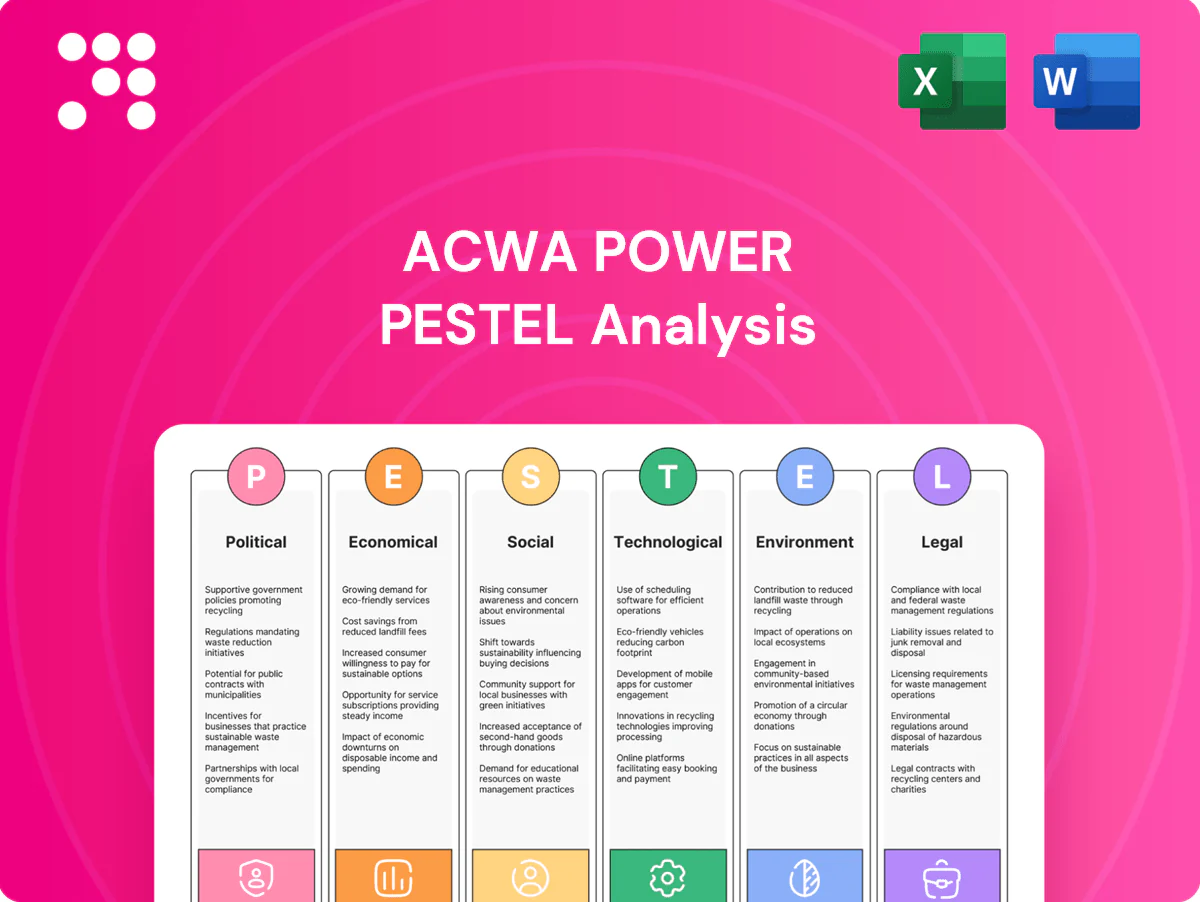
ACWA Power PESTLE Analysis

Your Shortcut to Market Insight Starts Here
Uncover how political shifts, economic trends, social expectations, technological advances, legal changes, and environmental pressures shape ACWA Power’s strategy and risks. This PESTLE snapshot highlights key external forces and their implications for investors and strategists. Buy the full analysis to access detailed, actionable insights and downloadable templates for immediate use.
Political factors

Energy transition policies and national targets
Government decarbonization roadmaps and net-zero pledges, notably Saudi Arabia 2060 and UAE 2050, drive higher renewable and desalination procurement for ACWA Power.
Feed-in tariffs, contracts for difference and national green hydrogen strategies create bankable pipelines and affect revenue certainty.
Political shifts can reprioritize technologies and timelines; monitoring policy stability in core markets—Saudi Arabia, wider MENA and emerging Asia—is critical.
State ownership, sovereign partnerships, and geopolitics
Large utility and sovereign counterparties shape ACWA Power project selection, risk allocation and financing, reflected in its over 30 GW operational and pipeline capacity securing long-tenor contracts. Bilateral ties and regional geopolitics influence cross-border power trade and offtake certainty, with PPAs typically structured for 20–25 years to mitigate counterparty risk. Sanctions or diplomatic rifts can delay permits or financing and strengthen the value of alignment with host-country development agendas.

Public-private partnership frameworks
IPP/IWPP models and evolving PPP laws shape tender transparency and risk sharing for ACWA Power; its presence in 12 countries and a >30 GW project pipeline (2024) leverages government-backed offtake agreements that enhance bankability but enforce local content rules. Changes to tariff indexation or fuel-pass-through mechanisms can materially alter returns, while mature PPP regimes with predictable procurement cycles support ACWA’s bidding and financing strategy.

Subsidy reform and electricity pricing
Energy price reforms that cut cross-subsidies reveal renewables and RO desalination cost competitiveness, improving project bankability while political sensitivity to tariff hikes can cap allowed returns and delay approval. Indexation to fuel prices and inflation (common in recent GCC PPAs) stabilizes cash flows; clear pass-through clauses for fuel, power purchase and water tariffs are essential to avoid margin erosion.
- Reveals true LCOE vs subsidized tariffs
- Tariff caps may limit IRR
- Indexation stabilizes revenues
- Pass-through clauses protect margins
Permitting, land access, and social license
Government-controlled land and coastal access enable ACWA Power to site utility-scale solar, wind, and desalination projects often at 100+ MW scales, while political backing streamlines environmental clearances and grid connections. Robust community engagement policies shape timelines and costs; early stakeholder mapping and social license efforts materially reduce permit risk and opposition.
- Land access: enables 100+ MW siting
- Political support: faster clearances and grid tie
- Community policy: affects timelines/costs
- Mitigation: early stakeholder mapping lowers permit risk
GCC net-zero targets and hydrogen plans unlock bankable renewable + desalination pipelines
Saudi Arabia net-zero by 2060 and UAE 2050 boost renewable and desalination procurement for ACWA Power.
Feed-in tariffs, CfDs and national hydrogen plans create bankable pipelines; ACWA >30 GW pipeline (2024) across 12 countries increases revenue visibility.
PPAs typically 20–25 years; tariff indexation and pass-through clauses vital to protect IRR against fuel/inflation shocks.
| Metric | Value |
|---|---|
| ACWA pipeline (2024) | >30 GW |
What is included in the product
 Detailed Word Document
Explores how external macro-environmental factors uniquely affect ACWA Power across Political, Economic, Social, Technological, Environmental and Legal dimensions; each section is data‑backed, regionally and regulatorily grounded, and includes forward‑looking insights to help executives, investors and strategists identify opportunities, risks and scenario actions.

 Customizable Excel Spreadsheet
A concise, visually segmented PESTLE summary of ACWA Power that’s easily droppable into presentations, editable for region-specific notes, and shareable for quick team alignment — streamlining external risk discussion and strategic planning.
Economic factors

Interest rates and project finance costs
Rising global rates (US 10y ~4.2% mid‑2025) push WACC higher and lift bid tariffs for capital‑intensive plants, increasing project costs by tens of basis points. Access to export credit agencies and Islamic finance, which can cover 50–80% of debt, materially lowers blended cost of debt. Refinancing optionality has historically improved equity IRR by 200–500 bps as rates normalize, making financial structuring a key competitive lever for ACWA Power.
Commodity and equipment cost volatility
Volatility in PV module (~0.20 USD/W in 2024), wind-turbine and membrane prices plus steel (~800 USD/ton) and copper (~9,000 USD/ton) swings materially alters EPC budgets. Hedging and multi-year framework agreements have cut capex volatility for developers by 10–25%. Localizing procurement can trim logistics and lead times by ~10–20% but needs deeper local supply chains. Inflation clauses in EPC and O&M contracts, tied to CPI, protect margins amid 3–5% regional inflation.

Currency risks in multi-market portfolio
Mismatches between USD-denominated project debt and local-currency revenues expose ACWA Power to FX shocks across its >50 GW pipeline; such exposure can erode cash flows and measured returns. Natural hedges from cross-border assets and long-dated swaps (often 7–15 years) cut revenue volatility. Emerging-market devaluations have trimmed dividends in past cycles by double-digit percentages. Contractual indexation and sovereign guarantees in several projects materially bolster resilience.

Demand growth for power and water
Industrialization, urbanization and rising data center loads (data centers consume roughly 1% of global electricity) are driving baseload and renewable power demand; water scarcity affects about 40% of the world, boosting RO desalination and hybrid plant investment. Peak-shaving and capacity needs expand storage markets, while accurate demand forecasting underpins competitive bid strategy.
- Data center load: ~1% global electricity
- Water stress: ~40% population affected
- RO/desalination: rising CAPEX focus
- Storage: enables peak shaving/capacity
Hydrogen and green fuels economics
Levelized cost of hydrogen is governed by power price, electrolyzer capex (~$500–900/kW in 2024) and load factor; green H2 ranges about $1.5–6/kg pre-incentives depending on location and capacity factor. Offtake contracts with ammonia, steel and shipping sectors de-risk revenue and lower financing costs. Government incentives (US 45V up to $3/kg, EU funds) and scale/co-location with renewables can cut LCOH 20–40%.
- Power price sensitivity: ±$0.5–1/kg per $10/MWh
- Electrolyzer capex: $500–900/kW (2024)
- Offtake de-risking: improves bankability, lowers WACC
- Incentives: up to $3/kg (US 45V)
GCC net-zero targets and hydrogen plans unlock bankable renewable + desalination pipelines
Higher global rates (US 10y ~4.2% mid‑2025) raise WACC and bid tariffs, while export credit/Islamic finance (50–80% debt) lowers blended cost. PV ($0.20/W 2024), steel (~800 USD/ton) and copper (~9,000 USD/ton) swings drive EPC capex variability. FX mismatches across ACWA Power’s >50 GW pipeline increase cash‑flow risk; long swaps and indexation reduce volatility. Rising data center loads (~1% global) and 40% water stress lift storage and RO/desal demand.
| Metric | Value |
|---|---|
| US 10y (mid‑2025) | ~4.2% |
| PV module (2024) | ~0.20 USD/W |
| Steel / Copper | ~800 USD/ton / ~9,000 USD/ton |
| Electrolyzer capex (2024) | 500–900 USD/kW |
| Green H2 LCOH | ~1.5–6 USD/kg |
| Water stress | ~40% population |
| Data center load | ~1% global electricity |
| ACWA pipeline | >50 GW |
Same Document Delivered
ACWA Power PESTLE Analysis
The preview shown here is the exact ACWA Power PESTLE Analysis you’ll receive after purchase—fully formatted, professionally structured, and ready to use. No placeholders or teasers: the layout, content, and structure visible here are the final file available for immediate download.

Your Shortcut to Market Insight Starts Here
Uncover how political shifts, economic trends, social expectations, technological advances, legal changes, and environmental pressures shape ACWA Power’s strategy and risks. This PESTLE snapshot highlights key external forces and their implications for investors and strategists. Buy the full analysis to access detailed, actionable insights and downloadable templates for immediate use.
Political factors
Energy transition policies and national targets
Government decarbonization roadmaps and net-zero pledges, notably Saudi Arabia 2060 and UAE 2050, drive higher renewable and desalination procurement for ACWA Power.
Feed-in tariffs, contracts for difference and national green hydrogen strategies create bankable pipelines and affect revenue certainty.
Political shifts can reprioritize technologies and timelines; monitoring policy stability in core markets—Saudi Arabia, wider MENA and emerging Asia—is critical.
State ownership, sovereign partnerships, and geopolitics
Large utility and sovereign counterparties shape ACWA Power project selection, risk allocation and financing, reflected in its over 30 GW operational and pipeline capacity securing long-tenor contracts. Bilateral ties and regional geopolitics influence cross-border power trade and offtake certainty, with PPAs typically structured for 20–25 years to mitigate counterparty risk. Sanctions or diplomatic rifts can delay permits or financing and strengthen the value of alignment with host-country development agendas.
Public-private partnership frameworks
IPP/IWPP models and evolving PPP laws shape tender transparency and risk sharing for ACWA Power; its presence in 12 countries and a >30 GW project pipeline (2024) leverages government-backed offtake agreements that enhance bankability but enforce local content rules. Changes to tariff indexation or fuel-pass-through mechanisms can materially alter returns, while mature PPP regimes with predictable procurement cycles support ACWA’s bidding and financing strategy.
Subsidy reform and electricity pricing
Energy price reforms that cut cross-subsidies reveal renewables and RO desalination cost competitiveness, improving project bankability while political sensitivity to tariff hikes can cap allowed returns and delay approval. Indexation to fuel prices and inflation (common in recent GCC PPAs) stabilizes cash flows; clear pass-through clauses for fuel, power purchase and water tariffs are essential to avoid margin erosion.
- Reveals true LCOE vs subsidized tariffs
- Tariff caps may limit IRR
- Indexation stabilizes revenues
- Pass-through clauses protect margins
Permitting, land access, and social license
Government-controlled land and coastal access enable ACWA Power to site utility-scale solar, wind, and desalination projects often at 100+ MW scales, while political backing streamlines environmental clearances and grid connections. Robust community engagement policies shape timelines and costs; early stakeholder mapping and social license efforts materially reduce permit risk and opposition.
- Land access: enables 100+ MW siting
- Political support: faster clearances and grid tie
- Community policy: affects timelines/costs
- Mitigation: early stakeholder mapping lowers permit risk
GCC net-zero targets and hydrogen plans unlock bankable renewable + desalination pipelines
Saudi Arabia net-zero by 2060 and UAE 2050 boost renewable and desalination procurement for ACWA Power.
Feed-in tariffs, CfDs and national hydrogen plans create bankable pipelines; ACWA >30 GW pipeline (2024) across 12 countries increases revenue visibility.
PPAs typically 20–25 years; tariff indexation and pass-through clauses vital to protect IRR against fuel/inflation shocks.
| Metric | Value |
|---|---|
| ACWA pipeline (2024) | >30 GW |
What is included in the product
Detailed Word Document
Explores how external macro-environmental factors uniquely affect ACWA Power across Political, Economic, Social, Technological, Environmental and Legal dimensions; each section is data‑backed, regionally and regulatorily grounded, and includes forward‑looking insights to help executives, investors and strategists identify opportunities, risks and scenario actions.
Customizable Excel Spreadsheet
A concise, visually segmented PESTLE summary of ACWA Power that’s easily droppable into presentations, editable for region-specific notes, and shareable for quick team alignment — streamlining external risk discussion and strategic planning.
Economic factors
Interest rates and project finance costs
Rising global rates (US 10y ~4.2% mid‑2025) push WACC higher and lift bid tariffs for capital‑intensive plants, increasing project costs by tens of basis points. Access to export credit agencies and Islamic finance, which can cover 50–80% of debt, materially lowers blended cost of debt. Refinancing optionality has historically improved equity IRR by 200–500 bps as rates normalize, making financial structuring a key competitive lever for ACWA Power.
Commodity and equipment cost volatility
Volatility in PV module (~0.20 USD/W in 2024), wind-turbine and membrane prices plus steel (~800 USD/ton) and copper (~9,000 USD/ton) swings materially alters EPC budgets. Hedging and multi-year framework agreements have cut capex volatility for developers by 10–25%. Localizing procurement can trim logistics and lead times by ~10–20% but needs deeper local supply chains. Inflation clauses in EPC and O&M contracts, tied to CPI, protect margins amid 3–5% regional inflation.
Currency risks in multi-market portfolio
Mismatches between USD-denominated project debt and local-currency revenues expose ACWA Power to FX shocks across its >50 GW pipeline; such exposure can erode cash flows and measured returns. Natural hedges from cross-border assets and long-dated swaps (often 7–15 years) cut revenue volatility. Emerging-market devaluations have trimmed dividends in past cycles by double-digit percentages. Contractual indexation and sovereign guarantees in several projects materially bolster resilience.
Demand growth for power and water
Industrialization, urbanization and rising data center loads (data centers consume roughly 1% of global electricity) are driving baseload and renewable power demand; water scarcity affects about 40% of the world, boosting RO desalination and hybrid plant investment. Peak-shaving and capacity needs expand storage markets, while accurate demand forecasting underpins competitive bid strategy.
- Data center load: ~1% global electricity
- Water stress: ~40% population affected
- RO/desalination: rising CAPEX focus
- Storage: enables peak shaving/capacity
Hydrogen and green fuels economics
Levelized cost of hydrogen is governed by power price, electrolyzer capex (~$500–900/kW in 2024) and load factor; green H2 ranges about $1.5–6/kg pre-incentives depending on location and capacity factor. Offtake contracts with ammonia, steel and shipping sectors de-risk revenue and lower financing costs. Government incentives (US 45V up to $3/kg, EU funds) and scale/co-location with renewables can cut LCOH 20–40%.
- Power price sensitivity: ±$0.5–1/kg per $10/MWh
- Electrolyzer capex: $500–900/kW (2024)
- Offtake de-risking: improves bankability, lowers WACC
- Incentives: up to $3/kg (US 45V)
GCC net-zero targets and hydrogen plans unlock bankable renewable + desalination pipelines
Higher global rates (US 10y ~4.2% mid‑2025) raise WACC and bid tariffs, while export credit/Islamic finance (50–80% debt) lowers blended cost. PV ($0.20/W 2024), steel (~800 USD/ton) and copper (~9,000 USD/ton) swings drive EPC capex variability. FX mismatches across ACWA Power’s >50 GW pipeline increase cash‑flow risk; long swaps and indexation reduce volatility. Rising data center loads (~1% global) and 40% water stress lift storage and RO/desal demand.
| Metric | Value |
|---|---|
| US 10y (mid‑2025) | ~4.2% |
| PV module (2024) | ~0.20 USD/W |
| Steel / Copper | ~800 USD/ton / ~9,000 USD/ton |
| Electrolyzer capex (2024) | 500–900 USD/kW |
| Green H2 LCOH | ~1.5–6 USD/kg |
| Water stress | ~40% population |
| Data center load | ~1% global electricity |
| ACWA pipeline | >50 GW |
Same Document Delivered
ACWA Power PESTLE Analysis
The preview shown here is the exact ACWA Power PESTLE Analysis you’ll receive after purchase—fully formatted, professionally structured, and ready to use. No placeholders or teasers: the layout, content, and structure visible here are the final file available for immediate download.
Original: $10.00
-65%$10.00
$3.50Description
Your Shortcut to Market Insight Starts Here
Uncover how political shifts, economic trends, social expectations, technological advances, legal changes, and environmental pressures shape ACWA Power’s strategy and risks. This PESTLE snapshot highlights key external forces and their implications for investors and strategists. Buy the full analysis to access detailed, actionable insights and downloadable templates for immediate use.
Political factors
Energy transition policies and national targets
Government decarbonization roadmaps and net-zero pledges, notably Saudi Arabia 2060 and UAE 2050, drive higher renewable and desalination procurement for ACWA Power.
Feed-in tariffs, contracts for difference and national green hydrogen strategies create bankable pipelines and affect revenue certainty.
Political shifts can reprioritize technologies and timelines; monitoring policy stability in core markets—Saudi Arabia, wider MENA and emerging Asia—is critical.
State ownership, sovereign partnerships, and geopolitics
Large utility and sovereign counterparties shape ACWA Power project selection, risk allocation and financing, reflected in its over 30 GW operational and pipeline capacity securing long-tenor contracts. Bilateral ties and regional geopolitics influence cross-border power trade and offtake certainty, with PPAs typically structured for 20–25 years to mitigate counterparty risk. Sanctions or diplomatic rifts can delay permits or financing and strengthen the value of alignment with host-country development agendas.
Public-private partnership frameworks
IPP/IWPP models and evolving PPP laws shape tender transparency and risk sharing for ACWA Power; its presence in 12 countries and a >30 GW project pipeline (2024) leverages government-backed offtake agreements that enhance bankability but enforce local content rules. Changes to tariff indexation or fuel-pass-through mechanisms can materially alter returns, while mature PPP regimes with predictable procurement cycles support ACWA’s bidding and financing strategy.
Subsidy reform and electricity pricing
Energy price reforms that cut cross-subsidies reveal renewables and RO desalination cost competitiveness, improving project bankability while political sensitivity to tariff hikes can cap allowed returns and delay approval. Indexation to fuel prices and inflation (common in recent GCC PPAs) stabilizes cash flows; clear pass-through clauses for fuel, power purchase and water tariffs are essential to avoid margin erosion.
- Reveals true LCOE vs subsidized tariffs
- Tariff caps may limit IRR
- Indexation stabilizes revenues
- Pass-through clauses protect margins
Permitting, land access, and social license
Government-controlled land and coastal access enable ACWA Power to site utility-scale solar, wind, and desalination projects often at 100+ MW scales, while political backing streamlines environmental clearances and grid connections. Robust community engagement policies shape timelines and costs; early stakeholder mapping and social license efforts materially reduce permit risk and opposition.
- Land access: enables 100+ MW siting
- Political support: faster clearances and grid tie
- Community policy: affects timelines/costs
- Mitigation: early stakeholder mapping lowers permit risk
GCC net-zero targets and hydrogen plans unlock bankable renewable + desalination pipelines
Saudi Arabia net-zero by 2060 and UAE 2050 boost renewable and desalination procurement for ACWA Power.
Feed-in tariffs, CfDs and national hydrogen plans create bankable pipelines; ACWA >30 GW pipeline (2024) across 12 countries increases revenue visibility.
PPAs typically 20–25 years; tariff indexation and pass-through clauses vital to protect IRR against fuel/inflation shocks.
| Metric | Value |
|---|---|
| ACWA pipeline (2024) | >30 GW |
What is included in the product
Detailed Word Document
Explores how external macro-environmental factors uniquely affect ACWA Power across Political, Economic, Social, Technological, Environmental and Legal dimensions; each section is data‑backed, regionally and regulatorily grounded, and includes forward‑looking insights to help executives, investors and strategists identify opportunities, risks and scenario actions.
Customizable Excel Spreadsheet
A concise, visually segmented PESTLE summary of ACWA Power that’s easily droppable into presentations, editable for region-specific notes, and shareable for quick team alignment — streamlining external risk discussion and strategic planning.
Economic factors
Interest rates and project finance costs
Rising global rates (US 10y ~4.2% mid‑2025) push WACC higher and lift bid tariffs for capital‑intensive plants, increasing project costs by tens of basis points. Access to export credit agencies and Islamic finance, which can cover 50–80% of debt, materially lowers blended cost of debt. Refinancing optionality has historically improved equity IRR by 200–500 bps as rates normalize, making financial structuring a key competitive lever for ACWA Power.
Commodity and equipment cost volatility
Volatility in PV module (~0.20 USD/W in 2024), wind-turbine and membrane prices plus steel (~800 USD/ton) and copper (~9,000 USD/ton) swings materially alters EPC budgets. Hedging and multi-year framework agreements have cut capex volatility for developers by 10–25%. Localizing procurement can trim logistics and lead times by ~10–20% but needs deeper local supply chains. Inflation clauses in EPC and O&M contracts, tied to CPI, protect margins amid 3–5% regional inflation.
Currency risks in multi-market portfolio
Mismatches between USD-denominated project debt and local-currency revenues expose ACWA Power to FX shocks across its >50 GW pipeline; such exposure can erode cash flows and measured returns. Natural hedges from cross-border assets and long-dated swaps (often 7–15 years) cut revenue volatility. Emerging-market devaluations have trimmed dividends in past cycles by double-digit percentages. Contractual indexation and sovereign guarantees in several projects materially bolster resilience.
Demand growth for power and water
Industrialization, urbanization and rising data center loads (data centers consume roughly 1% of global electricity) are driving baseload and renewable power demand; water scarcity affects about 40% of the world, boosting RO desalination and hybrid plant investment. Peak-shaving and capacity needs expand storage markets, while accurate demand forecasting underpins competitive bid strategy.
- Data center load: ~1% global electricity
- Water stress: ~40% population affected
- RO/desalination: rising CAPEX focus
- Storage: enables peak shaving/capacity
Hydrogen and green fuels economics
Levelized cost of hydrogen is governed by power price, electrolyzer capex (~$500–900/kW in 2024) and load factor; green H2 ranges about $1.5–6/kg pre-incentives depending on location and capacity factor. Offtake contracts with ammonia, steel and shipping sectors de-risk revenue and lower financing costs. Government incentives (US 45V up to $3/kg, EU funds) and scale/co-location with renewables can cut LCOH 20–40%.
- Power price sensitivity: ±$0.5–1/kg per $10/MWh
- Electrolyzer capex: $500–900/kW (2024)
- Offtake de-risking: improves bankability, lowers WACC
- Incentives: up to $3/kg (US 45V)
GCC net-zero targets and hydrogen plans unlock bankable renewable + desalination pipelines
Higher global rates (US 10y ~4.2% mid‑2025) raise WACC and bid tariffs, while export credit/Islamic finance (50–80% debt) lowers blended cost. PV ($0.20/W 2024), steel (~800 USD/ton) and copper (~9,000 USD/ton) swings drive EPC capex variability. FX mismatches across ACWA Power’s >50 GW pipeline increase cash‑flow risk; long swaps and indexation reduce volatility. Rising data center loads (~1% global) and 40% water stress lift storage and RO/desal demand.
| Metric | Value |
|---|---|
| US 10y (mid‑2025) | ~4.2% |
| PV module (2024) | ~0.20 USD/W |
| Steel / Copper | ~800 USD/ton / ~9,000 USD/ton |
| Electrolyzer capex (2024) | 500–900 USD/kW |
| Green H2 LCOH | ~1.5–6 USD/kg |
| Water stress | ~40% population |
| Data center load | ~1% global electricity |
| ACWA pipeline | >50 GW |
Same Document Delivered
ACWA Power PESTLE Analysis
The preview shown here is the exact ACWA Power PESTLE Analysis you’ll receive after purchase—fully formatted, professionally structured, and ready to use. No placeholders or teasers: the layout, content, and structure visible here are the final file available for immediate download.











