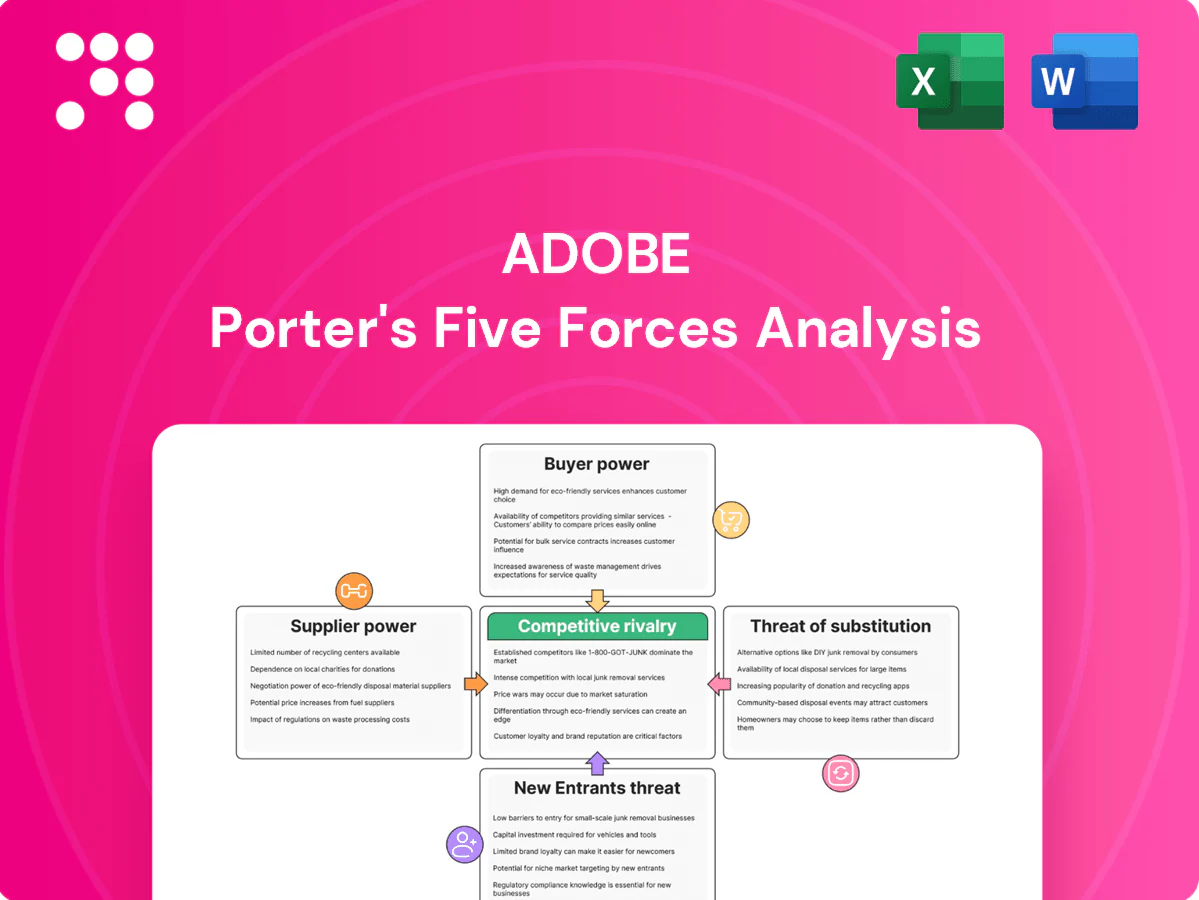
Adobe Porter's Five Forces Analysis

From Overview to Strategy Blueprint
Adobe faces strong competitive rivalry from established creative and SaaS firms, moderate buyer power amid subscription models, and manageable supplier influence thanks to cloud-scale advantages. Threats from new entrants and substitutes are tempered by high switching costs and network effects. This brief snapshot only scratches the surface—unlock the full Porter's Five Forces Analysis for Adobe to access force-by-force ratings, visuals, and strategic implications.
Suppliers Bargaining Power

Cloud and compute providers
Adobe depends on hyperscalers (AWS ~32%, Azure ~23%, GCP ~11% share in 2024), giving providers leverage over pricing and capacity allocation for hosting, storage and AI training/inference. Multi-cloud deployment and multi-year contracts limit that power. GPU scarcity in 2023–24 (H100 spot prices surged several-fold) tightened terms during AI demand spikes. Adobe counters by optimizing workloads and investing in model efficiency.
Semiconductor and GPU vendors
Performance in Adobe Creative Cloud apps hinges on CPUs/GPUs from NVIDIA, AMD, Intel and Apple, with NVIDIA commanding roughly 80% of discrete GPU shipments in 2024 and >90% share of AI/data‑center accelerators, concentrating supplier power. Supply constraints and proprietary features (ex: CUDA) can raise costs or limit optimisation; TSMC fab utilisation remained >90% in 2024, tightening supply. Adobe mitigates risk via broad hardware support and vendor partnerships, while vendor roadmaps materially dictate feature velocity and release timing.

Third‑party data and content sources
Third-party stock content, fonts and data feeds—Adobe Stock (library exceeding 200 million assets in 2024) and Adobe Fonts (over 20,000 fonts in 2024) enrich products and ML training sets, but exclusive libraries or rights-managed assets give niche suppliers pricing power. Adobe offsets risk with first-party assets and bundled services across Creative Cloud, while diverse contracts and multiple suppliers reduce single-supplier dependency and bargaining leverage.

App stores and payment channels
Mobile and desktop app marketplaces can impose fees up to 30% (Apple/Google standard, 15% for small developers as of 2024), raising distribution costs for SMB/consumer channels. Adobe’s large direct-sales and enterprise contracts reduce reliance on stores, diluting this supplier power. Negotiated enterprise terms and web-based delivery (SaaS/browser) further offset app-store fees and policy constraints.
- app_fees: up to 30% (15% small dev)
- impact: raises SMB distribution costs
- mitigation: direct sales, enterprise contracts
- offset: web/SaaS delivery, negotiated terms
Specialized talent and contractors
AI researchers, graphics engineers, and security experts are scarce and command premium compensation, giving labor supplier-like leverage that is magnified by wage inflation and retention needs. Adobe offsets this through equity incentives, a strong R&D culture and global hiring pipelines while reporting $20.78B revenue for fiscal 2024 to fund talent strategies. Outsourcing is used selectively to avoid critical dependence on external suppliers.
- talent_scarcity: AI/research/graphics/sec scarce
- wage_pressure: retention raises labor power
- countermeasures: equity, R&D, global hiring
- outsourcing: selective to reduce dependence
Concentrated cloud (32%/23%/11%) and GPUs (~80%) amplify supplier power
Suppliers exert moderate-to-high power: hyperscalers (AWS 32%, Azure 23%, GCP 11% in 2024) and GPU vendors (NVIDIA ~80% of discrete GPUs, >90% AI accelerators) concentrate leverage; multi-cloud, long contracts and model-efficiency investments mitigate risk. Content suppliers (Adobe Stock 200M assets; Fonts 20k) and app-store fees (30%/15%) add niche pressure. Talent scarcity and wage inflation strain R&D costs; Adobe revenue $20.78B (FY2024) funds offsets.
| Metric | 2024 value |
|---|---|
| AWS/Azure/GCP | 32%/23%/11% |
| NVIDIA GPU share | ~80% |
| Adobe rev | $20.78B |
| Adobe Stock/Fonts | 200M / 20k |
| App fees | 30% / 15% |
What is included in the product
 Detailed Word Document
Concise Porter’s Five Forces analysis of Adobe, assessing rivalry, buyer and supplier power, threat of substitutes, and entry barriers to reveal competitive strengths, pricing leverage, and emerging disruptive risks.

 Customizable Excel Spreadsheet
Adobe Porter’s Five Forces one-sheet pinpoints competitive pressures—ideal for fast strategic decisions, slide-ready and easy to customize for new market data.
Customers Bargaining Power

Enterprise procurement leverage
Large enterprises purchasing Experience Cloud and Document Cloud exert strong procurement leverage, negotiating enterprise discounts and terms tied to scale; Adobe reported fiscal 2024 revenue of about 20.99 billion USD, underscoring enterprise importance. Multi-year commitments (commonly 2–5 years) trade lower price for integration and stickiness. Competitive bids with Salesforce and Microsoft tighten buyer power, while stringent compliance and ROI demands shape contract structures.
Creator and SMB sensitivity
Individual creatives and small teams are highly price sensitive with limited budgets, increasing churn risk from subscription fatigue and monthly cancellations. Alternatives like Affinity, Canva (which passed 100 million users by 2022) and DaVinci Resolve offer credible, lower-cost workflows that amplify buyer leverage. Adobe offsets some pressure via student and regional pricing tiers and bundle discounts. Sellers face higher bargaining power for cost-conscious SMBs and solo creators.

Switching costs and lock‑in
Proprietary formats (PSD, AI, PDF), expansive asset libraries and entrenched workflows raise switching costs for Adobe users, contributing to lock‑in across its reported ~26.3 million Creative Cloud paid subscribers (2024) and Adobe Stock’s ~200 million assets. Cloud collaboration and a large plugin ecosystem further deepen dependence, though improved interoperable exports and cross‑platform tools lower friction; buyers weigh retraining costs against potential license savings.

Feature velocity expectations
Customers now demand rapid AI and collaboration upgrades; if Adobe lags peers buyers press for concessions or consider rivals, pressuring renewal terms. Beta access and transparent roadmaps reduce churn among power users, while community feedback loops directly influence feature prioritization. Adobe reported FY2024 revenue of 20.36 billion, underscoring customer leverage over a large base.
- feature-velocity
- beta-access
- roadmap-transparency
- community-feedback
Multi-product bundling
Adobe’s Creative Cloud and Experience Cloud bundles boost perceived value and muddle straightforward price comparisons, letting buyers press for module-level discounts when they adopt only parts of the suite. In 2024 Adobe leaned on bundling to cut churn and create upsell paths amid a reported FY2024 revenue of $22.45 billion. Usage analytics drive targeted renewal offers and price differentiation to retain high-value accounts.
Enterprise buyers wield leverage as leading creative platform scales revenue and assets
Enterprise buyers exert strong leverage—Adobe reported fiscal 2024 revenue of about $20.99B and ~26.3M Creative Cloud paid subscribers, driving enterprise discounts and multiyear commitments while competition from Salesforce and Microsoft tightens terms. Price-sensitive SMBs and individuals face churn risk versus lower‑cost rivals (Canva 100M users by 2022, Affinity, DaVinci). Proprietary formats and ~200M Adobe Stock assets raise switching costs, but demand for rapid AI/feature velocity and bundle-level negotiations sustains buyer bargaining power.
| Metric | 2024 | Impact |
|---|---|---|
| Revenue | $20.99B | Enterprise negotiation |
| Creative Cloud subs | ~26.3M | Lock‑in |
| Adobe Stock | ~200M assets | Switching cost |
Same Document Delivered
Adobe Porter's Five Forces Analysis
This preview shows the exact Adobe Porter’s Five Forces analysis you’ll receive immediately after purchase—no placeholders or mockups. It presents a full assessment of competitive rivalry, supplier and buyer power, threats of entry and substitutes, and strategic implications. The file is fully formatted and ready to download.

From Overview to Strategy Blueprint
Adobe faces strong competitive rivalry from established creative and SaaS firms, moderate buyer power amid subscription models, and manageable supplier influence thanks to cloud-scale advantages. Threats from new entrants and substitutes are tempered by high switching costs and network effects. This brief snapshot only scratches the surface—unlock the full Porter's Five Forces Analysis for Adobe to access force-by-force ratings, visuals, and strategic implications.
Suppliers Bargaining Power
Cloud and compute providers
Adobe depends on hyperscalers (AWS ~32%, Azure ~23%, GCP ~11% share in 2024), giving providers leverage over pricing and capacity allocation for hosting, storage and AI training/inference. Multi-cloud deployment and multi-year contracts limit that power. GPU scarcity in 2023–24 (H100 spot prices surged several-fold) tightened terms during AI demand spikes. Adobe counters by optimizing workloads and investing in model efficiency.
Semiconductor and GPU vendors
Performance in Adobe Creative Cloud apps hinges on CPUs/GPUs from NVIDIA, AMD, Intel and Apple, with NVIDIA commanding roughly 80% of discrete GPU shipments in 2024 and >90% share of AI/data‑center accelerators, concentrating supplier power. Supply constraints and proprietary features (ex: CUDA) can raise costs or limit optimisation; TSMC fab utilisation remained >90% in 2024, tightening supply. Adobe mitigates risk via broad hardware support and vendor partnerships, while vendor roadmaps materially dictate feature velocity and release timing.
Third‑party data and content sources
Third-party stock content, fonts and data feeds—Adobe Stock (library exceeding 200 million assets in 2024) and Adobe Fonts (over 20,000 fonts in 2024) enrich products and ML training sets, but exclusive libraries or rights-managed assets give niche suppliers pricing power. Adobe offsets risk with first-party assets and bundled services across Creative Cloud, while diverse contracts and multiple suppliers reduce single-supplier dependency and bargaining leverage.
App stores and payment channels
Mobile and desktop app marketplaces can impose fees up to 30% (Apple/Google standard, 15% for small developers as of 2024), raising distribution costs for SMB/consumer channels. Adobe’s large direct-sales and enterprise contracts reduce reliance on stores, diluting this supplier power. Negotiated enterprise terms and web-based delivery (SaaS/browser) further offset app-store fees and policy constraints.
- app_fees: up to 30% (15% small dev)
- impact: raises SMB distribution costs
- mitigation: direct sales, enterprise contracts
- offset: web/SaaS delivery, negotiated terms
Specialized talent and contractors
AI researchers, graphics engineers, and security experts are scarce and command premium compensation, giving labor supplier-like leverage that is magnified by wage inflation and retention needs. Adobe offsets this through equity incentives, a strong R&D culture and global hiring pipelines while reporting $20.78B revenue for fiscal 2024 to fund talent strategies. Outsourcing is used selectively to avoid critical dependence on external suppliers.
- talent_scarcity: AI/research/graphics/sec scarce
- wage_pressure: retention raises labor power
- countermeasures: equity, R&D, global hiring
- outsourcing: selective to reduce dependence
Concentrated cloud (32%/23%/11%) and GPUs (~80%) amplify supplier power
Suppliers exert moderate-to-high power: hyperscalers (AWS 32%, Azure 23%, GCP 11% in 2024) and GPU vendors (NVIDIA ~80% of discrete GPUs, >90% AI accelerators) concentrate leverage; multi-cloud, long contracts and model-efficiency investments mitigate risk. Content suppliers (Adobe Stock 200M assets; Fonts 20k) and app-store fees (30%/15%) add niche pressure. Talent scarcity and wage inflation strain R&D costs; Adobe revenue $20.78B (FY2024) funds offsets.
| Metric | 2024 value |
|---|---|
| AWS/Azure/GCP | 32%/23%/11% |
| NVIDIA GPU share | ~80% |
| Adobe rev | $20.78B |
| Adobe Stock/Fonts | 200M / 20k |
| App fees | 30% / 15% |
What is included in the product
Detailed Word Document
Concise Porter’s Five Forces analysis of Adobe, assessing rivalry, buyer and supplier power, threat of substitutes, and entry barriers to reveal competitive strengths, pricing leverage, and emerging disruptive risks.
Customizable Excel Spreadsheet
Adobe Porter’s Five Forces one-sheet pinpoints competitive pressures—ideal for fast strategic decisions, slide-ready and easy to customize for new market data.
Customers Bargaining Power
Enterprise procurement leverage
Large enterprises purchasing Experience Cloud and Document Cloud exert strong procurement leverage, negotiating enterprise discounts and terms tied to scale; Adobe reported fiscal 2024 revenue of about 20.99 billion USD, underscoring enterprise importance. Multi-year commitments (commonly 2–5 years) trade lower price for integration and stickiness. Competitive bids with Salesforce and Microsoft tighten buyer power, while stringent compliance and ROI demands shape contract structures.
Creator and SMB sensitivity
Individual creatives and small teams are highly price sensitive with limited budgets, increasing churn risk from subscription fatigue and monthly cancellations. Alternatives like Affinity, Canva (which passed 100 million users by 2022) and DaVinci Resolve offer credible, lower-cost workflows that amplify buyer leverage. Adobe offsets some pressure via student and regional pricing tiers and bundle discounts. Sellers face higher bargaining power for cost-conscious SMBs and solo creators.
Switching costs and lock‑in
Proprietary formats (PSD, AI, PDF), expansive asset libraries and entrenched workflows raise switching costs for Adobe users, contributing to lock‑in across its reported ~26.3 million Creative Cloud paid subscribers (2024) and Adobe Stock’s ~200 million assets. Cloud collaboration and a large plugin ecosystem further deepen dependence, though improved interoperable exports and cross‑platform tools lower friction; buyers weigh retraining costs against potential license savings.
Feature velocity expectations
Customers now demand rapid AI and collaboration upgrades; if Adobe lags peers buyers press for concessions or consider rivals, pressuring renewal terms. Beta access and transparent roadmaps reduce churn among power users, while community feedback loops directly influence feature prioritization. Adobe reported FY2024 revenue of 20.36 billion, underscoring customer leverage over a large base.
- feature-velocity
- beta-access
- roadmap-transparency
- community-feedback
Multi-product bundling
Adobe’s Creative Cloud and Experience Cloud bundles boost perceived value and muddle straightforward price comparisons, letting buyers press for module-level discounts when they adopt only parts of the suite. In 2024 Adobe leaned on bundling to cut churn and create upsell paths amid a reported FY2024 revenue of $22.45 billion. Usage analytics drive targeted renewal offers and price differentiation to retain high-value accounts.
Enterprise buyers wield leverage as leading creative platform scales revenue and assets
Enterprise buyers exert strong leverage—Adobe reported fiscal 2024 revenue of about $20.99B and ~26.3M Creative Cloud paid subscribers, driving enterprise discounts and multiyear commitments while competition from Salesforce and Microsoft tightens terms. Price-sensitive SMBs and individuals face churn risk versus lower‑cost rivals (Canva 100M users by 2022, Affinity, DaVinci). Proprietary formats and ~200M Adobe Stock assets raise switching costs, but demand for rapid AI/feature velocity and bundle-level negotiations sustains buyer bargaining power.
| Metric | 2024 | Impact |
|---|---|---|
| Revenue | $20.99B | Enterprise negotiation |
| Creative Cloud subs | ~26.3M | Lock‑in |
| Adobe Stock | ~200M assets | Switching cost |
Same Document Delivered
Adobe Porter's Five Forces Analysis
This preview shows the exact Adobe Porter’s Five Forces analysis you’ll receive immediately after purchase—no placeholders or mockups. It presents a full assessment of competitive rivalry, supplier and buyer power, threats of entry and substitutes, and strategic implications. The file is fully formatted and ready to download.
Description
From Overview to Strategy Blueprint
Adobe faces strong competitive rivalry from established creative and SaaS firms, moderate buyer power amid subscription models, and manageable supplier influence thanks to cloud-scale advantages. Threats from new entrants and substitutes are tempered by high switching costs and network effects. This brief snapshot only scratches the surface—unlock the full Porter's Five Forces Analysis for Adobe to access force-by-force ratings, visuals, and strategic implications.
Suppliers Bargaining Power
Cloud and compute providers
Adobe depends on hyperscalers (AWS ~32%, Azure ~23%, GCP ~11% share in 2024), giving providers leverage over pricing and capacity allocation for hosting, storage and AI training/inference. Multi-cloud deployment and multi-year contracts limit that power. GPU scarcity in 2023–24 (H100 spot prices surged several-fold) tightened terms during AI demand spikes. Adobe counters by optimizing workloads and investing in model efficiency.
Semiconductor and GPU vendors
Performance in Adobe Creative Cloud apps hinges on CPUs/GPUs from NVIDIA, AMD, Intel and Apple, with NVIDIA commanding roughly 80% of discrete GPU shipments in 2024 and >90% share of AI/data‑center accelerators, concentrating supplier power. Supply constraints and proprietary features (ex: CUDA) can raise costs or limit optimisation; TSMC fab utilisation remained >90% in 2024, tightening supply. Adobe mitigates risk via broad hardware support and vendor partnerships, while vendor roadmaps materially dictate feature velocity and release timing.
Third‑party data and content sources
Third-party stock content, fonts and data feeds—Adobe Stock (library exceeding 200 million assets in 2024) and Adobe Fonts (over 20,000 fonts in 2024) enrich products and ML training sets, but exclusive libraries or rights-managed assets give niche suppliers pricing power. Adobe offsets risk with first-party assets and bundled services across Creative Cloud, while diverse contracts and multiple suppliers reduce single-supplier dependency and bargaining leverage.
App stores and payment channels
Mobile and desktop app marketplaces can impose fees up to 30% (Apple/Google standard, 15% for small developers as of 2024), raising distribution costs for SMB/consumer channels. Adobe’s large direct-sales and enterprise contracts reduce reliance on stores, diluting this supplier power. Negotiated enterprise terms and web-based delivery (SaaS/browser) further offset app-store fees and policy constraints.
- app_fees: up to 30% (15% small dev)
- impact: raises SMB distribution costs
- mitigation: direct sales, enterprise contracts
- offset: web/SaaS delivery, negotiated terms
Specialized talent and contractors
AI researchers, graphics engineers, and security experts are scarce and command premium compensation, giving labor supplier-like leverage that is magnified by wage inflation and retention needs. Adobe offsets this through equity incentives, a strong R&D culture and global hiring pipelines while reporting $20.78B revenue for fiscal 2024 to fund talent strategies. Outsourcing is used selectively to avoid critical dependence on external suppliers.
- talent_scarcity: AI/research/graphics/sec scarce
- wage_pressure: retention raises labor power
- countermeasures: equity, R&D, global hiring
- outsourcing: selective to reduce dependence
Concentrated cloud (32%/23%/11%) and GPUs (~80%) amplify supplier power
Suppliers exert moderate-to-high power: hyperscalers (AWS 32%, Azure 23%, GCP 11% in 2024) and GPU vendors (NVIDIA ~80% of discrete GPUs, >90% AI accelerators) concentrate leverage; multi-cloud, long contracts and model-efficiency investments mitigate risk. Content suppliers (Adobe Stock 200M assets; Fonts 20k) and app-store fees (30%/15%) add niche pressure. Talent scarcity and wage inflation strain R&D costs; Adobe revenue $20.78B (FY2024) funds offsets.
| Metric | 2024 value |
|---|---|
| AWS/Azure/GCP | 32%/23%/11% |
| NVIDIA GPU share | ~80% |
| Adobe rev | $20.78B |
| Adobe Stock/Fonts | 200M / 20k |
| App fees | 30% / 15% |
What is included in the product
Detailed Word Document
Concise Porter’s Five Forces analysis of Adobe, assessing rivalry, buyer and supplier power, threat of substitutes, and entry barriers to reveal competitive strengths, pricing leverage, and emerging disruptive risks.
Customizable Excel Spreadsheet
Adobe Porter’s Five Forces one-sheet pinpoints competitive pressures—ideal for fast strategic decisions, slide-ready and easy to customize for new market data.
Customers Bargaining Power
Enterprise procurement leverage
Large enterprises purchasing Experience Cloud and Document Cloud exert strong procurement leverage, negotiating enterprise discounts and terms tied to scale; Adobe reported fiscal 2024 revenue of about 20.99 billion USD, underscoring enterprise importance. Multi-year commitments (commonly 2–5 years) trade lower price for integration and stickiness. Competitive bids with Salesforce and Microsoft tighten buyer power, while stringent compliance and ROI demands shape contract structures.
Creator and SMB sensitivity
Individual creatives and small teams are highly price sensitive with limited budgets, increasing churn risk from subscription fatigue and monthly cancellations. Alternatives like Affinity, Canva (which passed 100 million users by 2022) and DaVinci Resolve offer credible, lower-cost workflows that amplify buyer leverage. Adobe offsets some pressure via student and regional pricing tiers and bundle discounts. Sellers face higher bargaining power for cost-conscious SMBs and solo creators.
Switching costs and lock‑in
Proprietary formats (PSD, AI, PDF), expansive asset libraries and entrenched workflows raise switching costs for Adobe users, contributing to lock‑in across its reported ~26.3 million Creative Cloud paid subscribers (2024) and Adobe Stock’s ~200 million assets. Cloud collaboration and a large plugin ecosystem further deepen dependence, though improved interoperable exports and cross‑platform tools lower friction; buyers weigh retraining costs against potential license savings.
Feature velocity expectations
Customers now demand rapid AI and collaboration upgrades; if Adobe lags peers buyers press for concessions or consider rivals, pressuring renewal terms. Beta access and transparent roadmaps reduce churn among power users, while community feedback loops directly influence feature prioritization. Adobe reported FY2024 revenue of 20.36 billion, underscoring customer leverage over a large base.
- feature-velocity
- beta-access
- roadmap-transparency
- community-feedback
Multi-product bundling
Adobe’s Creative Cloud and Experience Cloud bundles boost perceived value and muddle straightforward price comparisons, letting buyers press for module-level discounts when they adopt only parts of the suite. In 2024 Adobe leaned on bundling to cut churn and create upsell paths amid a reported FY2024 revenue of $22.45 billion. Usage analytics drive targeted renewal offers and price differentiation to retain high-value accounts.
Enterprise buyers wield leverage as leading creative platform scales revenue and assets
Enterprise buyers exert strong leverage—Adobe reported fiscal 2024 revenue of about $20.99B and ~26.3M Creative Cloud paid subscribers, driving enterprise discounts and multiyear commitments while competition from Salesforce and Microsoft tightens terms. Price-sensitive SMBs and individuals face churn risk versus lower‑cost rivals (Canva 100M users by 2022, Affinity, DaVinci). Proprietary formats and ~200M Adobe Stock assets raise switching costs, but demand for rapid AI/feature velocity and bundle-level negotiations sustains buyer bargaining power.
| Metric | 2024 | Impact |
|---|---|---|
| Revenue | $20.99B | Enterprise negotiation |
| Creative Cloud subs | ~26.3M | Lock‑in |
| Adobe Stock | ~200M assets | Switching cost |
Same Document Delivered
Adobe Porter's Five Forces Analysis
This preview shows the exact Adobe Porter’s Five Forces analysis you’ll receive immediately after purchase—no placeholders or mockups. It presents a full assessment of competitive rivalry, supplier and buyer power, threats of entry and substitutes, and strategic implications. The file is fully formatted and ready to download.











