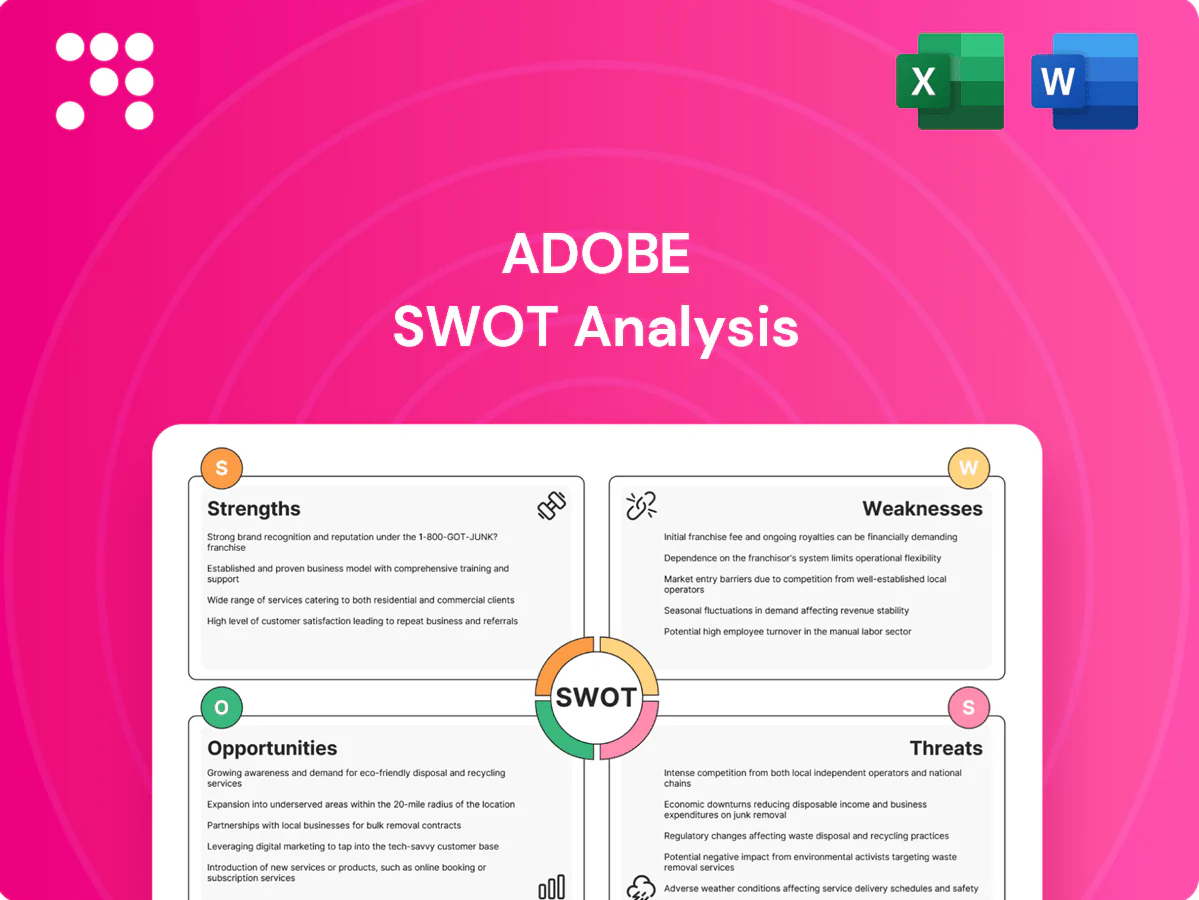
Adobe SWOT Analysis

Your Strategic Toolkit Starts Here
Adobe’s market-leading creative suite, strong subscription revenue, and expanding cloud platform fuel steady growth, but intensifying competition, pricing sensitivity, and integration risks could impact momentum; regulatory and macro pressures add complexity. Want the full story—purchase the complete SWOT analysis for an editable Word and Excel report with research-backed insights and strategic takeaways to support investment or planning.
Strengths

Category-leading creative ecosystem
Adobe Creative Cloud dominates pro-grade design, photo, video and web tools with deep cross-app workflows across Photoshop, Illustrator, Premiere Pro, After Effects and Lightroom; Creative Cloud drove roughly $13.9B of Digital Media revenue in FY2024 and serves about 32 million subscribers, while cloud libraries, fonts and shared assets create a network effect that raises productivity and substantial switching costs.
Powerful brand and community moat
Adobe is synonymous with creative work, backed by robust communities, tutorials, plug‑ins and certification programs that support over 20 million Creative Cloud subscribers worldwide. Industry‑standard status drives employer demand and aligns with education pipelines, sustaining hiring preference for Adobe skills. Extensive user‑generated resources lower adoption friction, increase stickiness, and justify premium pricing and durable brand equity.

Recurring revenue and strong unit economics
Adobe's subscription-first model generates predictable cash flows and industry-leading gross margins near 88%, supporting stable free cash flow. A large installed base sustains best-in-class net retention above 120% through continuous product updates. Cross-cloud upsells across Creative, Document and Experience Clouds drive ARPU expansion. Scale funds sustained R&D and AI investment, with R&D spend around 12–13% of revenue.

PDF/Acrobat standards and workflow penetration
PDF is the de facto global standard (ISO 32000-1 in 2008; PDF 2.0 ISO 32000-2 in 2017), with Acrobat (since 1993) and Document Cloud (launched 2015) anchoring creation, e-signature and archival workflows across OS, browsers and enterprises, driving durable demand and cross-sell into Adobe’s subscription ecosystem.
- Standardization: ISO 32000
- Longevity: Acrobat since 1993
- Cloud anchor: Document Cloud (2015)
- Ubiquity: deep OS/browser/enterprise integrations
End-to-end customer experience stack
Experience Cloud combines analytics, content management, personalization and commerce to deliver a full-funnel digital experience; unified data and content pipelines enable closed-loop marketing execution while Creative Cloud integration accelerates content velocity and governance. Adobe was named a Leader in Gartner’s 2024 Magic Quadrant for Digital Experience Platforms, underscoring this enterprise differentiation.
- Experience Cloud: analytics, CMS, personalization, commerce
- Closed-loop marketing via unified data/content pipelines
- Creative tools integration: faster content velocity + governance
- Validated leader: Gartner DXP 2024
Leading creative platform: $13.9B Digital Media, ~32M subs, >120% retention
Adobe's Creative Cloud drove $13.9B Digital Media in FY2024 with ~32M subs, creating strong network effects and switching costs. Acrobat/PDF remain global standards across OS and enterprises. Subscription model yields ~88% gross margin, >120% net retention and R&D ~12–13%, and Adobe was Gartner DXP Leader 2024.
| Metric | Value |
|---|---|
| Digital Media FY2024 | $13.9B |
| Subscribers | ~32M |
| Gross margin | ~88% |
| Net retention | >120% |
| R&D | 12–13% |
What is included in the product
 Detailed Word Document
Provides a concise SWOT analysis of Adobe, outlining its core strengths in creative and cloud platforms, weaknesses like subscription dependency, opportunities from AI, digital experience expansion and new markets, and threats including intense competition, regulatory risks, and cyber vulnerabilities.

 Customizable Excel Spreadsheet
Provides a concise Adobe SWOT matrix for fast, visual strategy alignment, relieving analysis bottlenecks across product, marketing, and enterprise teams.
Weaknesses

Premium pricing and perception of complexity
Adobe's All Apps plan at about US$54.99/month (student pricing US$19.99/month) places it well above many low-cost rivals, deterring hobbyists, students and cost-sensitive SMBs. Pro-grade depth yields steep learning curves that slow onboarding and increase churn despite Adobe's roughly US$17.6B FY2024 revenue. Complexity pushes some users toward simpler, template-first tools, constraining low-end TAM expansion.
Heavy reliance on subscription model
Adobe's heavy reliance on subscriptions—driving the bulk of FY2024 revenue of $20.84 billion—makes ARPU and retention sensitive to macro cycles and corporate budget scrutiny, amplifying volatility in renewals. Price increases risk accelerating churn and reputational pushback, while subscription fatigue limits additional monetization levers and raises execution risk in migrations.

Integration sprawl and product overlap
Multiple clouds and overlapping modules in Adobe’s stack create confusing packaging and adoption hurdles, despite Adobe reporting roughly $20.9B revenue in FY2024. Overlapping features across apps complicate buyer decisions and support, leading enterprises to underutilize entitlements—industry estimates suggest up to 30% of cloud seats go unused—raising support costs and extending deployment timelines by weeks to months.

Slower inorganic expansion post-regulatory headwinds
Regulatory resistance to large design/MXP deals, exemplified by Adobe's proposed $20 billion Figma acquisition announced in September 2022, has constrained acquisition-led growth and drawn prolonged antitrust scrutiny from UK, EU and US authorities. Contested transactions consumed senior leadership bandwidth and legal resources, reducing M&A flexibility and slowing entry into fast-growing adjacencies. Organic builds may lag nimbler niche competitors.
Enterprise sales cycles and services intensity
Experience Cloud deals frequently involve multi-quarter enterprise sales cycles, proofs-of-concept and partner-led implementations, which can delay revenue recognition and compress near-term margin realization.
Implementation complexity and reliance on systems integrator capacity and customer change management create variability in bookings and adoption velocity, often stretching projects beyond initial 6–12 month timelines.
- Long sales cycles: multi-quarter timelines
- PoCs extend time-to-revenue
- Dependence on SI ecosystem capacity
- Customer change management drives adoption variability
High All Apps price fuels churn despite US$20.84B FY2024; ~30% idle
High All Apps pricing (US$54.99/month; student US$19.99) and pro-grade complexity raise churn despite FY2024 revenue of US$20.84B. Heavy subscription dependency makes ARPU and renewals macro‑sensitive, while industry estimates show ~30% cloud-seat underutilization. Multi-quarter sales, 6–12+ month implementations and prolonged antitrust review (Figma US$20B, Sep 2022) limit M&A agility and low-end TAM growth.
| Metric | Value |
|---|---|
| FY2024 revenue | US$20.84B |
| All Apps price | US$54.99/mo |
| Student price | US$19.99/mo |
| Unused cloud seats | ~30% |
| Implementation | 6–12+ months |
| Figma deal | US$20B (Sep 2022) |
Preview the Actual Deliverable
Adobe SWOT Analysis
This is the actual SWOT analysis document you’ll receive upon purchase—no surprises, just professional quality. The preview below is taken directly from the full SWOT report you'll get, with the same structure and insights. Once purchased, you’ll receive the complete, editable version ready for download and use.

Your Strategic Toolkit Starts Here
Adobe’s market-leading creative suite, strong subscription revenue, and expanding cloud platform fuel steady growth, but intensifying competition, pricing sensitivity, and integration risks could impact momentum; regulatory and macro pressures add complexity. Want the full story—purchase the complete SWOT analysis for an editable Word and Excel report with research-backed insights and strategic takeaways to support investment or planning.
Strengths
Category-leading creative ecosystem
Adobe Creative Cloud dominates pro-grade design, photo, video and web tools with deep cross-app workflows across Photoshop, Illustrator, Premiere Pro, After Effects and Lightroom; Creative Cloud drove roughly $13.9B of Digital Media revenue in FY2024 and serves about 32 million subscribers, while cloud libraries, fonts and shared assets create a network effect that raises productivity and substantial switching costs.
Powerful brand and community moat
Adobe is synonymous with creative work, backed by robust communities, tutorials, plug‑ins and certification programs that support over 20 million Creative Cloud subscribers worldwide. Industry‑standard status drives employer demand and aligns with education pipelines, sustaining hiring preference for Adobe skills. Extensive user‑generated resources lower adoption friction, increase stickiness, and justify premium pricing and durable brand equity.
Recurring revenue and strong unit economics
Adobe's subscription-first model generates predictable cash flows and industry-leading gross margins near 88%, supporting stable free cash flow. A large installed base sustains best-in-class net retention above 120% through continuous product updates. Cross-cloud upsells across Creative, Document and Experience Clouds drive ARPU expansion. Scale funds sustained R&D and AI investment, with R&D spend around 12–13% of revenue.
PDF/Acrobat standards and workflow penetration
PDF is the de facto global standard (ISO 32000-1 in 2008; PDF 2.0 ISO 32000-2 in 2017), with Acrobat (since 1993) and Document Cloud (launched 2015) anchoring creation, e-signature and archival workflows across OS, browsers and enterprises, driving durable demand and cross-sell into Adobe’s subscription ecosystem.
- Standardization: ISO 32000
- Longevity: Acrobat since 1993
- Cloud anchor: Document Cloud (2015)
- Ubiquity: deep OS/browser/enterprise integrations
End-to-end customer experience stack
Experience Cloud combines analytics, content management, personalization and commerce to deliver a full-funnel digital experience; unified data and content pipelines enable closed-loop marketing execution while Creative Cloud integration accelerates content velocity and governance. Adobe was named a Leader in Gartner’s 2024 Magic Quadrant for Digital Experience Platforms, underscoring this enterprise differentiation.
- Experience Cloud: analytics, CMS, personalization, commerce
- Closed-loop marketing via unified data/content pipelines
- Creative tools integration: faster content velocity + governance
- Validated leader: Gartner DXP 2024
Leading creative platform: $13.9B Digital Media, ~32M subs, >120% retention
Adobe's Creative Cloud drove $13.9B Digital Media in FY2024 with ~32M subs, creating strong network effects and switching costs. Acrobat/PDF remain global standards across OS and enterprises. Subscription model yields ~88% gross margin, >120% net retention and R&D ~12–13%, and Adobe was Gartner DXP Leader 2024.
| Metric | Value |
|---|---|
| Digital Media FY2024 | $13.9B |
| Subscribers | ~32M |
| Gross margin | ~88% |
| Net retention | >120% |
| R&D | 12–13% |
What is included in the product
Detailed Word Document
Provides a concise SWOT analysis of Adobe, outlining its core strengths in creative and cloud platforms, weaknesses like subscription dependency, opportunities from AI, digital experience expansion and new markets, and threats including intense competition, regulatory risks, and cyber vulnerabilities.
Customizable Excel Spreadsheet
Provides a concise Adobe SWOT matrix for fast, visual strategy alignment, relieving analysis bottlenecks across product, marketing, and enterprise teams.
Weaknesses
Premium pricing and perception of complexity
Adobe's All Apps plan at about US$54.99/month (student pricing US$19.99/month) places it well above many low-cost rivals, deterring hobbyists, students and cost-sensitive SMBs. Pro-grade depth yields steep learning curves that slow onboarding and increase churn despite Adobe's roughly US$17.6B FY2024 revenue. Complexity pushes some users toward simpler, template-first tools, constraining low-end TAM expansion.
Heavy reliance on subscription model
Adobe's heavy reliance on subscriptions—driving the bulk of FY2024 revenue of $20.84 billion—makes ARPU and retention sensitive to macro cycles and corporate budget scrutiny, amplifying volatility in renewals. Price increases risk accelerating churn and reputational pushback, while subscription fatigue limits additional monetization levers and raises execution risk in migrations.
Integration sprawl and product overlap
Multiple clouds and overlapping modules in Adobe’s stack create confusing packaging and adoption hurdles, despite Adobe reporting roughly $20.9B revenue in FY2024. Overlapping features across apps complicate buyer decisions and support, leading enterprises to underutilize entitlements—industry estimates suggest up to 30% of cloud seats go unused—raising support costs and extending deployment timelines by weeks to months.
Slower inorganic expansion post-regulatory headwinds
Regulatory resistance to large design/MXP deals, exemplified by Adobe's proposed $20 billion Figma acquisition announced in September 2022, has constrained acquisition-led growth and drawn prolonged antitrust scrutiny from UK, EU and US authorities. Contested transactions consumed senior leadership bandwidth and legal resources, reducing M&A flexibility and slowing entry into fast-growing adjacencies. Organic builds may lag nimbler niche competitors.
Enterprise sales cycles and services intensity
Experience Cloud deals frequently involve multi-quarter enterprise sales cycles, proofs-of-concept and partner-led implementations, which can delay revenue recognition and compress near-term margin realization.
Implementation complexity and reliance on systems integrator capacity and customer change management create variability in bookings and adoption velocity, often stretching projects beyond initial 6–12 month timelines.
- Long sales cycles: multi-quarter timelines
- PoCs extend time-to-revenue
- Dependence on SI ecosystem capacity
- Customer change management drives adoption variability
High All Apps price fuels churn despite US$20.84B FY2024; ~30% idle
High All Apps pricing (US$54.99/month; student US$19.99) and pro-grade complexity raise churn despite FY2024 revenue of US$20.84B. Heavy subscription dependency makes ARPU and renewals macro‑sensitive, while industry estimates show ~30% cloud-seat underutilization. Multi-quarter sales, 6–12+ month implementations and prolonged antitrust review (Figma US$20B, Sep 2022) limit M&A agility and low-end TAM growth.
| Metric | Value |
|---|---|
| FY2024 revenue | US$20.84B |
| All Apps price | US$54.99/mo |
| Student price | US$19.99/mo |
| Unused cloud seats | ~30% |
| Implementation | 6–12+ months |
| Figma deal | US$20B (Sep 2022) |
Preview the Actual Deliverable
Adobe SWOT Analysis
This is the actual SWOT analysis document you’ll receive upon purchase—no surprises, just professional quality. The preview below is taken directly from the full SWOT report you'll get, with the same structure and insights. Once purchased, you’ll receive the complete, editable version ready for download and use.
Original: $10.00
-65%$10.00
$3.50Description
Your Strategic Toolkit Starts Here
Adobe’s market-leading creative suite, strong subscription revenue, and expanding cloud platform fuel steady growth, but intensifying competition, pricing sensitivity, and integration risks could impact momentum; regulatory and macro pressures add complexity. Want the full story—purchase the complete SWOT analysis for an editable Word and Excel report with research-backed insights and strategic takeaways to support investment or planning.
Strengths
Category-leading creative ecosystem
Adobe Creative Cloud dominates pro-grade design, photo, video and web tools with deep cross-app workflows across Photoshop, Illustrator, Premiere Pro, After Effects and Lightroom; Creative Cloud drove roughly $13.9B of Digital Media revenue in FY2024 and serves about 32 million subscribers, while cloud libraries, fonts and shared assets create a network effect that raises productivity and substantial switching costs.
Powerful brand and community moat
Adobe is synonymous with creative work, backed by robust communities, tutorials, plug‑ins and certification programs that support over 20 million Creative Cloud subscribers worldwide. Industry‑standard status drives employer demand and aligns with education pipelines, sustaining hiring preference for Adobe skills. Extensive user‑generated resources lower adoption friction, increase stickiness, and justify premium pricing and durable brand equity.
Recurring revenue and strong unit economics
Adobe's subscription-first model generates predictable cash flows and industry-leading gross margins near 88%, supporting stable free cash flow. A large installed base sustains best-in-class net retention above 120% through continuous product updates. Cross-cloud upsells across Creative, Document and Experience Clouds drive ARPU expansion. Scale funds sustained R&D and AI investment, with R&D spend around 12–13% of revenue.
PDF/Acrobat standards and workflow penetration
PDF is the de facto global standard (ISO 32000-1 in 2008; PDF 2.0 ISO 32000-2 in 2017), with Acrobat (since 1993) and Document Cloud (launched 2015) anchoring creation, e-signature and archival workflows across OS, browsers and enterprises, driving durable demand and cross-sell into Adobe’s subscription ecosystem.
- Standardization: ISO 32000
- Longevity: Acrobat since 1993
- Cloud anchor: Document Cloud (2015)
- Ubiquity: deep OS/browser/enterprise integrations
End-to-end customer experience stack
Experience Cloud combines analytics, content management, personalization and commerce to deliver a full-funnel digital experience; unified data and content pipelines enable closed-loop marketing execution while Creative Cloud integration accelerates content velocity and governance. Adobe was named a Leader in Gartner’s 2024 Magic Quadrant for Digital Experience Platforms, underscoring this enterprise differentiation.
- Experience Cloud: analytics, CMS, personalization, commerce
- Closed-loop marketing via unified data/content pipelines
- Creative tools integration: faster content velocity + governance
- Validated leader: Gartner DXP 2024
Leading creative platform: $13.9B Digital Media, ~32M subs, >120% retention
Adobe's Creative Cloud drove $13.9B Digital Media in FY2024 with ~32M subs, creating strong network effects and switching costs. Acrobat/PDF remain global standards across OS and enterprises. Subscription model yields ~88% gross margin, >120% net retention and R&D ~12–13%, and Adobe was Gartner DXP Leader 2024.
| Metric | Value |
|---|---|
| Digital Media FY2024 | $13.9B |
| Subscribers | ~32M |
| Gross margin | ~88% |
| Net retention | >120% |
| R&D | 12–13% |
What is included in the product
Detailed Word Document
Provides a concise SWOT analysis of Adobe, outlining its core strengths in creative and cloud platforms, weaknesses like subscription dependency, opportunities from AI, digital experience expansion and new markets, and threats including intense competition, regulatory risks, and cyber vulnerabilities.
Customizable Excel Spreadsheet
Provides a concise Adobe SWOT matrix for fast, visual strategy alignment, relieving analysis bottlenecks across product, marketing, and enterprise teams.
Weaknesses
Premium pricing and perception of complexity
Adobe's All Apps plan at about US$54.99/month (student pricing US$19.99/month) places it well above many low-cost rivals, deterring hobbyists, students and cost-sensitive SMBs. Pro-grade depth yields steep learning curves that slow onboarding and increase churn despite Adobe's roughly US$17.6B FY2024 revenue. Complexity pushes some users toward simpler, template-first tools, constraining low-end TAM expansion.
Heavy reliance on subscription model
Adobe's heavy reliance on subscriptions—driving the bulk of FY2024 revenue of $20.84 billion—makes ARPU and retention sensitive to macro cycles and corporate budget scrutiny, amplifying volatility in renewals. Price increases risk accelerating churn and reputational pushback, while subscription fatigue limits additional monetization levers and raises execution risk in migrations.
Integration sprawl and product overlap
Multiple clouds and overlapping modules in Adobe’s stack create confusing packaging and adoption hurdles, despite Adobe reporting roughly $20.9B revenue in FY2024. Overlapping features across apps complicate buyer decisions and support, leading enterprises to underutilize entitlements—industry estimates suggest up to 30% of cloud seats go unused—raising support costs and extending deployment timelines by weeks to months.
Slower inorganic expansion post-regulatory headwinds
Regulatory resistance to large design/MXP deals, exemplified by Adobe's proposed $20 billion Figma acquisition announced in September 2022, has constrained acquisition-led growth and drawn prolonged antitrust scrutiny from UK, EU and US authorities. Contested transactions consumed senior leadership bandwidth and legal resources, reducing M&A flexibility and slowing entry into fast-growing adjacencies. Organic builds may lag nimbler niche competitors.
Enterprise sales cycles and services intensity
Experience Cloud deals frequently involve multi-quarter enterprise sales cycles, proofs-of-concept and partner-led implementations, which can delay revenue recognition and compress near-term margin realization.
Implementation complexity and reliance on systems integrator capacity and customer change management create variability in bookings and adoption velocity, often stretching projects beyond initial 6–12 month timelines.
- Long sales cycles: multi-quarter timelines
- PoCs extend time-to-revenue
- Dependence on SI ecosystem capacity
- Customer change management drives adoption variability
High All Apps price fuels churn despite US$20.84B FY2024; ~30% idle
High All Apps pricing (US$54.99/month; student US$19.99) and pro-grade complexity raise churn despite FY2024 revenue of US$20.84B. Heavy subscription dependency makes ARPU and renewals macro‑sensitive, while industry estimates show ~30% cloud-seat underutilization. Multi-quarter sales, 6–12+ month implementations and prolonged antitrust review (Figma US$20B, Sep 2022) limit M&A agility and low-end TAM growth.
| Metric | Value |
|---|---|
| FY2024 revenue | US$20.84B |
| All Apps price | US$54.99/mo |
| Student price | US$19.99/mo |
| Unused cloud seats | ~30% |
| Implementation | 6–12+ months |
| Figma deal | US$20B (Sep 2022) |
Preview the Actual Deliverable
Adobe SWOT Analysis
This is the actual SWOT analysis document you’ll receive upon purchase—no surprises, just professional quality. The preview below is taken directly from the full SWOT report you'll get, with the same structure and insights. Once purchased, you’ll receive the complete, editable version ready for download and use.











