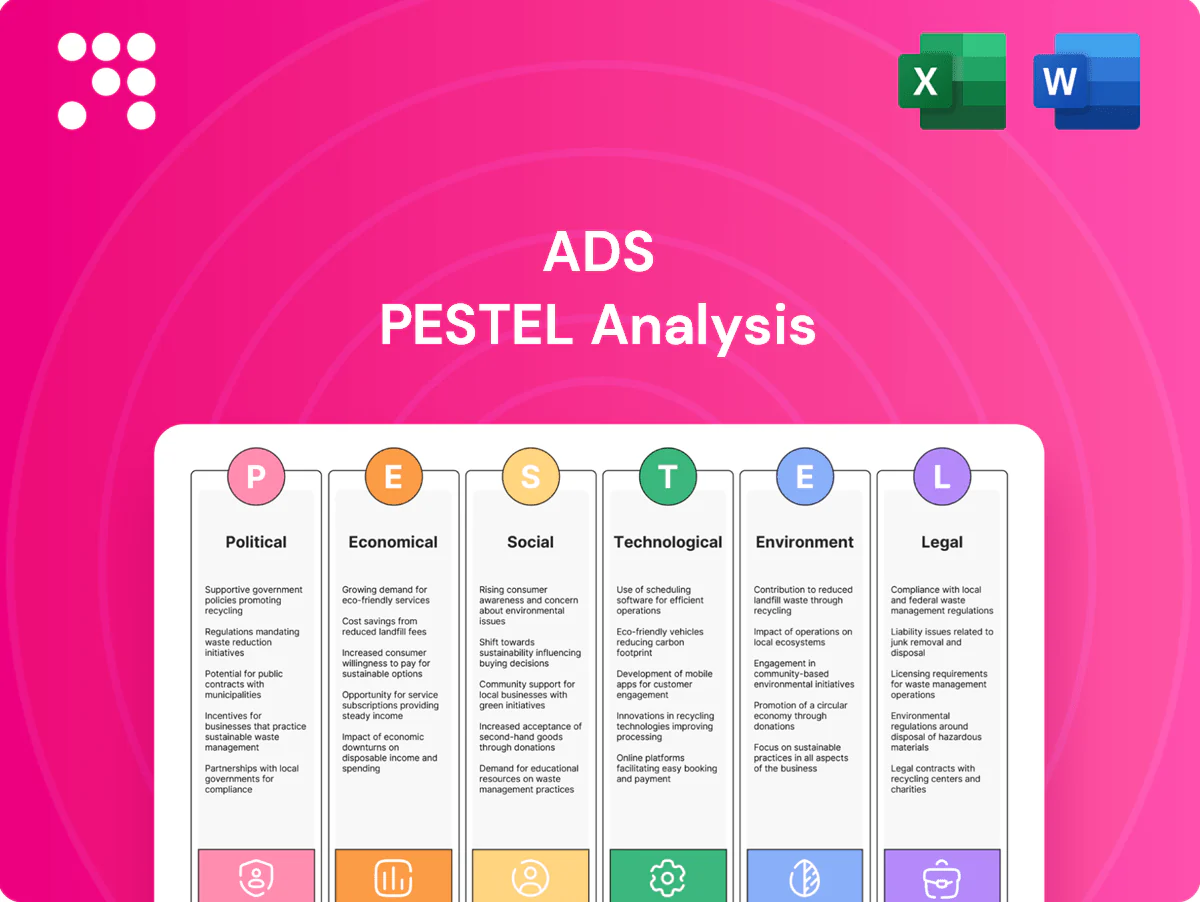
ADS PESTLE Analysis

Skip the Research. Get the Strategy.
Unlock strategic advantage with our PESTLE Analysis tailored for ADS—three to five sentences won't cover it all, but this summary highlights key political, economic, and technological forces shaping ADS's outlook. Ideal for investors and strategists, the full report delivers deep-dive insights, forecasts, and actionable recommendations. Purchase the complete PESTLE now to inform decisions and stay ahead of external risks and opportunities.
Political factors

Infrastructure funding
Federal, state and municipal budgets drive ADS pipelines: the Bipartisan Infrastructure Law totaled about 1.2 trillion USD with roughly 55 billion allocated for water, and US municipal bond issuance was about 530 billion USD in 2024. Multi‑year bills and bond programs provide demand visibility, but political shifts or fiscal tightening can delay awards and installations. Monitoring appropriations cycles and earmarks is critical for backlog planning.
Buy America rules
Buy America rules, strengthened by the Build America, Buy America Act (2021) and implemented under the Bipartisan Infrastructure Law, can favor U.S.-made thermoplastic pipes given $55 billion in water infrastructure funding tied to domestic sourcing. Clarifications on waivers, content thresholds and enforcement determine procurement eligibility. Compliance may raise input costs but shields market share from import competition, so ADS must align certifications and documentation to win government bids.

Permitting reform
Changes to environmental review timelines—commonly 3–5 years for major projects—directly affect ADS project starts and cash flow assumptions.
Streamlined permitting can cut approvals by months or years, accelerating drainage upgrades and flood mitigation deployments and improving ROI timing.
Conversely, stricter reviews or local opposition raise compliance costs and delay rollouts; ADS benefits from predictable, timely approvals to smooth demand.

Trade and tariffs
Tariffs on resins, additives or machinery (commonly 5–25% across major markets) materially raise ADS cost structures and cut margins; polyethylene and polypropylene supply saw volatility with spot polyethylene prices swinging up to ~40% y/y in 2021–24 during trade disruptions. Recent US-China and EU trade frictions have intermittently constrained feedstock flows, pushing input inflation. Hedging and diversified sourcing cut policy-driven procurement risk and cap pass-through to customers.
- Tariff range: 5–25%
- PE/PP price volatility: ~40% y/y (2021–24)
- Mitigants: hedging, multi-region suppliers
Agriculture policy
Farm bill conservation and drainage programs, anchored by USDA programs and the 24 million-acre CRP enrollment cap, materially affect ag-tile demand; the 2022 Census of Agriculture (released 2024) guides regional program targeting. Cost-share initiatives (EQIP/CRP/EFRP) commonly cover up to 50–75% of installation costs, catalyzing field drainage investments. Shifts in wetlands or water-retention policy tighten installations in sensitive zones, so ADS must manage regional compliance while serving growers.
- Farm bill influence: CRP cap 24 million acres
- Data source: 2022 Census of Agriculture (released 2024)
- Cost-share range: ~50–75%
- Risk: stricter wetlands/water-retention rules constrain installs
BIL and muni funding power ADS pipelines; Buy America, tariffs, PE/PP swings squeeze margins
Federal funding (BIL ~1.2T; ~$55B water) and US muni bonds (~$530B 2024) drive ADS pipelines; political shifts or fiscal tightening can delay awards. Buy America/BAAA boosts US-made pipes but raises input costs. Tariffs 5–25% and PE/PP spot swings ~40% y/y (2021–24) stress margins. Farm programs (CRP cap 24M acres; cost‑share 50–75%) affect ag-tile demand.
| Metric | Value |
|---|---|
| BIL water | $55B |
| Muni bonds 2024 | $530B |
| Tariffs | 5–25% |
| PE/PP vol | ~40% y/y |
| CRP cap | 24M acres |
What is included in the product
 Detailed Word Document
Explores how external macro-environmental factors uniquely affect ADS across six dimensions—Political, Economic, Social, Technological, Environmental, and Legal—providing data-backed, region-specific insights. Designed for executives, investors and strategists, it offers forward-looking analysis, detailed sub-points and clean formatting ready for plans or decks.

 Customizable Excel Spreadsheet
ADS PESTLE delivers a concise, visually segmented summary of external factors that can be dropped into presentations, annotated for local context, and easily shared across teams to streamline risk discussions and strategic planning.
Economic factors

Resin price volatility
HDPE and PP prices closely follow oil, gas and ethylene markets because ethylene feedstock is derived from naphtha/ethane, so feedstock swings rapidly transmit to resin costs. Resin often represents about 30-50% of packaging material cost, making margins sensitive to spot moves and supply shocks. Surcharges, index-linked pricing and higher recycled-content blends have been used to damp volatility, while procurement agility (shorter lead times, diversified suppliers) is essential to protect gross profit.
Construction cycle
Housing starts remain around 1.5M annualized in the US while nonresidential builds lag and municipal capex—bolstered by the $1.2 trillion Bipartisan Infrastructure Law—drives volume for ADS. High interest rates (30‑yr mortgage near 7% in 2024–25) damp private construction and delay projects. Public infrastructure spending is counter‑cyclical and can support demand. ADS should balance private, public, and maintenance channels to reduce cyclicality exposure.

Logistics and freight
Trucking capacity remained tight in 2024 with national utilization near 95%, while U.S. diesel averaged about 4.04 USD/gal in 2024 (EIA), both raising delivered cost and volatility. Pipes are bulky, making freight optimization crucial; routing analytics and near-customer plants cut miles and handling, trimming lead times by up to 20% in pilot programs. Regional distribution differences can shift landed cost by 15–30%, and freight normalization improves EBITDA leverage through steadier margins and lower working capital.

Labor market
Skilled trades shortages—NAHB 2024: 78% of builders report shortages—can slow ADS installations and reduce throughput; U.S. unemployment near 3.7% (mid-2025) and ~4% yoy wage growth push plant and contractor costs higher. Automation and training partnerships (apprenticeship upticks in 2024) can offset tight labor; reliable staffing underpins on-time delivery and quality.
- Skilled shortage: NAHB 78% (2024)
- Unemployment: ~3.7% (mid-2025)
- Wage inflation: ~4% YoY (2024–25)
- Mitigants: automation, apprenticeships
Capital availability
Credit conditions drive municipal bonding and developer financing; with the US federal funds rate at 5.25–5.50% in mid-2025 higher borrowing costs can defer stormwater upgrades and sitework, while strong customer balance sheets and leasing options enable projects to proceed; ADS CAPEX discipline preserves flexibility through cycles.
- Credit conditions: municipal bonding, developer financing
- Tight credit: delays stormwater/sitework
- Customer resilience: balance sheets, leasing
- ADS: disciplined CAPEX = flexibility
BIL and muni funding power ADS pipelines; Buy America, tariffs, PE/PP swings squeeze margins
Resin costs (30–50% of packaging) track oil/ethylene, creating margin sensitivity to feedstock swings. Private construction damped by 30‑yr mortgage ~7% (2024–25) while $1.2T infrastructure spending supports public demand. Truck utilization ~95% and diesel ~$4.04/gal (2024) raise delivered cost; unemployment ~3.7% and wage growth ~4% lift labor expense.
| Metric | Value (2024–25) |
|---|---|
| Resin share of cost | 30–50% |
| US housing starts | ~1.5M ann. |
| 30‑yr mortgage | ~7% |
| Truck util./diesel | 95% / $4.04/gal |
| Unemployment / wage | 3.7% / ~4% YoY |
| Fed funds | 5.25–5.50% |
Same Document Delivered
ADS PESTLE Analysis
The preview shown here is the exact ADS PESTLE Analysis document you’ll receive after purchase—fully formatted and ready to use. The layout, content, and structure visible are identical to the downloadable file. No placeholders or teasers—this is the final, professionally structured report you’ll own immediately after checkout.

Skip the Research. Get the Strategy.
Unlock strategic advantage with our PESTLE Analysis tailored for ADS—three to five sentences won't cover it all, but this summary highlights key political, economic, and technological forces shaping ADS's outlook. Ideal for investors and strategists, the full report delivers deep-dive insights, forecasts, and actionable recommendations. Purchase the complete PESTLE now to inform decisions and stay ahead of external risks and opportunities.
Political factors
Infrastructure funding
Federal, state and municipal budgets drive ADS pipelines: the Bipartisan Infrastructure Law totaled about 1.2 trillion USD with roughly 55 billion allocated for water, and US municipal bond issuance was about 530 billion USD in 2024. Multi‑year bills and bond programs provide demand visibility, but political shifts or fiscal tightening can delay awards and installations. Monitoring appropriations cycles and earmarks is critical for backlog planning.
Buy America rules
Buy America rules, strengthened by the Build America, Buy America Act (2021) and implemented under the Bipartisan Infrastructure Law, can favor U.S.-made thermoplastic pipes given $55 billion in water infrastructure funding tied to domestic sourcing. Clarifications on waivers, content thresholds and enforcement determine procurement eligibility. Compliance may raise input costs but shields market share from import competition, so ADS must align certifications and documentation to win government bids.
Permitting reform
Changes to environmental review timelines—commonly 3–5 years for major projects—directly affect ADS project starts and cash flow assumptions.
Streamlined permitting can cut approvals by months or years, accelerating drainage upgrades and flood mitigation deployments and improving ROI timing.
Conversely, stricter reviews or local opposition raise compliance costs and delay rollouts; ADS benefits from predictable, timely approvals to smooth demand.
Trade and tariffs
Tariffs on resins, additives or machinery (commonly 5–25% across major markets) materially raise ADS cost structures and cut margins; polyethylene and polypropylene supply saw volatility with spot polyethylene prices swinging up to ~40% y/y in 2021–24 during trade disruptions. Recent US-China and EU trade frictions have intermittently constrained feedstock flows, pushing input inflation. Hedging and diversified sourcing cut policy-driven procurement risk and cap pass-through to customers.
- Tariff range: 5–25%
- PE/PP price volatility: ~40% y/y (2021–24)
- Mitigants: hedging, multi-region suppliers
Agriculture policy
Farm bill conservation and drainage programs, anchored by USDA programs and the 24 million-acre CRP enrollment cap, materially affect ag-tile demand; the 2022 Census of Agriculture (released 2024) guides regional program targeting. Cost-share initiatives (EQIP/CRP/EFRP) commonly cover up to 50–75% of installation costs, catalyzing field drainage investments. Shifts in wetlands or water-retention policy tighten installations in sensitive zones, so ADS must manage regional compliance while serving growers.
- Farm bill influence: CRP cap 24 million acres
- Data source: 2022 Census of Agriculture (released 2024)
- Cost-share range: ~50–75%
- Risk: stricter wetlands/water-retention rules constrain installs
BIL and muni funding power ADS pipelines; Buy America, tariffs, PE/PP swings squeeze margins
Federal funding (BIL ~1.2T; ~$55B water) and US muni bonds (~$530B 2024) drive ADS pipelines; political shifts or fiscal tightening can delay awards. Buy America/BAAA boosts US-made pipes but raises input costs. Tariffs 5–25% and PE/PP spot swings ~40% y/y (2021–24) stress margins. Farm programs (CRP cap 24M acres; cost‑share 50–75%) affect ag-tile demand.
| Metric | Value |
|---|---|
| BIL water | $55B |
| Muni bonds 2024 | $530B |
| Tariffs | 5–25% |
| PE/PP vol | ~40% y/y |
| CRP cap | 24M acres |
What is included in the product
Detailed Word Document
Explores how external macro-environmental factors uniquely affect ADS across six dimensions—Political, Economic, Social, Technological, Environmental, and Legal—providing data-backed, region-specific insights. Designed for executives, investors and strategists, it offers forward-looking analysis, detailed sub-points and clean formatting ready for plans or decks.
Customizable Excel Spreadsheet
ADS PESTLE delivers a concise, visually segmented summary of external factors that can be dropped into presentations, annotated for local context, and easily shared across teams to streamline risk discussions and strategic planning.
Economic factors
Resin price volatility
HDPE and PP prices closely follow oil, gas and ethylene markets because ethylene feedstock is derived from naphtha/ethane, so feedstock swings rapidly transmit to resin costs. Resin often represents about 30-50% of packaging material cost, making margins sensitive to spot moves and supply shocks. Surcharges, index-linked pricing and higher recycled-content blends have been used to damp volatility, while procurement agility (shorter lead times, diversified suppliers) is essential to protect gross profit.
Construction cycle
Housing starts remain around 1.5M annualized in the US while nonresidential builds lag and municipal capex—bolstered by the $1.2 trillion Bipartisan Infrastructure Law—drives volume for ADS. High interest rates (30‑yr mortgage near 7% in 2024–25) damp private construction and delay projects. Public infrastructure spending is counter‑cyclical and can support demand. ADS should balance private, public, and maintenance channels to reduce cyclicality exposure.
Logistics and freight
Trucking capacity remained tight in 2024 with national utilization near 95%, while U.S. diesel averaged about 4.04 USD/gal in 2024 (EIA), both raising delivered cost and volatility. Pipes are bulky, making freight optimization crucial; routing analytics and near-customer plants cut miles and handling, trimming lead times by up to 20% in pilot programs. Regional distribution differences can shift landed cost by 15–30%, and freight normalization improves EBITDA leverage through steadier margins and lower working capital.
Labor market
Skilled trades shortages—NAHB 2024: 78% of builders report shortages—can slow ADS installations and reduce throughput; U.S. unemployment near 3.7% (mid-2025) and ~4% yoy wage growth push plant and contractor costs higher. Automation and training partnerships (apprenticeship upticks in 2024) can offset tight labor; reliable staffing underpins on-time delivery and quality.
- Skilled shortage: NAHB 78% (2024)
- Unemployment: ~3.7% (mid-2025)
- Wage inflation: ~4% YoY (2024–25)
- Mitigants: automation, apprenticeships
Capital availability
Credit conditions drive municipal bonding and developer financing; with the US federal funds rate at 5.25–5.50% in mid-2025 higher borrowing costs can defer stormwater upgrades and sitework, while strong customer balance sheets and leasing options enable projects to proceed; ADS CAPEX discipline preserves flexibility through cycles.
- Credit conditions: municipal bonding, developer financing
- Tight credit: delays stormwater/sitework
- Customer resilience: balance sheets, leasing
- ADS: disciplined CAPEX = flexibility
BIL and muni funding power ADS pipelines; Buy America, tariffs, PE/PP swings squeeze margins
Resin costs (30–50% of packaging) track oil/ethylene, creating margin sensitivity to feedstock swings. Private construction damped by 30‑yr mortgage ~7% (2024–25) while $1.2T infrastructure spending supports public demand. Truck utilization ~95% and diesel ~$4.04/gal (2024) raise delivered cost; unemployment ~3.7% and wage growth ~4% lift labor expense.
| Metric | Value (2024–25) |
|---|---|
| Resin share of cost | 30–50% |
| US housing starts | ~1.5M ann. |
| 30‑yr mortgage | ~7% |
| Truck util./diesel | 95% / $4.04/gal |
| Unemployment / wage | 3.7% / ~4% YoY |
| Fed funds | 5.25–5.50% |
Same Document Delivered
ADS PESTLE Analysis
The preview shown here is the exact ADS PESTLE Analysis document you’ll receive after purchase—fully formatted and ready to use. The layout, content, and structure visible are identical to the downloadable file. No placeholders or teasers—this is the final, professionally structured report you’ll own immediately after checkout.
Original: $10.00
-65%$10.00
$3.50Description
Skip the Research. Get the Strategy.
Unlock strategic advantage with our PESTLE Analysis tailored for ADS—three to five sentences won't cover it all, but this summary highlights key political, economic, and technological forces shaping ADS's outlook. Ideal for investors and strategists, the full report delivers deep-dive insights, forecasts, and actionable recommendations. Purchase the complete PESTLE now to inform decisions and stay ahead of external risks and opportunities.
Political factors
Infrastructure funding
Federal, state and municipal budgets drive ADS pipelines: the Bipartisan Infrastructure Law totaled about 1.2 trillion USD with roughly 55 billion allocated for water, and US municipal bond issuance was about 530 billion USD in 2024. Multi‑year bills and bond programs provide demand visibility, but political shifts or fiscal tightening can delay awards and installations. Monitoring appropriations cycles and earmarks is critical for backlog planning.
Buy America rules
Buy America rules, strengthened by the Build America, Buy America Act (2021) and implemented under the Bipartisan Infrastructure Law, can favor U.S.-made thermoplastic pipes given $55 billion in water infrastructure funding tied to domestic sourcing. Clarifications on waivers, content thresholds and enforcement determine procurement eligibility. Compliance may raise input costs but shields market share from import competition, so ADS must align certifications and documentation to win government bids.
Permitting reform
Changes to environmental review timelines—commonly 3–5 years for major projects—directly affect ADS project starts and cash flow assumptions.
Streamlined permitting can cut approvals by months or years, accelerating drainage upgrades and flood mitigation deployments and improving ROI timing.
Conversely, stricter reviews or local opposition raise compliance costs and delay rollouts; ADS benefits from predictable, timely approvals to smooth demand.
Trade and tariffs
Tariffs on resins, additives or machinery (commonly 5–25% across major markets) materially raise ADS cost structures and cut margins; polyethylene and polypropylene supply saw volatility with spot polyethylene prices swinging up to ~40% y/y in 2021–24 during trade disruptions. Recent US-China and EU trade frictions have intermittently constrained feedstock flows, pushing input inflation. Hedging and diversified sourcing cut policy-driven procurement risk and cap pass-through to customers.
- Tariff range: 5–25%
- PE/PP price volatility: ~40% y/y (2021–24)
- Mitigants: hedging, multi-region suppliers
Agriculture policy
Farm bill conservation and drainage programs, anchored by USDA programs and the 24 million-acre CRP enrollment cap, materially affect ag-tile demand; the 2022 Census of Agriculture (released 2024) guides regional program targeting. Cost-share initiatives (EQIP/CRP/EFRP) commonly cover up to 50–75% of installation costs, catalyzing field drainage investments. Shifts in wetlands or water-retention policy tighten installations in sensitive zones, so ADS must manage regional compliance while serving growers.
- Farm bill influence: CRP cap 24 million acres
- Data source: 2022 Census of Agriculture (released 2024)
- Cost-share range: ~50–75%
- Risk: stricter wetlands/water-retention rules constrain installs
BIL and muni funding power ADS pipelines; Buy America, tariffs, PE/PP swings squeeze margins
Federal funding (BIL ~1.2T; ~$55B water) and US muni bonds (~$530B 2024) drive ADS pipelines; political shifts or fiscal tightening can delay awards. Buy America/BAAA boosts US-made pipes but raises input costs. Tariffs 5–25% and PE/PP spot swings ~40% y/y (2021–24) stress margins. Farm programs (CRP cap 24M acres; cost‑share 50–75%) affect ag-tile demand.
| Metric | Value |
|---|---|
| BIL water | $55B |
| Muni bonds 2024 | $530B |
| Tariffs | 5–25% |
| PE/PP vol | ~40% y/y |
| CRP cap | 24M acres |
What is included in the product
Detailed Word Document
Explores how external macro-environmental factors uniquely affect ADS across six dimensions—Political, Economic, Social, Technological, Environmental, and Legal—providing data-backed, region-specific insights. Designed for executives, investors and strategists, it offers forward-looking analysis, detailed sub-points and clean formatting ready for plans or decks.
Customizable Excel Spreadsheet
ADS PESTLE delivers a concise, visually segmented summary of external factors that can be dropped into presentations, annotated for local context, and easily shared across teams to streamline risk discussions and strategic planning.
Economic factors
Resin price volatility
HDPE and PP prices closely follow oil, gas and ethylene markets because ethylene feedstock is derived from naphtha/ethane, so feedstock swings rapidly transmit to resin costs. Resin often represents about 30-50% of packaging material cost, making margins sensitive to spot moves and supply shocks. Surcharges, index-linked pricing and higher recycled-content blends have been used to damp volatility, while procurement agility (shorter lead times, diversified suppliers) is essential to protect gross profit.
Construction cycle
Housing starts remain around 1.5M annualized in the US while nonresidential builds lag and municipal capex—bolstered by the $1.2 trillion Bipartisan Infrastructure Law—drives volume for ADS. High interest rates (30‑yr mortgage near 7% in 2024–25) damp private construction and delay projects. Public infrastructure spending is counter‑cyclical and can support demand. ADS should balance private, public, and maintenance channels to reduce cyclicality exposure.
Logistics and freight
Trucking capacity remained tight in 2024 with national utilization near 95%, while U.S. diesel averaged about 4.04 USD/gal in 2024 (EIA), both raising delivered cost and volatility. Pipes are bulky, making freight optimization crucial; routing analytics and near-customer plants cut miles and handling, trimming lead times by up to 20% in pilot programs. Regional distribution differences can shift landed cost by 15–30%, and freight normalization improves EBITDA leverage through steadier margins and lower working capital.
Labor market
Skilled trades shortages—NAHB 2024: 78% of builders report shortages—can slow ADS installations and reduce throughput; U.S. unemployment near 3.7% (mid-2025) and ~4% yoy wage growth push plant and contractor costs higher. Automation and training partnerships (apprenticeship upticks in 2024) can offset tight labor; reliable staffing underpins on-time delivery and quality.
- Skilled shortage: NAHB 78% (2024)
- Unemployment: ~3.7% (mid-2025)
- Wage inflation: ~4% YoY (2024–25)
- Mitigants: automation, apprenticeships
Capital availability
Credit conditions drive municipal bonding and developer financing; with the US federal funds rate at 5.25–5.50% in mid-2025 higher borrowing costs can defer stormwater upgrades and sitework, while strong customer balance sheets and leasing options enable projects to proceed; ADS CAPEX discipline preserves flexibility through cycles.
- Credit conditions: municipal bonding, developer financing
- Tight credit: delays stormwater/sitework
- Customer resilience: balance sheets, leasing
- ADS: disciplined CAPEX = flexibility
BIL and muni funding power ADS pipelines; Buy America, tariffs, PE/PP swings squeeze margins
Resin costs (30–50% of packaging) track oil/ethylene, creating margin sensitivity to feedstock swings. Private construction damped by 30‑yr mortgage ~7% (2024–25) while $1.2T infrastructure spending supports public demand. Truck utilization ~95% and diesel ~$4.04/gal (2024) raise delivered cost; unemployment ~3.7% and wage growth ~4% lift labor expense.
| Metric | Value (2024–25) |
|---|---|
| Resin share of cost | 30–50% |
| US housing starts | ~1.5M ann. |
| 30‑yr mortgage | ~7% |
| Truck util./diesel | 95% / $4.04/gal |
| Unemployment / wage | 3.7% / ~4% YoY |
| Fed funds | 5.25–5.50% |
Same Document Delivered
ADS PESTLE Analysis
The preview shown here is the exact ADS PESTLE Analysis document you’ll receive after purchase—fully formatted and ready to use. The layout, content, and structure visible are identical to the downloadable file. No placeholders or teasers—this is the final, professionally structured report you’ll own immediately after checkout.











