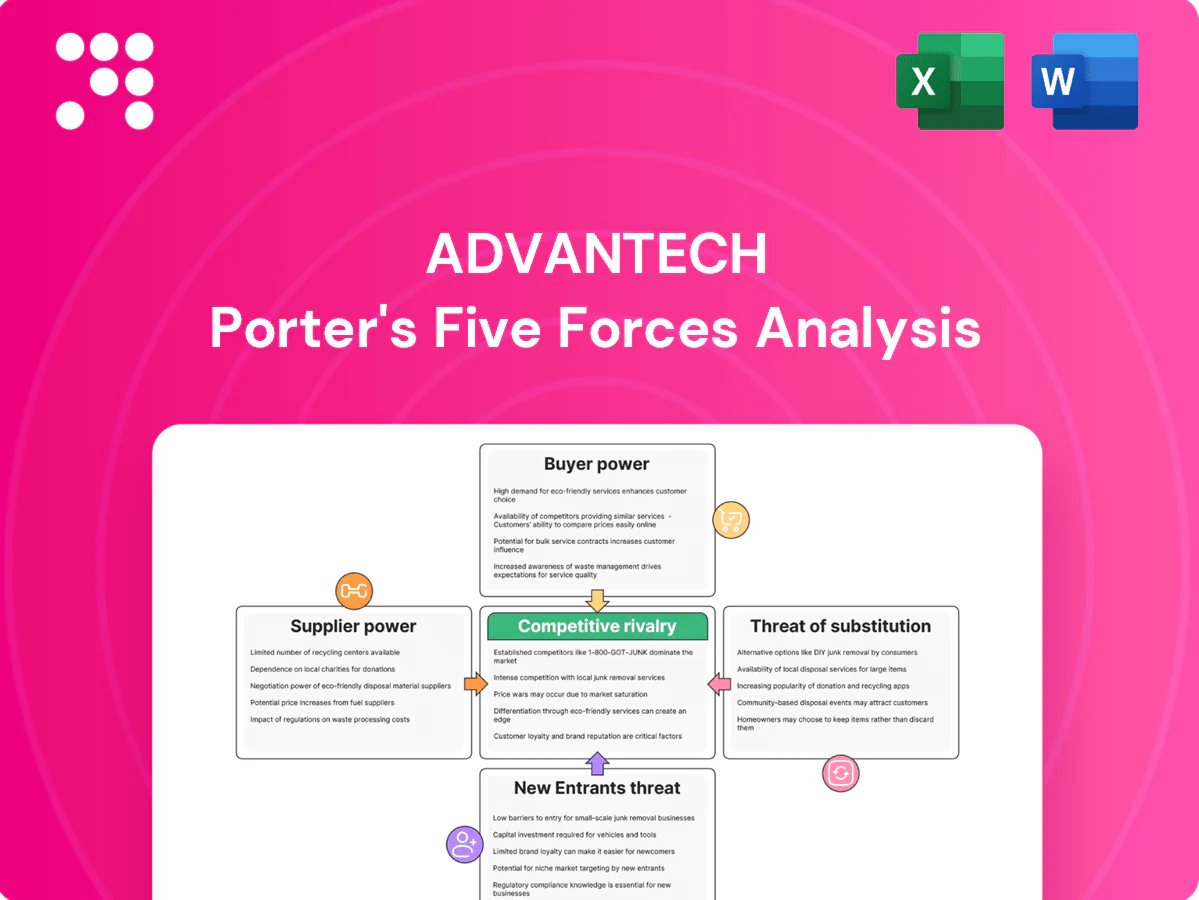
Advantech Porter's Five Forces Analysis

From Overview to Strategy Blueprint
Advantech faces intense rivalry from global industrial IoT players, moderate supplier leverage for specialized components, growing buyer sophistication, and a rising threat from software-led substitutes and targeted new entrants. This snapshot highlights where strategic pressure concentrates and potential defensive moves. Unlock the full Porter's Five Forces Analysis to explore Advantech’s competitive dynamics, market pressures, and strategic advantages in detail.
Suppliers Bargaining Power

Concentrated semiconductor sources
Advantech depends on a concentrated set of CPU/GPU/chipset suppliers—x86 led by Intel/AMD and ARM licensees—with TSMC holding ~53% of advanced-node capacity in 2024 and NVIDIA ~80% share of discrete GPUs, giving suppliers roadmap and allocation leverage. Node scarcity and transitions (fab utilization ~90–95% in tight years) can spike costs and delay deliveries. Long design cycles (12–24+ months) amplify dependency; multi-sourcing helps but is limited by compatibility and validation effort.
Specialized component dependencies
Ruggedized displays, industrial-grade memory, power modules and specialized connectors for extended-temp (-40 to +85°C) and EMC-certified (eg EN 61000 series) applications are supplied by few qualified vendors, narrowing alternatives and raising supplier leverage. Supplier engineering support for board-level integration and compliance testing becomes critical, boosting bargaining clout. Long qualification cycles, often measured in many months, create switching friction and raise switching costs.

Firmware and OS stack influence
As of 2024, licensing and support for Windows IoT, real-time Linux variants and BIOS/firmware toolchains anchor many industrial designs, letting vendors set tiered fees and SLAs that materially affect total solution cost. Security patch cadences and long-term support commitments (commonly 5–10 years) create customer lock-in and switching friction. Negotiation leverage improves with clear volume commitments, which suppliers reward via customized pricing and support tiers.

EMS/ODM capacity and lead times
EMS/ODM capacity utilization (~85% in 2024) tightens pricing and stretches delivery; lead times commonly exceed 12 weeks during peaks, triggering allocation and NRE fee hikes (often +20–40%). Quality and yield variability (5–10% impact) concentrates dependence on select partners. Regionalization lowers geopolitical risk but raises coordination and operating costs (~5–15%).
- Capacity: ~85% utilization (2024)
- Lead times: 12+ weeks in surges
- NRE/alloc: +20–40%
- Yield impact: 5–10%
- Regionalization cost: +5–15%
Logistics and materials volatility
Suppliers' leverage for Advantech rose in 2024 as global freight volatility lingered (Drewry WCI down ~75% vs 2021 peaks but still triggering sporadic surcharges), rare materials and export controls on advanced semiconductors tightened supply, and extended lead times forced higher buffer inventory and costs; suppliers press pass-throughs and stricter liability and forecast clauses.
- Freight: WCI down ~75% vs 2021; 2024 volatility -> surcharges
- Rare materials: constrained inputs raise input costs
- Regulatory: export controls heighten supplier power
- Contracts: liability and forecast accuracy become pivotal
Concentrated fabs and GPUs tighten supply, long EMS leads raise switching costs
Advantech faces high supplier power from concentrated advanced-node fabs (TSMC ~53% in 2024) and GPU suppliers (NVIDIA ~80% discrete GPUs), creating allocation leverage. Industrial-grade components, firmware/licensing with 5–10yr support and EMS capacity (~85% utilization, 12+ week leads) raise switching costs. Suppliers extract +20–40% NRE/alloc and push pass-throughs; leverage eases with clear volume commitments.
| Metric | 2024 |
|---|---|
| TSMC advanced-node share | ~53% |
| NVIDIA discrete GPU share | ~80% |
| EMS utilization | ~85% |
| Lead times | 12+ weeks |
| NRE/alloc impact | +20–40% |
| Yield impact | 5–10% |
| WCI vs 2021 | -75% |
What is included in the product
 Detailed Word Document
Concise Porter's Five Forces assessment of Advantech, mapping competitive rivalry, supplier and buyer power, threat of entrants and substitutes, and key disruptors shaping its profitability and strategic positioning.

 Customizable Excel Spreadsheet
One-sheet Porter's Five Forces for Advantech that pinpoints competitive pain points and relief strategies—ideal for quick board decisions. Swap in your data, toggle scenarios, and export clean charts for decks without macros or finance expertise.
Customers Bargaining Power

Large OEMs and SIs negotiate hard
Large OEMs and SIs in automation, healthcare and transport extract double-digit volume discounts and demand SLAs, multi-year lifecycle guarantees and deep customization that compress vendor margins. Their credible ability to switch suppliers—reinforced by 2024 procurement playbooks—raises negotiating leverage. Long RFPs (commonly 6–12 months) favor incumbents but intensify price pressure.
Multi-sourcing and standardization
Buyers specify interoperable form factors such as PICMG, COM and Mini-ITX to keep options open, reducing product differentiation. This standardization heightens price competition and forces suppliers into bidding against 2 or more qualified vendors. Qualification across two to three vendors is commonplace. Advantech must defend market share through superior service, certifications and ecosystem depth.

TCO and lifecycle expectations
Industrial customers demand 5–10 year longevity and stable BOMs, leveraging that horizon to press for 2–4% annual cost-downs. Spares availability, MTBF and energy efficiency feed TCO models where operating costs often represent ~70% of lifecycle spend; energy gains can cut lifecycle energy costs 10–20%. Extended warranties and favorable repair terms are used as bargaining chips, and price escalators face close scrutiny.

Customization and NRE leverage
Buyers demanding ODM tweaks, certifications or ruggedization force negotiation over NRE, with typical industrial NRE amortization schedules spanning 3–5 years in 2024, shifting cost burdens or securing supplier concessions. Custom work raises switching costs by embedding bespoke tooling and IP, but buyers extract upfront discounts or push NRE onto suppliers to lower unit prices. Clear IP and tooling ownership terms materially tilt bargaining power toward whichever party bears long-term amortization and liability.
- NRE amortization: 3–5 years (2024)
- Customization increases switching costs but requires upfront concessions
- IP/tooling ownership dictates long-run bargaining balance
Data, software, and integration needs
Buyers command 6-12 month RFPs, 5-10 year lifecycles and 2-4% annual cost-downs
Customers wield strong leverage: large OEMs/SIs secure double-digit volume discounts, run 6–12 month RFPs and commonly qualify 2–3 vendors, compressing margins. Industrial buyers demand 5–10 year lifecycles and push 2–4% annual cost-downs, using spares/MTBF and ~70% operating-cost TCO models. NRE amortization (3–5 years) and platform stickiness (open APIs raise switching costs) determine final bargaining balance.
| Metric | 2024 Value |
|---|---|
| RFP length | 6–12 months |
| Vendor qualification | 2–3 vendors |
| Lifecycle demand | 5–10 years |
| Annual cost-downs | 2–4% |
| NRE amortization | 3–5 years |
| Operating share of TCO | ~70% |
Full Version Awaits
Advantech Porter's Five Forces Analysis
This preview shows the exact Advantech Porter's Five Forces Analysis you'll receive after purchase—fully formatted and ready for use. No mockups or placeholders: the document displayed is the final deliverable. Once you buy, you'll get instant access to this same file with the complete analysis.

From Overview to Strategy Blueprint
Advantech faces intense rivalry from global industrial IoT players, moderate supplier leverage for specialized components, growing buyer sophistication, and a rising threat from software-led substitutes and targeted new entrants. This snapshot highlights where strategic pressure concentrates and potential defensive moves. Unlock the full Porter's Five Forces Analysis to explore Advantech’s competitive dynamics, market pressures, and strategic advantages in detail.
Suppliers Bargaining Power
Concentrated semiconductor sources
Advantech depends on a concentrated set of CPU/GPU/chipset suppliers—x86 led by Intel/AMD and ARM licensees—with TSMC holding ~53% of advanced-node capacity in 2024 and NVIDIA ~80% share of discrete GPUs, giving suppliers roadmap and allocation leverage. Node scarcity and transitions (fab utilization ~90–95% in tight years) can spike costs and delay deliveries. Long design cycles (12–24+ months) amplify dependency; multi-sourcing helps but is limited by compatibility and validation effort.
Specialized component dependencies
Ruggedized displays, industrial-grade memory, power modules and specialized connectors for extended-temp (-40 to +85°C) and EMC-certified (eg EN 61000 series) applications are supplied by few qualified vendors, narrowing alternatives and raising supplier leverage. Supplier engineering support for board-level integration and compliance testing becomes critical, boosting bargaining clout. Long qualification cycles, often measured in many months, create switching friction and raise switching costs.
Firmware and OS stack influence
As of 2024, licensing and support for Windows IoT, real-time Linux variants and BIOS/firmware toolchains anchor many industrial designs, letting vendors set tiered fees and SLAs that materially affect total solution cost. Security patch cadences and long-term support commitments (commonly 5–10 years) create customer lock-in and switching friction. Negotiation leverage improves with clear volume commitments, which suppliers reward via customized pricing and support tiers.
EMS/ODM capacity and lead times
EMS/ODM capacity utilization (~85% in 2024) tightens pricing and stretches delivery; lead times commonly exceed 12 weeks during peaks, triggering allocation and NRE fee hikes (often +20–40%). Quality and yield variability (5–10% impact) concentrates dependence on select partners. Regionalization lowers geopolitical risk but raises coordination and operating costs (~5–15%).
- Capacity: ~85% utilization (2024)
- Lead times: 12+ weeks in surges
- NRE/alloc: +20–40%
- Yield impact: 5–10%
- Regionalization cost: +5–15%
Logistics and materials volatility
Suppliers' leverage for Advantech rose in 2024 as global freight volatility lingered (Drewry WCI down ~75% vs 2021 peaks but still triggering sporadic surcharges), rare materials and export controls on advanced semiconductors tightened supply, and extended lead times forced higher buffer inventory and costs; suppliers press pass-throughs and stricter liability and forecast clauses.
- Freight: WCI down ~75% vs 2021; 2024 volatility -> surcharges
- Rare materials: constrained inputs raise input costs
- Regulatory: export controls heighten supplier power
- Contracts: liability and forecast accuracy become pivotal
Concentrated fabs and GPUs tighten supply, long EMS leads raise switching costs
Advantech faces high supplier power from concentrated advanced-node fabs (TSMC ~53% in 2024) and GPU suppliers (NVIDIA ~80% discrete GPUs), creating allocation leverage. Industrial-grade components, firmware/licensing with 5–10yr support and EMS capacity (~85% utilization, 12+ week leads) raise switching costs. Suppliers extract +20–40% NRE/alloc and push pass-throughs; leverage eases with clear volume commitments.
| Metric | 2024 |
|---|---|
| TSMC advanced-node share | ~53% |
| NVIDIA discrete GPU share | ~80% |
| EMS utilization | ~85% |
| Lead times | 12+ weeks |
| NRE/alloc impact | +20–40% |
| Yield impact | 5–10% |
| WCI vs 2021 | -75% |
What is included in the product
Detailed Word Document
Concise Porter's Five Forces assessment of Advantech, mapping competitive rivalry, supplier and buyer power, threat of entrants and substitutes, and key disruptors shaping its profitability and strategic positioning.
Customizable Excel Spreadsheet
One-sheet Porter's Five Forces for Advantech that pinpoints competitive pain points and relief strategies—ideal for quick board decisions. Swap in your data, toggle scenarios, and export clean charts for decks without macros or finance expertise.
Customers Bargaining Power
Large OEMs and SIs negotiate hard
Large OEMs and SIs in automation, healthcare and transport extract double-digit volume discounts and demand SLAs, multi-year lifecycle guarantees and deep customization that compress vendor margins. Their credible ability to switch suppliers—reinforced by 2024 procurement playbooks—raises negotiating leverage. Long RFPs (commonly 6–12 months) favor incumbents but intensify price pressure.
Multi-sourcing and standardization
Buyers specify interoperable form factors such as PICMG, COM and Mini-ITX to keep options open, reducing product differentiation. This standardization heightens price competition and forces suppliers into bidding against 2 or more qualified vendors. Qualification across two to three vendors is commonplace. Advantech must defend market share through superior service, certifications and ecosystem depth.
TCO and lifecycle expectations
Industrial customers demand 5–10 year longevity and stable BOMs, leveraging that horizon to press for 2–4% annual cost-downs. Spares availability, MTBF and energy efficiency feed TCO models where operating costs often represent ~70% of lifecycle spend; energy gains can cut lifecycle energy costs 10–20%. Extended warranties and favorable repair terms are used as bargaining chips, and price escalators face close scrutiny.
Customization and NRE leverage
Buyers demanding ODM tweaks, certifications or ruggedization force negotiation over NRE, with typical industrial NRE amortization schedules spanning 3–5 years in 2024, shifting cost burdens or securing supplier concessions. Custom work raises switching costs by embedding bespoke tooling and IP, but buyers extract upfront discounts or push NRE onto suppliers to lower unit prices. Clear IP and tooling ownership terms materially tilt bargaining power toward whichever party bears long-term amortization and liability.
- NRE amortization: 3–5 years (2024)
- Customization increases switching costs but requires upfront concessions
- IP/tooling ownership dictates long-run bargaining balance
Data, software, and integration needs
Buyers command 6-12 month RFPs, 5-10 year lifecycles and 2-4% annual cost-downs
Customers wield strong leverage: large OEMs/SIs secure double-digit volume discounts, run 6–12 month RFPs and commonly qualify 2–3 vendors, compressing margins. Industrial buyers demand 5–10 year lifecycles and push 2–4% annual cost-downs, using spares/MTBF and ~70% operating-cost TCO models. NRE amortization (3–5 years) and platform stickiness (open APIs raise switching costs) determine final bargaining balance.
| Metric | 2024 Value |
|---|---|
| RFP length | 6–12 months |
| Vendor qualification | 2–3 vendors |
| Lifecycle demand | 5–10 years |
| Annual cost-downs | 2–4% |
| NRE amortization | 3–5 years |
| Operating share of TCO | ~70% |
Full Version Awaits
Advantech Porter's Five Forces Analysis
This preview shows the exact Advantech Porter's Five Forces Analysis you'll receive after purchase—fully formatted and ready for use. No mockups or placeholders: the document displayed is the final deliverable. Once you buy, you'll get instant access to this same file with the complete analysis.
Description
From Overview to Strategy Blueprint
Advantech faces intense rivalry from global industrial IoT players, moderate supplier leverage for specialized components, growing buyer sophistication, and a rising threat from software-led substitutes and targeted new entrants. This snapshot highlights where strategic pressure concentrates and potential defensive moves. Unlock the full Porter's Five Forces Analysis to explore Advantech’s competitive dynamics, market pressures, and strategic advantages in detail.
Suppliers Bargaining Power
Concentrated semiconductor sources
Advantech depends on a concentrated set of CPU/GPU/chipset suppliers—x86 led by Intel/AMD and ARM licensees—with TSMC holding ~53% of advanced-node capacity in 2024 and NVIDIA ~80% share of discrete GPUs, giving suppliers roadmap and allocation leverage. Node scarcity and transitions (fab utilization ~90–95% in tight years) can spike costs and delay deliveries. Long design cycles (12–24+ months) amplify dependency; multi-sourcing helps but is limited by compatibility and validation effort.
Specialized component dependencies
Ruggedized displays, industrial-grade memory, power modules and specialized connectors for extended-temp (-40 to +85°C) and EMC-certified (eg EN 61000 series) applications are supplied by few qualified vendors, narrowing alternatives and raising supplier leverage. Supplier engineering support for board-level integration and compliance testing becomes critical, boosting bargaining clout. Long qualification cycles, often measured in many months, create switching friction and raise switching costs.
Firmware and OS stack influence
As of 2024, licensing and support for Windows IoT, real-time Linux variants and BIOS/firmware toolchains anchor many industrial designs, letting vendors set tiered fees and SLAs that materially affect total solution cost. Security patch cadences and long-term support commitments (commonly 5–10 years) create customer lock-in and switching friction. Negotiation leverage improves with clear volume commitments, which suppliers reward via customized pricing and support tiers.
EMS/ODM capacity and lead times
EMS/ODM capacity utilization (~85% in 2024) tightens pricing and stretches delivery; lead times commonly exceed 12 weeks during peaks, triggering allocation and NRE fee hikes (often +20–40%). Quality and yield variability (5–10% impact) concentrates dependence on select partners. Regionalization lowers geopolitical risk but raises coordination and operating costs (~5–15%).
- Capacity: ~85% utilization (2024)
- Lead times: 12+ weeks in surges
- NRE/alloc: +20–40%
- Yield impact: 5–10%
- Regionalization cost: +5–15%
Logistics and materials volatility
Suppliers' leverage for Advantech rose in 2024 as global freight volatility lingered (Drewry WCI down ~75% vs 2021 peaks but still triggering sporadic surcharges), rare materials and export controls on advanced semiconductors tightened supply, and extended lead times forced higher buffer inventory and costs; suppliers press pass-throughs and stricter liability and forecast clauses.
- Freight: WCI down ~75% vs 2021; 2024 volatility -> surcharges
- Rare materials: constrained inputs raise input costs
- Regulatory: export controls heighten supplier power
- Contracts: liability and forecast accuracy become pivotal
Concentrated fabs and GPUs tighten supply, long EMS leads raise switching costs
Advantech faces high supplier power from concentrated advanced-node fabs (TSMC ~53% in 2024) and GPU suppliers (NVIDIA ~80% discrete GPUs), creating allocation leverage. Industrial-grade components, firmware/licensing with 5–10yr support and EMS capacity (~85% utilization, 12+ week leads) raise switching costs. Suppliers extract +20–40% NRE/alloc and push pass-throughs; leverage eases with clear volume commitments.
| Metric | 2024 |
|---|---|
| TSMC advanced-node share | ~53% |
| NVIDIA discrete GPU share | ~80% |
| EMS utilization | ~85% |
| Lead times | 12+ weeks |
| NRE/alloc impact | +20–40% |
| Yield impact | 5–10% |
| WCI vs 2021 | -75% |
What is included in the product
Detailed Word Document
Concise Porter's Five Forces assessment of Advantech, mapping competitive rivalry, supplier and buyer power, threat of entrants and substitutes, and key disruptors shaping its profitability and strategic positioning.
Customizable Excel Spreadsheet
One-sheet Porter's Five Forces for Advantech that pinpoints competitive pain points and relief strategies—ideal for quick board decisions. Swap in your data, toggle scenarios, and export clean charts for decks without macros or finance expertise.
Customers Bargaining Power
Large OEMs and SIs negotiate hard
Large OEMs and SIs in automation, healthcare and transport extract double-digit volume discounts and demand SLAs, multi-year lifecycle guarantees and deep customization that compress vendor margins. Their credible ability to switch suppliers—reinforced by 2024 procurement playbooks—raises negotiating leverage. Long RFPs (commonly 6–12 months) favor incumbents but intensify price pressure.
Multi-sourcing and standardization
Buyers specify interoperable form factors such as PICMG, COM and Mini-ITX to keep options open, reducing product differentiation. This standardization heightens price competition and forces suppliers into bidding against 2 or more qualified vendors. Qualification across two to three vendors is commonplace. Advantech must defend market share through superior service, certifications and ecosystem depth.
TCO and lifecycle expectations
Industrial customers demand 5–10 year longevity and stable BOMs, leveraging that horizon to press for 2–4% annual cost-downs. Spares availability, MTBF and energy efficiency feed TCO models where operating costs often represent ~70% of lifecycle spend; energy gains can cut lifecycle energy costs 10–20%. Extended warranties and favorable repair terms are used as bargaining chips, and price escalators face close scrutiny.
Customization and NRE leverage
Buyers demanding ODM tweaks, certifications or ruggedization force negotiation over NRE, with typical industrial NRE amortization schedules spanning 3–5 years in 2024, shifting cost burdens or securing supplier concessions. Custom work raises switching costs by embedding bespoke tooling and IP, but buyers extract upfront discounts or push NRE onto suppliers to lower unit prices. Clear IP and tooling ownership terms materially tilt bargaining power toward whichever party bears long-term amortization and liability.
- NRE amortization: 3–5 years (2024)
- Customization increases switching costs but requires upfront concessions
- IP/tooling ownership dictates long-run bargaining balance
Data, software, and integration needs
Buyers command 6-12 month RFPs, 5-10 year lifecycles and 2-4% annual cost-downs
Customers wield strong leverage: large OEMs/SIs secure double-digit volume discounts, run 6–12 month RFPs and commonly qualify 2–3 vendors, compressing margins. Industrial buyers demand 5–10 year lifecycles and push 2–4% annual cost-downs, using spares/MTBF and ~70% operating-cost TCO models. NRE amortization (3–5 years) and platform stickiness (open APIs raise switching costs) determine final bargaining balance.
| Metric | 2024 Value |
|---|---|
| RFP length | 6–12 months |
| Vendor qualification | 2–3 vendors |
| Lifecycle demand | 5–10 years |
| Annual cost-downs | 2–4% |
| NRE amortization | 3–5 years |
| Operating share of TCO | ~70% |
Full Version Awaits
Advantech Porter's Five Forces Analysis
This preview shows the exact Advantech Porter's Five Forces Analysis you'll receive after purchase—fully formatted and ready for use. No mockups or placeholders: the document displayed is the final deliverable. Once you buy, you'll get instant access to this same file with the complete analysis.











