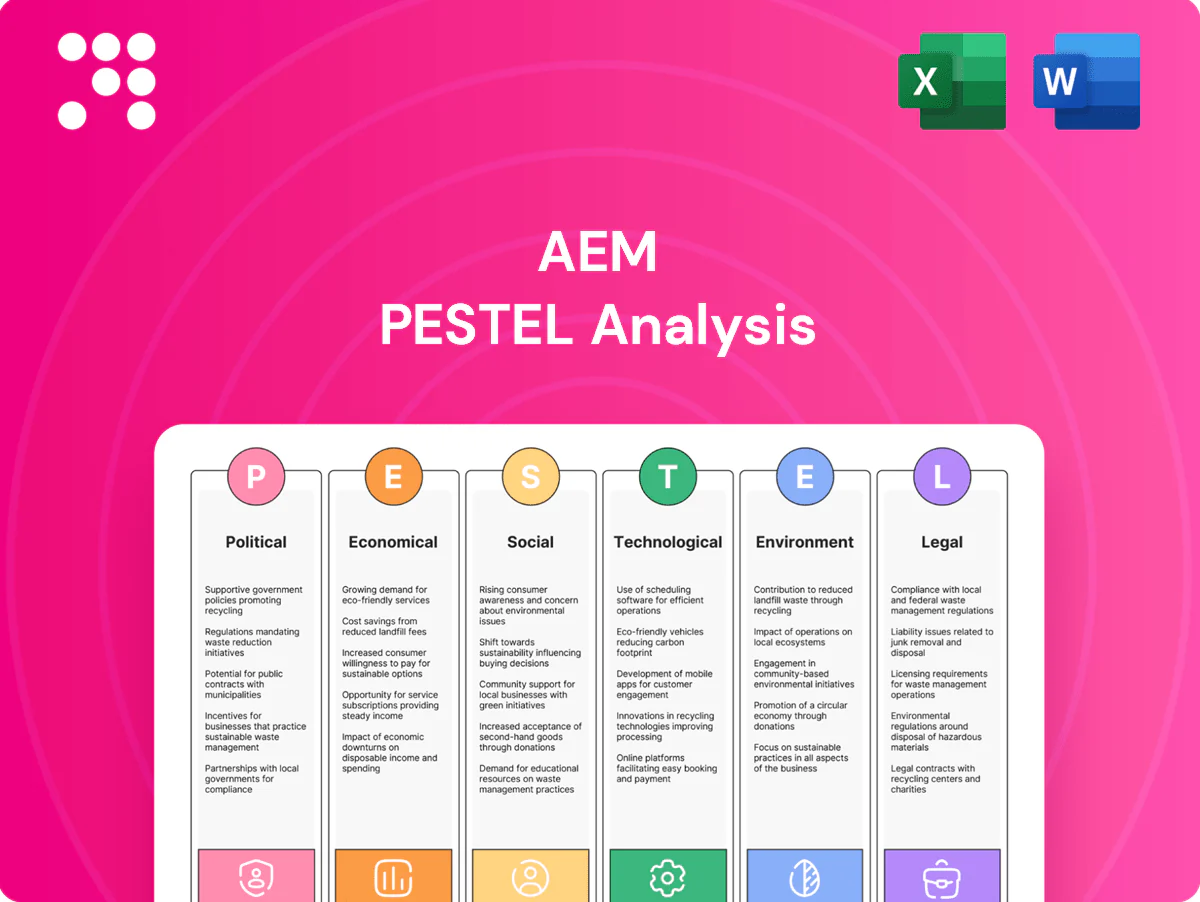
AEM PESTLE Analysis

Make Smarter Strategic Decisions with a Complete PESTEL View
Our concise PESTLE overview reveals how political shifts, economic cycles, and technological advances are shaping AEM’s strategic risks and opportunities. Ideal for investors and strategists, it highlights actionable external trends affecting performance. Purchase the full PESTLE to access the complete, ready-to-use analysis and recommendations.
Political factors

Geopolitics and export controls
AEM serves semiconductor clients exposed to US–China tech tensions and export restrictions heightened in 2023–2024; US controls and the CHIPS Act (authorized $52 billion in 2022) are reshaping equipment flows. Tightening controls can shift test demand across regions and product nodes, forcing roadmap adaptations to permissible specs. The firm must safeguard access to advanced components while using proactive compliance and market diversification to mitigate supply and revenue shocks.
Singapore industrial policy support
Singapore’s pro-manufacturing stance—via EDB and A*STAR grants, R&D incentives and talent schemes—lowers AEM’s cost base and supports scale-up in a sector that contributes about 20% of GDP. Alignment with national priorities in advanced manufacturing and robotics increases funding eligibility and access to ecosystem partners. Policy continuity enables confident long-cycle equipment planning; any pivot could materially change AEM’s capex intensity and local expansion timing.

Customer-country political risk
Large customers span the US, EU, Taiwan, Korea and China, exposing AEM to divergent country risks. Election cycles—US 2024, EU 2024 European Parliament, Taiwan 2024—have delayed procurement and rerouted supply chains. AEM should balance exposure across blocs to cut concentration risk and localize service hubs to maintain access. US CHIPS Act provides $52 billion in semiconductor incentives, fueling onshoring.

Trade tariffs and localization
Tariffs on machinery and components—often reaching up to 25% in some markets—raise unit costs and complicate cross-border logistics, squeezing margins and elongating lead times. Friendshoring is prompting customers to localize test capacity, creating multi-site revenue opportunities for AEM. Designing modular platforms eases localization without duplicating engineering effort, while strategic partnerships with local integrators accelerate market entry.
- Tariffs: up to 25% impact on capital costs
- Friendshoring: drives multi-site demand
- Modularity: lowers localization engineering burden
- Local partners: faster market entry, lower capex
Government funding for semiconductors
CHIPS $52B and US-China controls spur friendshoring; tariffs up to 25%
AEM faces US–China export controls and CHIPS $52B incentives reshaping equipment flows and accelerating friendshoring, with tariffs up to 25% raising unit costs. Singapore incentives (R&D, grants) lower local costs and support scale-up. Diverse customer geography and 2024 election cycles heighten procurement timing risk; align roadmaps to funded projects.
| Item | Value |
|---|---|
| US CHIPS | $52B |
| EU | €43B |
| SK target | 510T won |
| Tariffs | up to 25% |
What is included in the product
 Detailed Word Document
Explores how Political, Economic, Social, Technological, Environmental and Legal forces specifically shape the AEM, with data-driven trends and region/industry context to identify risks and opportunities; formatted for executive use in plans, decks and scenario-driven strategy with forward-looking insights to support investors and managers.

 Customizable Excel Spreadsheet
AEM's PESTLE delivers a concise, visually segmented summary that eases meeting prep, is editable for local context, and instantly shareable for cross-team alignment.
Economic factors

Semiconductor capex cyclicality
Equipment orders track wafer and package test cycles, driving revenue volatility with sharp swings across 2024–25 capex phases; downturns shift demand toward service, spares and retrofits while upcycles favor new handlers and test cells. AEM must keep flexible cost structures and granular backlog visibility to manage quarterly swings. Scenario planning across memory, logic and OSAT segments smooths capacity and investment timing. Tight alignment with customers’ fab roadmaps reduces inventory and cash-flow strain.
AI and HPC demand pull
AI-driven demand is expanding HBM, advanced packaging and burn-in/test capacity as HBM can deliver up to ~50% lower power per bit versus GDDR, increasing need for AEM-compatible handlers and vision inspection in complex stacks.
AEM’s handlers and vision systems capture value from higher mix complexity and throughput, with premium configurations enabling pricing power and margin resilience.
Monitoring hyperscaler and accelerator build plans (multi-10k unit orders) informs production scheduling and capacity allocation.

FX, rates, and inflation
Global sales denominated largely in USD while costs remain SGD-exposed (USD/SGD ~1.36 mid-2025) makes AEM’s margins sensitive to FX swings; natural hedges, forward contracts and price escalators mitigate volatility. Higher policy rates (US fed funds 5.25–5.50% mid-2025) lift customer WACC and can defer capex approvals. Component inflation has pressured BOMs, especially mechatronics and optics, and hedging plus pass-through clauses help protect profitability.

Customer concentration and ASPs
Dependence on a few large accounts amplifies order volatility and pricing negotiations; diversification into automotive, industrial and consumer test reduces single-node risk, while value-added software and analytics raise blended ASPs and multi-year framework agreements stabilize capacity utilization and revenue visibility.
- Customer concentration: amplifies volatility
- Diversification: automotive/industrial/consumer lowers single-node risk
- Software/analytics: uplifts blended ASPs
- Multi-year frameworks: stabilize utilization
Supply chain availability
Supply chain availability drives AEM delivery cycles as long-lead items—precision actuators, machine-vision cameras, and semicon-grade materials—commonly face 12–24 week lead times; semiconductor wafer lead times eased to ~13 weeks by 2024, improving throughput but keeping variability. Dual-sourcing and targeted safety stocks have cut line-stoppage incidents by firms by an estimated 30–40% in recent industry studies, while regional vendor bases enable faster localization and tariff mitigation. Design-for-manufacturing (DFM) initiatives lowered component-cost variance and shortened qualification cycles, boosting resilience and reducing unit costs.
- Long-lead items: 12–24 weeks
- Semiconductor lead time: ~13 weeks (2024)
- Dual-sourcing/safety stocks: −30–40% stoppage risk
- DFM: lowers cost variance, speeds qualification
CHIPS $52B and US-China controls spur friendshoring; tariffs up to 25%
Equipment-order cyclicality and memory/AI upcycles drive revenue volatility; flexible cost structure, backlog visibility and multi-year frameworks smooth cash flows. FX (USD/SGD ~1.36 mid-2025), higher rates (fed 5.25–5.50% mid-2025) and BOM inflation pressure margins; hedges and pass-throughs mitigate. Dual-sourcing and DFM cut stoppage risk ~30–40% and shorten lead times.
| Metric | Value |
|---|---|
| USD/SGD | ~1.36 (mid-2025) |
| Fed funds | 5.25–5.50% (mid-2025) |
| Semic lead time | ~13 wks (2024) |
| Long-lead | 12–24 wks |
Preview Before You Purchase
AEM PESTLE Analysis
The preview shown here is the exact AEM PESTLE Analysis you’ll receive after purchase—fully formatted and ready to use. The content, structure, and layout visible are the final file you’ll download immediately after payment, with no placeholders or surprises. Use it as-is for strategic review, reporting, or presentation.

Make Smarter Strategic Decisions with a Complete PESTEL View
Our concise PESTLE overview reveals how political shifts, economic cycles, and technological advances are shaping AEM’s strategic risks and opportunities. Ideal for investors and strategists, it highlights actionable external trends affecting performance. Purchase the full PESTLE to access the complete, ready-to-use analysis and recommendations.
Political factors
Geopolitics and export controls
AEM serves semiconductor clients exposed to US–China tech tensions and export restrictions heightened in 2023–2024; US controls and the CHIPS Act (authorized $52 billion in 2022) are reshaping equipment flows. Tightening controls can shift test demand across regions and product nodes, forcing roadmap adaptations to permissible specs. The firm must safeguard access to advanced components while using proactive compliance and market diversification to mitigate supply and revenue shocks.
Singapore industrial policy support
Singapore’s pro-manufacturing stance—via EDB and A*STAR grants, R&D incentives and talent schemes—lowers AEM’s cost base and supports scale-up in a sector that contributes about 20% of GDP. Alignment with national priorities in advanced manufacturing and robotics increases funding eligibility and access to ecosystem partners. Policy continuity enables confident long-cycle equipment planning; any pivot could materially change AEM’s capex intensity and local expansion timing.
Customer-country political risk
Large customers span the US, EU, Taiwan, Korea and China, exposing AEM to divergent country risks. Election cycles—US 2024, EU 2024 European Parliament, Taiwan 2024—have delayed procurement and rerouted supply chains. AEM should balance exposure across blocs to cut concentration risk and localize service hubs to maintain access. US CHIPS Act provides $52 billion in semiconductor incentives, fueling onshoring.
Trade tariffs and localization
Tariffs on machinery and components—often reaching up to 25% in some markets—raise unit costs and complicate cross-border logistics, squeezing margins and elongating lead times. Friendshoring is prompting customers to localize test capacity, creating multi-site revenue opportunities for AEM. Designing modular platforms eases localization without duplicating engineering effort, while strategic partnerships with local integrators accelerate market entry.
- Tariffs: up to 25% impact on capital costs
- Friendshoring: drives multi-site demand
- Modularity: lowers localization engineering burden
- Local partners: faster market entry, lower capex
Government funding for semiconductors
CHIPS $52B and US-China controls spur friendshoring; tariffs up to 25%
AEM faces US–China export controls and CHIPS $52B incentives reshaping equipment flows and accelerating friendshoring, with tariffs up to 25% raising unit costs. Singapore incentives (R&D, grants) lower local costs and support scale-up. Diverse customer geography and 2024 election cycles heighten procurement timing risk; align roadmaps to funded projects.
| Item | Value |
|---|---|
| US CHIPS | $52B |
| EU | €43B |
| SK target | 510T won |
| Tariffs | up to 25% |
What is included in the product
Detailed Word Document
Explores how Political, Economic, Social, Technological, Environmental and Legal forces specifically shape the AEM, with data-driven trends and region/industry context to identify risks and opportunities; formatted for executive use in plans, decks and scenario-driven strategy with forward-looking insights to support investors and managers.
Customizable Excel Spreadsheet
AEM's PESTLE delivers a concise, visually segmented summary that eases meeting prep, is editable for local context, and instantly shareable for cross-team alignment.
Economic factors
Semiconductor capex cyclicality
Equipment orders track wafer and package test cycles, driving revenue volatility with sharp swings across 2024–25 capex phases; downturns shift demand toward service, spares and retrofits while upcycles favor new handlers and test cells. AEM must keep flexible cost structures and granular backlog visibility to manage quarterly swings. Scenario planning across memory, logic and OSAT segments smooths capacity and investment timing. Tight alignment with customers’ fab roadmaps reduces inventory and cash-flow strain.
AI and HPC demand pull
AI-driven demand is expanding HBM, advanced packaging and burn-in/test capacity as HBM can deliver up to ~50% lower power per bit versus GDDR, increasing need for AEM-compatible handlers and vision inspection in complex stacks.
AEM’s handlers and vision systems capture value from higher mix complexity and throughput, with premium configurations enabling pricing power and margin resilience.
Monitoring hyperscaler and accelerator build plans (multi-10k unit orders) informs production scheduling and capacity allocation.
FX, rates, and inflation
Global sales denominated largely in USD while costs remain SGD-exposed (USD/SGD ~1.36 mid-2025) makes AEM’s margins sensitive to FX swings; natural hedges, forward contracts and price escalators mitigate volatility. Higher policy rates (US fed funds 5.25–5.50% mid-2025) lift customer WACC and can defer capex approvals. Component inflation has pressured BOMs, especially mechatronics and optics, and hedging plus pass-through clauses help protect profitability.
Customer concentration and ASPs
Dependence on a few large accounts amplifies order volatility and pricing negotiations; diversification into automotive, industrial and consumer test reduces single-node risk, while value-added software and analytics raise blended ASPs and multi-year framework agreements stabilize capacity utilization and revenue visibility.
- Customer concentration: amplifies volatility
- Diversification: automotive/industrial/consumer lowers single-node risk
- Software/analytics: uplifts blended ASPs
- Multi-year frameworks: stabilize utilization
Supply chain availability
Supply chain availability drives AEM delivery cycles as long-lead items—precision actuators, machine-vision cameras, and semicon-grade materials—commonly face 12–24 week lead times; semiconductor wafer lead times eased to ~13 weeks by 2024, improving throughput but keeping variability. Dual-sourcing and targeted safety stocks have cut line-stoppage incidents by firms by an estimated 30–40% in recent industry studies, while regional vendor bases enable faster localization and tariff mitigation. Design-for-manufacturing (DFM) initiatives lowered component-cost variance and shortened qualification cycles, boosting resilience and reducing unit costs.
- Long-lead items: 12–24 weeks
- Semiconductor lead time: ~13 weeks (2024)
- Dual-sourcing/safety stocks: −30–40% stoppage risk
- DFM: lowers cost variance, speeds qualification
CHIPS $52B and US-China controls spur friendshoring; tariffs up to 25%
Equipment-order cyclicality and memory/AI upcycles drive revenue volatility; flexible cost structure, backlog visibility and multi-year frameworks smooth cash flows. FX (USD/SGD ~1.36 mid-2025), higher rates (fed 5.25–5.50% mid-2025) and BOM inflation pressure margins; hedges and pass-throughs mitigate. Dual-sourcing and DFM cut stoppage risk ~30–40% and shorten lead times.
| Metric | Value |
|---|---|
| USD/SGD | ~1.36 (mid-2025) |
| Fed funds | 5.25–5.50% (mid-2025) |
| Semic lead time | ~13 wks (2024) |
| Long-lead | 12–24 wks |
Preview Before You Purchase
AEM PESTLE Analysis
The preview shown here is the exact AEM PESTLE Analysis you’ll receive after purchase—fully formatted and ready to use. The content, structure, and layout visible are the final file you’ll download immediately after payment, with no placeholders or surprises. Use it as-is for strategic review, reporting, or presentation.
Original: $10.00
-65%$10.00
$3.50Description
Make Smarter Strategic Decisions with a Complete PESTEL View
Our concise PESTLE overview reveals how political shifts, economic cycles, and technological advances are shaping AEM’s strategic risks and opportunities. Ideal for investors and strategists, it highlights actionable external trends affecting performance. Purchase the full PESTLE to access the complete, ready-to-use analysis and recommendations.
Political factors
Geopolitics and export controls
AEM serves semiconductor clients exposed to US–China tech tensions and export restrictions heightened in 2023–2024; US controls and the CHIPS Act (authorized $52 billion in 2022) are reshaping equipment flows. Tightening controls can shift test demand across regions and product nodes, forcing roadmap adaptations to permissible specs. The firm must safeguard access to advanced components while using proactive compliance and market diversification to mitigate supply and revenue shocks.
Singapore industrial policy support
Singapore’s pro-manufacturing stance—via EDB and A*STAR grants, R&D incentives and talent schemes—lowers AEM’s cost base and supports scale-up in a sector that contributes about 20% of GDP. Alignment with national priorities in advanced manufacturing and robotics increases funding eligibility and access to ecosystem partners. Policy continuity enables confident long-cycle equipment planning; any pivot could materially change AEM’s capex intensity and local expansion timing.
Customer-country political risk
Large customers span the US, EU, Taiwan, Korea and China, exposing AEM to divergent country risks. Election cycles—US 2024, EU 2024 European Parliament, Taiwan 2024—have delayed procurement and rerouted supply chains. AEM should balance exposure across blocs to cut concentration risk and localize service hubs to maintain access. US CHIPS Act provides $52 billion in semiconductor incentives, fueling onshoring.
Trade tariffs and localization
Tariffs on machinery and components—often reaching up to 25% in some markets—raise unit costs and complicate cross-border logistics, squeezing margins and elongating lead times. Friendshoring is prompting customers to localize test capacity, creating multi-site revenue opportunities for AEM. Designing modular platforms eases localization without duplicating engineering effort, while strategic partnerships with local integrators accelerate market entry.
- Tariffs: up to 25% impact on capital costs
- Friendshoring: drives multi-site demand
- Modularity: lowers localization engineering burden
- Local partners: faster market entry, lower capex
Government funding for semiconductors
CHIPS $52B and US-China controls spur friendshoring; tariffs up to 25%
AEM faces US–China export controls and CHIPS $52B incentives reshaping equipment flows and accelerating friendshoring, with tariffs up to 25% raising unit costs. Singapore incentives (R&D, grants) lower local costs and support scale-up. Diverse customer geography and 2024 election cycles heighten procurement timing risk; align roadmaps to funded projects.
| Item | Value |
|---|---|
| US CHIPS | $52B |
| EU | €43B |
| SK target | 510T won |
| Tariffs | up to 25% |
What is included in the product
Detailed Word Document
Explores how Political, Economic, Social, Technological, Environmental and Legal forces specifically shape the AEM, with data-driven trends and region/industry context to identify risks and opportunities; formatted for executive use in plans, decks and scenario-driven strategy with forward-looking insights to support investors and managers.
Customizable Excel Spreadsheet
AEM's PESTLE delivers a concise, visually segmented summary that eases meeting prep, is editable for local context, and instantly shareable for cross-team alignment.
Economic factors
Semiconductor capex cyclicality
Equipment orders track wafer and package test cycles, driving revenue volatility with sharp swings across 2024–25 capex phases; downturns shift demand toward service, spares and retrofits while upcycles favor new handlers and test cells. AEM must keep flexible cost structures and granular backlog visibility to manage quarterly swings. Scenario planning across memory, logic and OSAT segments smooths capacity and investment timing. Tight alignment with customers’ fab roadmaps reduces inventory and cash-flow strain.
AI and HPC demand pull
AI-driven demand is expanding HBM, advanced packaging and burn-in/test capacity as HBM can deliver up to ~50% lower power per bit versus GDDR, increasing need for AEM-compatible handlers and vision inspection in complex stacks.
AEM’s handlers and vision systems capture value from higher mix complexity and throughput, with premium configurations enabling pricing power and margin resilience.
Monitoring hyperscaler and accelerator build plans (multi-10k unit orders) informs production scheduling and capacity allocation.
FX, rates, and inflation
Global sales denominated largely in USD while costs remain SGD-exposed (USD/SGD ~1.36 mid-2025) makes AEM’s margins sensitive to FX swings; natural hedges, forward contracts and price escalators mitigate volatility. Higher policy rates (US fed funds 5.25–5.50% mid-2025) lift customer WACC and can defer capex approvals. Component inflation has pressured BOMs, especially mechatronics and optics, and hedging plus pass-through clauses help protect profitability.
Customer concentration and ASPs
Dependence on a few large accounts amplifies order volatility and pricing negotiations; diversification into automotive, industrial and consumer test reduces single-node risk, while value-added software and analytics raise blended ASPs and multi-year framework agreements stabilize capacity utilization and revenue visibility.
- Customer concentration: amplifies volatility
- Diversification: automotive/industrial/consumer lowers single-node risk
- Software/analytics: uplifts blended ASPs
- Multi-year frameworks: stabilize utilization
Supply chain availability
Supply chain availability drives AEM delivery cycles as long-lead items—precision actuators, machine-vision cameras, and semicon-grade materials—commonly face 12–24 week lead times; semiconductor wafer lead times eased to ~13 weeks by 2024, improving throughput but keeping variability. Dual-sourcing and targeted safety stocks have cut line-stoppage incidents by firms by an estimated 30–40% in recent industry studies, while regional vendor bases enable faster localization and tariff mitigation. Design-for-manufacturing (DFM) initiatives lowered component-cost variance and shortened qualification cycles, boosting resilience and reducing unit costs.
- Long-lead items: 12–24 weeks
- Semiconductor lead time: ~13 weeks (2024)
- Dual-sourcing/safety stocks: −30–40% stoppage risk
- DFM: lowers cost variance, speeds qualification
CHIPS $52B and US-China controls spur friendshoring; tariffs up to 25%
Equipment-order cyclicality and memory/AI upcycles drive revenue volatility; flexible cost structure, backlog visibility and multi-year frameworks smooth cash flows. FX (USD/SGD ~1.36 mid-2025), higher rates (fed 5.25–5.50% mid-2025) and BOM inflation pressure margins; hedges and pass-throughs mitigate. Dual-sourcing and DFM cut stoppage risk ~30–40% and shorten lead times.
| Metric | Value |
|---|---|
| USD/SGD | ~1.36 (mid-2025) |
| Fed funds | 5.25–5.50% (mid-2025) |
| Semic lead time | ~13 wks (2024) |
| Long-lead | 12–24 wks |
Preview Before You Purchase
AEM PESTLE Analysis
The preview shown here is the exact AEM PESTLE Analysis you’ll receive after purchase—fully formatted and ready to use. The content, structure, and layout visible are the final file you’ll download immediately after payment, with no placeholders or surprises. Use it as-is for strategic review, reporting, or presentation.











