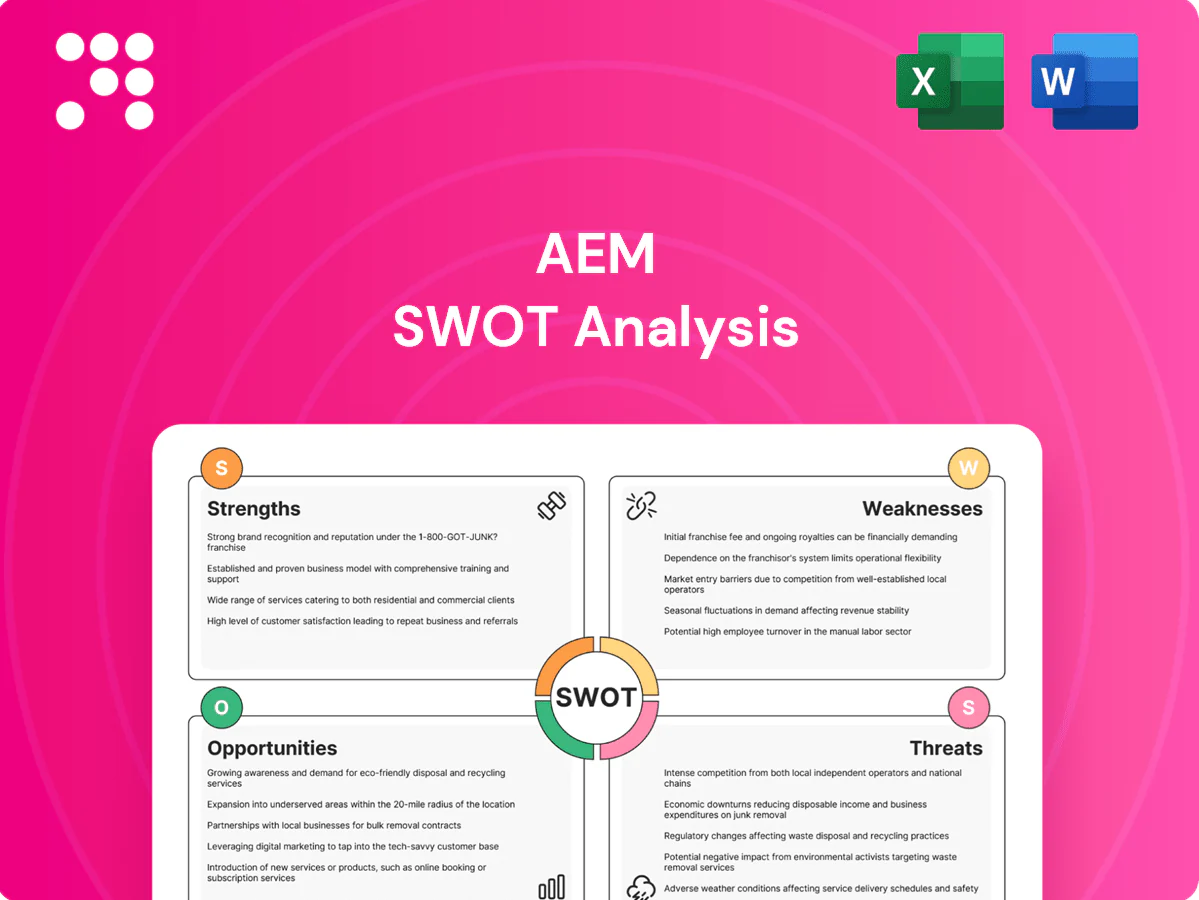
AEM SWOT Analysis

Make Insightful Decisions Backed by Expert Research
AEM’s SWOT snapshot highlights robust market positioning and innovation strengths against regulatory and cyclical risks; growth opportunities in industrial electrification contrast with margin pressure from raw-material costs. Want the full strategic picture and actionable steps? Purchase the complete SWOT for a research-backed, editable Word and Excel pack ready for planning and pitching.
Strengths

Broad test portfolio
AEM's handlers, test inserts and vision inspection systems cover multiple test stages, enabling integrated solutions rather than piecemeal equipment. This breadth lets customers simplify vendor management and align throughput and yield across the test flow. In 2024 AEM reported group revenue of about S$730m, reinforcing stickiness and cross-sell potential across its installed base.
Wafer-to-package coverage
AEM provides wafer-level, module and final-package test solutions, enabling earlier defect detection and reduced downstream scrap; this end-to-end coverage improves customer yield and throughput and positions AEM as a lifecycle partner rather than a point-tool vendor.

Process optimization value
Equipment is engineered to optimize manufacturing efficiency and quality, improving takt time, alignment accuracy, and inspection fidelity to lower cost per unit while maintaining throughput.
Enhanced test coverage drives measurable reductions in field failures and RMAs, strengthening customer yield and brand trust.
Clear ROI cases from recent deployments underpin a premium pricing position, as buyers prioritize lifecycle cost savings and reliability.

Customization and engineering
AEM’s configurable platforms enable support across nodes including advanced 3 nm production adopted by foundries since 2022–23, letting AEM tailor handlers and inserts to device-specific process needs. This engineering customization aligns AEM closely with customer roadmaps, raising switching costs and fostering multi-year service and upgrade relationships that underpin recurring revenue.
- Configurable platforms for diverse nodes
- Device-specific handlers/inserts as competitive lever
- Deeper integration → higher switching costs
- Supports long-term customer relationships
Installed base and know-how
Deployed systems give granular operational data, customer feedback and case references that drive repeat wins and product improvements; industry studies in 2023–2024 show aftermarket and service revenue can account for roughly 25–35% of lifetime equipment revenue. Field knowledge from the installed base sharpens reliability engineering and speeds service response, reducing downtime in production environments. AEMs installed base creates recurring upgrade and retrofit revenue while validating performance claims in demanding industrial settings.
- data-driven references
- 25–35% aftermarket revenue
- improved reliability & service speed
- upgrade/retrofit revenue stream
Wafer-to-package platforms cut scrap, raise yield; aftermarket (25-35%)
AEM's integrated handlers, inserts and vision systems simplify vendor management and boost yield; 2024 group revenue ~S$730m evidences a strong installed base. End-to-end wafer-to-package coverage reduces scrap and RMAs, improving customer ROI. Configurable platforms (supporting sub-3nm) raise switching costs and drive aftermarket revenue (25–35% of lifetime equipment revenue).
| Metric | Value |
|---|---|
| 2024 revenue | S$730m |
| Aftermarket share | 25–35% |
What is included in the product
 Detailed Word Document
Provides a concise SWOT analysis of AEM, highlighting core strengths, operational weaknesses, market opportunities, and external threats affecting its competitive position and growth prospects.

 Customizable Excel Spreadsheet
Provides a focused SWOT matrix tailored to AEM for rapid strategic clarity and pain-point resolution, enabling teams to pinpoint risks and opportunities quickly and prioritize corrective actions.
Weaknesses

Customer concentration
Advanced test engagements at AEM concentrate revenue in a handful of marquee accounts, with several programs representing the bulk of near-term backlog. Reliance on limited customers heightens revenue volatility if OEM programs shift or are delayed. Material pricing or volume resets at these accounts can meaningfully swing quarterly results, so diversification of customer mix and program pipeline remains an ongoing imperative.
Cyclical exposure
Cyclical semiconductor capex drives AEM demand: industry capex swings have caused tool orders and utilization-linked services to fall sharply in downturns, with backlogs and visibility compressing quickly (industry capex dropped roughly 20–30% in recent downcycles), constantly testing planning and cost-structure flexibility.

Scale vs larger rivals
Smaller AEM faces scale pressure versus global ATE leaders — Teradyne and Advantest reported multi-billion-dollar revenues in 2024 and sustain deeper R&D and service footprints, widening technology gaps. Reduced scale limits AEM’s bargaining power with suppliers and large fab customers, compressing margins. Slower capital and service rollouts can delay entry into new geographies or test nodes, and brand recognition in conservative fabs can lag incumbents.

High R&D and customization costs
Engineering-intensive solutions force sustained R&D outlays and heavy customization, compressing margins as custom projects incur scope creep and rework; recovering non-recurring engineering (NRE) across low-volume programs is difficult, and a diversified product portfolio increases long-term support and warranty costs.
- High sustained R&D burden
- Scope creep → margin dilution
- Challenging NRE recovery
- Portfolio raises support costs
Geographic and supply constraints
Complex mechanical, optical and electronic assemblies for AEM rely on tight supply chains; component shortages and logistics bottlenecks have repeatedly delayed deliveries. Regional concentration is acute: over 70% of advanced semiconductor manufacturing capacity is in Taiwan and South Korea, heightening geopolitical and climate risks. Lead-time variability directly impacts customer satisfaction and order fill rates.
- Supply concentration: >70% advanced fabs in Taiwan/Korea
- High dependency on precision component suppliers
- Logistics bottlenecks → delayed deliveries
- Variable lead-times reduce customer satisfaction
Concentrated advanced-test revenue, >70% fabs in Taiwan/Korea; capex downcycles 20–30%
Advanced-test revenue is concentrated in a few marquee accounts, raising backlog and quarterly volatility if OEM programs shift. Cyclical semiconductor capex compresses orders—industry downcycles have cut capex roughly 20–30%. Supply-chain and regional concentration (>70% of advanced fabs in Taiwan/Korea) heighten delivery, geopolitical and lead-time risks.
| Risk | Metric |
|---|---|
| Fab concentration | >70% advanced fabs Taiwan/Korea |
| Capex cyclicality | ~20–30% downcycle swings |
Same Document Delivered
AEM SWOT Analysis
This is the actual AEM SWOT analysis document you’ll receive upon purchase—no surprises, just professional quality. The preview below is taken directly from the full report you'll get. Buy now to unlock the complete, editable version immediately after checkout.

Make Insightful Decisions Backed by Expert Research
AEM’s SWOT snapshot highlights robust market positioning and innovation strengths against regulatory and cyclical risks; growth opportunities in industrial electrification contrast with margin pressure from raw-material costs. Want the full strategic picture and actionable steps? Purchase the complete SWOT for a research-backed, editable Word and Excel pack ready for planning and pitching.
Strengths
Broad test portfolio
AEM's handlers, test inserts and vision inspection systems cover multiple test stages, enabling integrated solutions rather than piecemeal equipment. This breadth lets customers simplify vendor management and align throughput and yield across the test flow. In 2024 AEM reported group revenue of about S$730m, reinforcing stickiness and cross-sell potential across its installed base.
Wafer-to-package coverage
AEM provides wafer-level, module and final-package test solutions, enabling earlier defect detection and reduced downstream scrap; this end-to-end coverage improves customer yield and throughput and positions AEM as a lifecycle partner rather than a point-tool vendor.
Process optimization value
Equipment is engineered to optimize manufacturing efficiency and quality, improving takt time, alignment accuracy, and inspection fidelity to lower cost per unit while maintaining throughput.
Enhanced test coverage drives measurable reductions in field failures and RMAs, strengthening customer yield and brand trust.
Clear ROI cases from recent deployments underpin a premium pricing position, as buyers prioritize lifecycle cost savings and reliability.
Customization and engineering
AEM’s configurable platforms enable support across nodes including advanced 3 nm production adopted by foundries since 2022–23, letting AEM tailor handlers and inserts to device-specific process needs. This engineering customization aligns AEM closely with customer roadmaps, raising switching costs and fostering multi-year service and upgrade relationships that underpin recurring revenue.
- Configurable platforms for diverse nodes
- Device-specific handlers/inserts as competitive lever
- Deeper integration → higher switching costs
- Supports long-term customer relationships
Installed base and know-how
Deployed systems give granular operational data, customer feedback and case references that drive repeat wins and product improvements; industry studies in 2023–2024 show aftermarket and service revenue can account for roughly 25–35% of lifetime equipment revenue. Field knowledge from the installed base sharpens reliability engineering and speeds service response, reducing downtime in production environments. AEMs installed base creates recurring upgrade and retrofit revenue while validating performance claims in demanding industrial settings.
- data-driven references
- 25–35% aftermarket revenue
- improved reliability & service speed
- upgrade/retrofit revenue stream
Wafer-to-package platforms cut scrap, raise yield; aftermarket (25-35%)
AEM's integrated handlers, inserts and vision systems simplify vendor management and boost yield; 2024 group revenue ~S$730m evidences a strong installed base. End-to-end wafer-to-package coverage reduces scrap and RMAs, improving customer ROI. Configurable platforms (supporting sub-3nm) raise switching costs and drive aftermarket revenue (25–35% of lifetime equipment revenue).
| Metric | Value |
|---|---|
| 2024 revenue | S$730m |
| Aftermarket share | 25–35% |
What is included in the product
Detailed Word Document
Provides a concise SWOT analysis of AEM, highlighting core strengths, operational weaknesses, market opportunities, and external threats affecting its competitive position and growth prospects.
Customizable Excel Spreadsheet
Provides a focused SWOT matrix tailored to AEM for rapid strategic clarity and pain-point resolution, enabling teams to pinpoint risks and opportunities quickly and prioritize corrective actions.
Weaknesses
Customer concentration
Advanced test engagements at AEM concentrate revenue in a handful of marquee accounts, with several programs representing the bulk of near-term backlog. Reliance on limited customers heightens revenue volatility if OEM programs shift or are delayed. Material pricing or volume resets at these accounts can meaningfully swing quarterly results, so diversification of customer mix and program pipeline remains an ongoing imperative.
Cyclical exposure
Cyclical semiconductor capex drives AEM demand: industry capex swings have caused tool orders and utilization-linked services to fall sharply in downturns, with backlogs and visibility compressing quickly (industry capex dropped roughly 20–30% in recent downcycles), constantly testing planning and cost-structure flexibility.
Scale vs larger rivals
Smaller AEM faces scale pressure versus global ATE leaders — Teradyne and Advantest reported multi-billion-dollar revenues in 2024 and sustain deeper R&D and service footprints, widening technology gaps. Reduced scale limits AEM’s bargaining power with suppliers and large fab customers, compressing margins. Slower capital and service rollouts can delay entry into new geographies or test nodes, and brand recognition in conservative fabs can lag incumbents.
High R&D and customization costs
Engineering-intensive solutions force sustained R&D outlays and heavy customization, compressing margins as custom projects incur scope creep and rework; recovering non-recurring engineering (NRE) across low-volume programs is difficult, and a diversified product portfolio increases long-term support and warranty costs.
- High sustained R&D burden
- Scope creep → margin dilution
- Challenging NRE recovery
- Portfolio raises support costs
Geographic and supply constraints
Complex mechanical, optical and electronic assemblies for AEM rely on tight supply chains; component shortages and logistics bottlenecks have repeatedly delayed deliveries. Regional concentration is acute: over 70% of advanced semiconductor manufacturing capacity is in Taiwan and South Korea, heightening geopolitical and climate risks. Lead-time variability directly impacts customer satisfaction and order fill rates.
- Supply concentration: >70% advanced fabs in Taiwan/Korea
- High dependency on precision component suppliers
- Logistics bottlenecks → delayed deliveries
- Variable lead-times reduce customer satisfaction
Concentrated advanced-test revenue, >70% fabs in Taiwan/Korea; capex downcycles 20–30%
Advanced-test revenue is concentrated in a few marquee accounts, raising backlog and quarterly volatility if OEM programs shift. Cyclical semiconductor capex compresses orders—industry downcycles have cut capex roughly 20–30%. Supply-chain and regional concentration (>70% of advanced fabs in Taiwan/Korea) heighten delivery, geopolitical and lead-time risks.
| Risk | Metric |
|---|---|
| Fab concentration | >70% advanced fabs Taiwan/Korea |
| Capex cyclicality | ~20–30% downcycle swings |
Same Document Delivered
AEM SWOT Analysis
This is the actual AEM SWOT analysis document you’ll receive upon purchase—no surprises, just professional quality. The preview below is taken directly from the full report you'll get. Buy now to unlock the complete, editable version immediately after checkout.
Original: $10.00
-65%$10.00
$3.50Description
Make Insightful Decisions Backed by Expert Research
AEM’s SWOT snapshot highlights robust market positioning and innovation strengths against regulatory and cyclical risks; growth opportunities in industrial electrification contrast with margin pressure from raw-material costs. Want the full strategic picture and actionable steps? Purchase the complete SWOT for a research-backed, editable Word and Excel pack ready for planning and pitching.
Strengths
Broad test portfolio
AEM's handlers, test inserts and vision inspection systems cover multiple test stages, enabling integrated solutions rather than piecemeal equipment. This breadth lets customers simplify vendor management and align throughput and yield across the test flow. In 2024 AEM reported group revenue of about S$730m, reinforcing stickiness and cross-sell potential across its installed base.
Wafer-to-package coverage
AEM provides wafer-level, module and final-package test solutions, enabling earlier defect detection and reduced downstream scrap; this end-to-end coverage improves customer yield and throughput and positions AEM as a lifecycle partner rather than a point-tool vendor.
Process optimization value
Equipment is engineered to optimize manufacturing efficiency and quality, improving takt time, alignment accuracy, and inspection fidelity to lower cost per unit while maintaining throughput.
Enhanced test coverage drives measurable reductions in field failures and RMAs, strengthening customer yield and brand trust.
Clear ROI cases from recent deployments underpin a premium pricing position, as buyers prioritize lifecycle cost savings and reliability.
Customization and engineering
AEM’s configurable platforms enable support across nodes including advanced 3 nm production adopted by foundries since 2022–23, letting AEM tailor handlers and inserts to device-specific process needs. This engineering customization aligns AEM closely with customer roadmaps, raising switching costs and fostering multi-year service and upgrade relationships that underpin recurring revenue.
- Configurable platforms for diverse nodes
- Device-specific handlers/inserts as competitive lever
- Deeper integration → higher switching costs
- Supports long-term customer relationships
Installed base and know-how
Deployed systems give granular operational data, customer feedback and case references that drive repeat wins and product improvements; industry studies in 2023–2024 show aftermarket and service revenue can account for roughly 25–35% of lifetime equipment revenue. Field knowledge from the installed base sharpens reliability engineering and speeds service response, reducing downtime in production environments. AEMs installed base creates recurring upgrade and retrofit revenue while validating performance claims in demanding industrial settings.
- data-driven references
- 25–35% aftermarket revenue
- improved reliability & service speed
- upgrade/retrofit revenue stream
Wafer-to-package platforms cut scrap, raise yield; aftermarket (25-35%)
AEM's integrated handlers, inserts and vision systems simplify vendor management and boost yield; 2024 group revenue ~S$730m evidences a strong installed base. End-to-end wafer-to-package coverage reduces scrap and RMAs, improving customer ROI. Configurable platforms (supporting sub-3nm) raise switching costs and drive aftermarket revenue (25–35% of lifetime equipment revenue).
| Metric | Value |
|---|---|
| 2024 revenue | S$730m |
| Aftermarket share | 25–35% |
What is included in the product
Detailed Word Document
Provides a concise SWOT analysis of AEM, highlighting core strengths, operational weaknesses, market opportunities, and external threats affecting its competitive position and growth prospects.
Customizable Excel Spreadsheet
Provides a focused SWOT matrix tailored to AEM for rapid strategic clarity and pain-point resolution, enabling teams to pinpoint risks and opportunities quickly and prioritize corrective actions.
Weaknesses
Customer concentration
Advanced test engagements at AEM concentrate revenue in a handful of marquee accounts, with several programs representing the bulk of near-term backlog. Reliance on limited customers heightens revenue volatility if OEM programs shift or are delayed. Material pricing or volume resets at these accounts can meaningfully swing quarterly results, so diversification of customer mix and program pipeline remains an ongoing imperative.
Cyclical exposure
Cyclical semiconductor capex drives AEM demand: industry capex swings have caused tool orders and utilization-linked services to fall sharply in downturns, with backlogs and visibility compressing quickly (industry capex dropped roughly 20–30% in recent downcycles), constantly testing planning and cost-structure flexibility.
Scale vs larger rivals
Smaller AEM faces scale pressure versus global ATE leaders — Teradyne and Advantest reported multi-billion-dollar revenues in 2024 and sustain deeper R&D and service footprints, widening technology gaps. Reduced scale limits AEM’s bargaining power with suppliers and large fab customers, compressing margins. Slower capital and service rollouts can delay entry into new geographies or test nodes, and brand recognition in conservative fabs can lag incumbents.
High R&D and customization costs
Engineering-intensive solutions force sustained R&D outlays and heavy customization, compressing margins as custom projects incur scope creep and rework; recovering non-recurring engineering (NRE) across low-volume programs is difficult, and a diversified product portfolio increases long-term support and warranty costs.
- High sustained R&D burden
- Scope creep → margin dilution
- Challenging NRE recovery
- Portfolio raises support costs
Geographic and supply constraints
Complex mechanical, optical and electronic assemblies for AEM rely on tight supply chains; component shortages and logistics bottlenecks have repeatedly delayed deliveries. Regional concentration is acute: over 70% of advanced semiconductor manufacturing capacity is in Taiwan and South Korea, heightening geopolitical and climate risks. Lead-time variability directly impacts customer satisfaction and order fill rates.
- Supply concentration: >70% advanced fabs in Taiwan/Korea
- High dependency on precision component suppliers
- Logistics bottlenecks → delayed deliveries
- Variable lead-times reduce customer satisfaction
Concentrated advanced-test revenue, >70% fabs in Taiwan/Korea; capex downcycles 20–30%
Advanced-test revenue is concentrated in a few marquee accounts, raising backlog and quarterly volatility if OEM programs shift. Cyclical semiconductor capex compresses orders—industry downcycles have cut capex roughly 20–30%. Supply-chain and regional concentration (>70% of advanced fabs in Taiwan/Korea) heighten delivery, geopolitical and lead-time risks.
| Risk | Metric |
|---|---|
| Fab concentration | >70% advanced fabs Taiwan/Korea |
| Capex cyclicality | ~20–30% downcycle swings |
Same Document Delivered
AEM SWOT Analysis
This is the actual AEM SWOT analysis document you’ll receive upon purchase—no surprises, just professional quality. The preview below is taken directly from the full report you'll get. Buy now to unlock the complete, editable version immediately after checkout.











