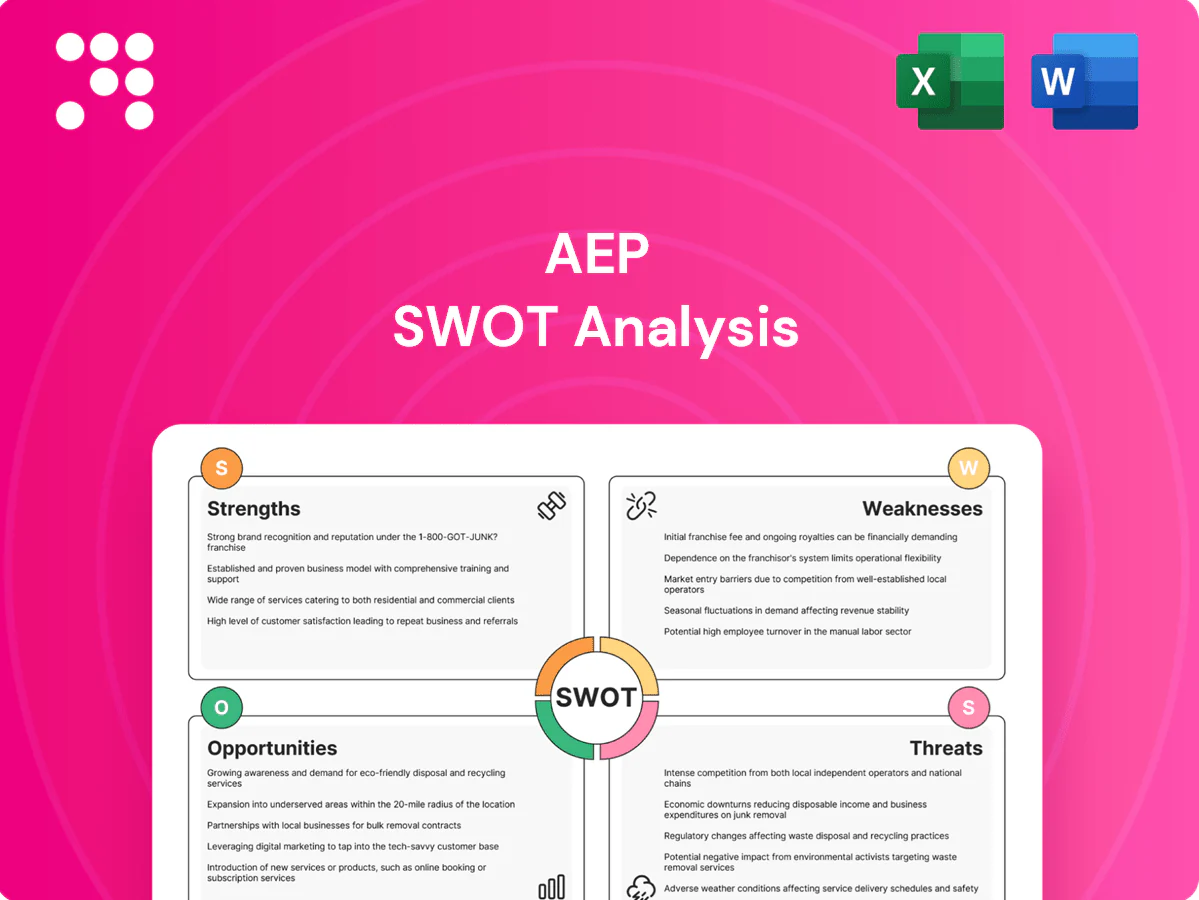
AEP SWOT Analysis

Make Insightful Decisions Backed by Expert Research
AEP’s SWOT snapshot reveals robust regulated earnings and grid-scale positioning, offset by regulatory risk and decarbonization costs. Our full SWOT unpacks financial context, strategic implications, and scenario-driven recommendations. Purchase the complete, editable Word + Excel report to plan, pitch, or invest with confidence.
Strengths

Scale and customer reach
AEP serves about 5.5 million retail and wholesale customers across 11 states, delivering stable revenue streams and load diversity. That scale improves purchasing power for fuel, equipment, and services, lowering unit costs. A broad customer mix across multiple regional economies reduces exposure to any single industry shock. Scale also bolsters regulatory credibility and stakeholder influence.
Extensive transmission network
AEP operates one of the largest high-voltage U.S. transmission systems, roughly 40,000 circuit miles, providing backbone reliability, congestion relief and interconnection capacity for new generation. Transmission assets earn regulated, lower-risk returns that stabilize cash flow and support AEP’s investment-grade profile. These lines are critical to integrating large-scale renewables and advancing grid modernization.

Diverse generation portfolio
AEP’s generation mix spans coal, natural gas, nuclear and renewables, supporting a balance of cost, reliability and emissions while serving about 5.5 million customers across 11 states. This fuel diversity reduces exposure to fuel-price swings and policy shocks, enables flexible dispatch across demand cycles, and lets AEP sequence transition investments without jeopardizing grid reliability.

Grid modernization focus
Regulated earnings stability
Regulated utility operations give AEP predictable cash flows via cost-of-service ratemaking, underpinning earnings stability and access to capital; credit ratings: S&P A-, Moody's A3 (2024–25). Rate-base growth from sustained infrastructure investment and automatic cost-recovery mechanisms reduces commodity and storm volatility, enhancing earnings visibility.
- Majority regulated earnings
- Rate-base led growth
- Cost-recovery riders
- Strong credit ratings (S&P A-, Moody's A3)
Regulated power: ~5.5M customers, ~40,000 mi, ratings A-/A3
AEP serves about 5.5 million customers across 11 states, operates roughly 40,000 circuit miles of transmission, maintains a diversified generation mix (coal, gas, nuclear, renewables), and benefits from regulated, rate-base earnings with credit ratings S&P A- and Moody’s A3.
| Metric | Value |
|---|---|
| Customers | ~5.5M |
| Transmission | ~40,000 mi |
| Credit ratings | S&P A-, Moody's A3 |
What is included in the product
 Detailed Word Document
Provides a concise SWOT overview of American Electric Power (AEP), outlining its core strengths, operational weaknesses, strategic growth opportunities, and external threats shaping future performance.

 Customizable Excel Spreadsheet
Provides a concise AEP SWOT matrix for fast, visual strategy alignment and stakeholder briefings; editable format lets teams quickly update strengths, weaknesses, opportunities and threats to reflect regulatory shifts and operational changes.
Weaknesses

Legacy coal exposure
Legacy coal exposure raises higher operating costs, mounting environmental liabilities and retirement capex for AEP; emissions compliance pressures rates and margins while AEP balances reliability with its net-zero by 2050 commitment. If policy tightens faster than planned, stranded asset risk could force accelerated retirements and increased write-offs.
Capital intensity
Capital intensity at AEP drives heavy sustained capex—roughly $9–10B per year as the company invests in transmission, generation transition and grid upgrades—raising financing needs and pushing net debt/EBITDA toward ~4x. Execution risks (project delays, supply-chain bottlenecks, input-cost inflation) can boost spending and timing risk. Regulatory rate recovery often lags spend, pressuring free cash flow and liquidity.

Regulatory complexity
Operating across 11 states and serving about 5.5 million customers exposes AEP to varied regulatory regimes and proceedings that can differ materially on allowed ROE, trackers and cost recovery. State-authorized ROEs commonly range from 8% to 11%, leading to divergent revenue outcomes. Prolonged rate cases and intensive compliance/stakeholder management tie up capital and create earnings uncertainty.

Environmental and storm liabilities
Extreme weather increases AEPs restoration costs and strains grid reliability, with recent multi-state outages prompting higher O&M and capital spending; coal ash remediation and plant decommissioning create long-duration reserve needs that pressure cash flow and credit metrics. Insurance and securitization structures leave residual exposures, and customer plus political scrutiny often intensifies after high-impact outages.
- Storm restoration costs: elevated post-major outages
- Coal ash/decommissioning: large long-term reserves required
- Insurance/securitization: potential coverage gaps
- Reputational risk: heightened customer & political scrutiny
Load growth sensitivity
Load growth sensitivity: shifts in industrial and commercial demand continue to pressure AEP revenue despite decoupling in some jurisdictions, while energy-efficiency measures and rooftop solar adoption dampen volumetric growth and margin expansion.
- Decoupling reduces but does not eliminate revenue exposure
- Distributed generation slows kWh growth
- Forecast errors risk mis-sized capacity
- Economic slowdowns cut sales and delay projects
Legacy coal, $9–10B/yr capex and ~4x leverage squeeze utilities toward net-zero
Legacy coal exposure raises operating costs, environmental liabilities and retirement capex while AEP balances reliability with a net-zero by 2050 target. High capital intensity (~$9–10B/yr) pushes net debt/EBITDA toward ~4x and strains cash flow when regulatory recovery lags. Multi-state regulation (allowed ROEs ~8–11%) and extreme-weather restoration add earnings volatility and reputational risk.
| Metric | Value |
|---|---|
| Customers | ~5.5M |
| Annual capex | $9–10B |
| Net debt/EBITDA | ~4x |
| Allowed ROE range | 8–11% |
What You See Is What You Get
AEP SWOT Analysis
This is the actual AEP SWOT Analysis document you’ll receive upon purchase—no surprises, just professional quality and structured insights. The preview below is taken directly from the full report and reflects the same content you'll download. Buy now to unlock the complete, editable version with full detail.

Make Insightful Decisions Backed by Expert Research
AEP’s SWOT snapshot reveals robust regulated earnings and grid-scale positioning, offset by regulatory risk and decarbonization costs. Our full SWOT unpacks financial context, strategic implications, and scenario-driven recommendations. Purchase the complete, editable Word + Excel report to plan, pitch, or invest with confidence.
Strengths
Scale and customer reach
AEP serves about 5.5 million retail and wholesale customers across 11 states, delivering stable revenue streams and load diversity. That scale improves purchasing power for fuel, equipment, and services, lowering unit costs. A broad customer mix across multiple regional economies reduces exposure to any single industry shock. Scale also bolsters regulatory credibility and stakeholder influence.
Extensive transmission network
AEP operates one of the largest high-voltage U.S. transmission systems, roughly 40,000 circuit miles, providing backbone reliability, congestion relief and interconnection capacity for new generation. Transmission assets earn regulated, lower-risk returns that stabilize cash flow and support AEP’s investment-grade profile. These lines are critical to integrating large-scale renewables and advancing grid modernization.
Diverse generation portfolio
AEP’s generation mix spans coal, natural gas, nuclear and renewables, supporting a balance of cost, reliability and emissions while serving about 5.5 million customers across 11 states. This fuel diversity reduces exposure to fuel-price swings and policy shocks, enables flexible dispatch across demand cycles, and lets AEP sequence transition investments without jeopardizing grid reliability.
Grid modernization focus
Regulated earnings stability
Regulated utility operations give AEP predictable cash flows via cost-of-service ratemaking, underpinning earnings stability and access to capital; credit ratings: S&P A-, Moody's A3 (2024–25). Rate-base growth from sustained infrastructure investment and automatic cost-recovery mechanisms reduces commodity and storm volatility, enhancing earnings visibility.
- Majority regulated earnings
- Rate-base led growth
- Cost-recovery riders
- Strong credit ratings (S&P A-, Moody's A3)
Regulated power: ~5.5M customers, ~40,000 mi, ratings A-/A3
AEP serves about 5.5 million customers across 11 states, operates roughly 40,000 circuit miles of transmission, maintains a diversified generation mix (coal, gas, nuclear, renewables), and benefits from regulated, rate-base earnings with credit ratings S&P A- and Moody’s A3.
| Metric | Value |
|---|---|
| Customers | ~5.5M |
| Transmission | ~40,000 mi |
| Credit ratings | S&P A-, Moody's A3 |
What is included in the product
Detailed Word Document
Provides a concise SWOT overview of American Electric Power (AEP), outlining its core strengths, operational weaknesses, strategic growth opportunities, and external threats shaping future performance.
Customizable Excel Spreadsheet
Provides a concise AEP SWOT matrix for fast, visual strategy alignment and stakeholder briefings; editable format lets teams quickly update strengths, weaknesses, opportunities and threats to reflect regulatory shifts and operational changes.
Weaknesses
Legacy coal exposure
Legacy coal exposure raises higher operating costs, mounting environmental liabilities and retirement capex for AEP; emissions compliance pressures rates and margins while AEP balances reliability with its net-zero by 2050 commitment. If policy tightens faster than planned, stranded asset risk could force accelerated retirements and increased write-offs.
Capital intensity
Capital intensity at AEP drives heavy sustained capex—roughly $9–10B per year as the company invests in transmission, generation transition and grid upgrades—raising financing needs and pushing net debt/EBITDA toward ~4x. Execution risks (project delays, supply-chain bottlenecks, input-cost inflation) can boost spending and timing risk. Regulatory rate recovery often lags spend, pressuring free cash flow and liquidity.
Regulatory complexity
Operating across 11 states and serving about 5.5 million customers exposes AEP to varied regulatory regimes and proceedings that can differ materially on allowed ROE, trackers and cost recovery. State-authorized ROEs commonly range from 8% to 11%, leading to divergent revenue outcomes. Prolonged rate cases and intensive compliance/stakeholder management tie up capital and create earnings uncertainty.
Environmental and storm liabilities
Extreme weather increases AEPs restoration costs and strains grid reliability, with recent multi-state outages prompting higher O&M and capital spending; coal ash remediation and plant decommissioning create long-duration reserve needs that pressure cash flow and credit metrics. Insurance and securitization structures leave residual exposures, and customer plus political scrutiny often intensifies after high-impact outages.
- Storm restoration costs: elevated post-major outages
- Coal ash/decommissioning: large long-term reserves required
- Insurance/securitization: potential coverage gaps
- Reputational risk: heightened customer & political scrutiny
Load growth sensitivity
Load growth sensitivity: shifts in industrial and commercial demand continue to pressure AEP revenue despite decoupling in some jurisdictions, while energy-efficiency measures and rooftop solar adoption dampen volumetric growth and margin expansion.
- Decoupling reduces but does not eliminate revenue exposure
- Distributed generation slows kWh growth
- Forecast errors risk mis-sized capacity
- Economic slowdowns cut sales and delay projects
Legacy coal, $9–10B/yr capex and ~4x leverage squeeze utilities toward net-zero
Legacy coal exposure raises operating costs, environmental liabilities and retirement capex while AEP balances reliability with a net-zero by 2050 target. High capital intensity (~$9–10B/yr) pushes net debt/EBITDA toward ~4x and strains cash flow when regulatory recovery lags. Multi-state regulation (allowed ROEs ~8–11%) and extreme-weather restoration add earnings volatility and reputational risk.
| Metric | Value |
|---|---|
| Customers | ~5.5M |
| Annual capex | $9–10B |
| Net debt/EBITDA | ~4x |
| Allowed ROE range | 8–11% |
What You See Is What You Get
AEP SWOT Analysis
This is the actual AEP SWOT Analysis document you’ll receive upon purchase—no surprises, just professional quality and structured insights. The preview below is taken directly from the full report and reflects the same content you'll download. Buy now to unlock the complete, editable version with full detail.
Original: $10.00
-65%$10.00
$3.50Description
Make Insightful Decisions Backed by Expert Research
AEP’s SWOT snapshot reveals robust regulated earnings and grid-scale positioning, offset by regulatory risk and decarbonization costs. Our full SWOT unpacks financial context, strategic implications, and scenario-driven recommendations. Purchase the complete, editable Word + Excel report to plan, pitch, or invest with confidence.
Strengths
Scale and customer reach
AEP serves about 5.5 million retail and wholesale customers across 11 states, delivering stable revenue streams and load diversity. That scale improves purchasing power for fuel, equipment, and services, lowering unit costs. A broad customer mix across multiple regional economies reduces exposure to any single industry shock. Scale also bolsters regulatory credibility and stakeholder influence.
Extensive transmission network
AEP operates one of the largest high-voltage U.S. transmission systems, roughly 40,000 circuit miles, providing backbone reliability, congestion relief and interconnection capacity for new generation. Transmission assets earn regulated, lower-risk returns that stabilize cash flow and support AEP’s investment-grade profile. These lines are critical to integrating large-scale renewables and advancing grid modernization.
Diverse generation portfolio
AEP’s generation mix spans coal, natural gas, nuclear and renewables, supporting a balance of cost, reliability and emissions while serving about 5.5 million customers across 11 states. This fuel diversity reduces exposure to fuel-price swings and policy shocks, enables flexible dispatch across demand cycles, and lets AEP sequence transition investments without jeopardizing grid reliability.
Grid modernization focus
Regulated earnings stability
Regulated utility operations give AEP predictable cash flows via cost-of-service ratemaking, underpinning earnings stability and access to capital; credit ratings: S&P A-, Moody's A3 (2024–25). Rate-base growth from sustained infrastructure investment and automatic cost-recovery mechanisms reduces commodity and storm volatility, enhancing earnings visibility.
- Majority regulated earnings
- Rate-base led growth
- Cost-recovery riders
- Strong credit ratings (S&P A-, Moody's A3)
Regulated power: ~5.5M customers, ~40,000 mi, ratings A-/A3
AEP serves about 5.5 million customers across 11 states, operates roughly 40,000 circuit miles of transmission, maintains a diversified generation mix (coal, gas, nuclear, renewables), and benefits from regulated, rate-base earnings with credit ratings S&P A- and Moody’s A3.
| Metric | Value |
|---|---|
| Customers | ~5.5M |
| Transmission | ~40,000 mi |
| Credit ratings | S&P A-, Moody's A3 |
What is included in the product
Detailed Word Document
Provides a concise SWOT overview of American Electric Power (AEP), outlining its core strengths, operational weaknesses, strategic growth opportunities, and external threats shaping future performance.
Customizable Excel Spreadsheet
Provides a concise AEP SWOT matrix for fast, visual strategy alignment and stakeholder briefings; editable format lets teams quickly update strengths, weaknesses, opportunities and threats to reflect regulatory shifts and operational changes.
Weaknesses
Legacy coal exposure
Legacy coal exposure raises higher operating costs, mounting environmental liabilities and retirement capex for AEP; emissions compliance pressures rates and margins while AEP balances reliability with its net-zero by 2050 commitment. If policy tightens faster than planned, stranded asset risk could force accelerated retirements and increased write-offs.
Capital intensity
Capital intensity at AEP drives heavy sustained capex—roughly $9–10B per year as the company invests in transmission, generation transition and grid upgrades—raising financing needs and pushing net debt/EBITDA toward ~4x. Execution risks (project delays, supply-chain bottlenecks, input-cost inflation) can boost spending and timing risk. Regulatory rate recovery often lags spend, pressuring free cash flow and liquidity.
Regulatory complexity
Operating across 11 states and serving about 5.5 million customers exposes AEP to varied regulatory regimes and proceedings that can differ materially on allowed ROE, trackers and cost recovery. State-authorized ROEs commonly range from 8% to 11%, leading to divergent revenue outcomes. Prolonged rate cases and intensive compliance/stakeholder management tie up capital and create earnings uncertainty.
Environmental and storm liabilities
Extreme weather increases AEPs restoration costs and strains grid reliability, with recent multi-state outages prompting higher O&M and capital spending; coal ash remediation and plant decommissioning create long-duration reserve needs that pressure cash flow and credit metrics. Insurance and securitization structures leave residual exposures, and customer plus political scrutiny often intensifies after high-impact outages.
- Storm restoration costs: elevated post-major outages
- Coal ash/decommissioning: large long-term reserves required
- Insurance/securitization: potential coverage gaps
- Reputational risk: heightened customer & political scrutiny
Load growth sensitivity
Load growth sensitivity: shifts in industrial and commercial demand continue to pressure AEP revenue despite decoupling in some jurisdictions, while energy-efficiency measures and rooftop solar adoption dampen volumetric growth and margin expansion.
- Decoupling reduces but does not eliminate revenue exposure
- Distributed generation slows kWh growth
- Forecast errors risk mis-sized capacity
- Economic slowdowns cut sales and delay projects
Legacy coal, $9–10B/yr capex and ~4x leverage squeeze utilities toward net-zero
Legacy coal exposure raises operating costs, environmental liabilities and retirement capex while AEP balances reliability with a net-zero by 2050 target. High capital intensity (~$9–10B/yr) pushes net debt/EBITDA toward ~4x and strains cash flow when regulatory recovery lags. Multi-state regulation (allowed ROEs ~8–11%) and extreme-weather restoration add earnings volatility and reputational risk.
| Metric | Value |
|---|---|
| Customers | ~5.5M |
| Annual capex | $9–10B |
| Net debt/EBITDA | ~4x |
| Allowed ROE range | 8–11% |
What You See Is What You Get
AEP SWOT Analysis
This is the actual AEP SWOT Analysis document you’ll receive upon purchase—no surprises, just professional quality and structured insights. The preview below is taken directly from the full report and reflects the same content you'll download. Buy now to unlock the complete, editable version with full detail.











