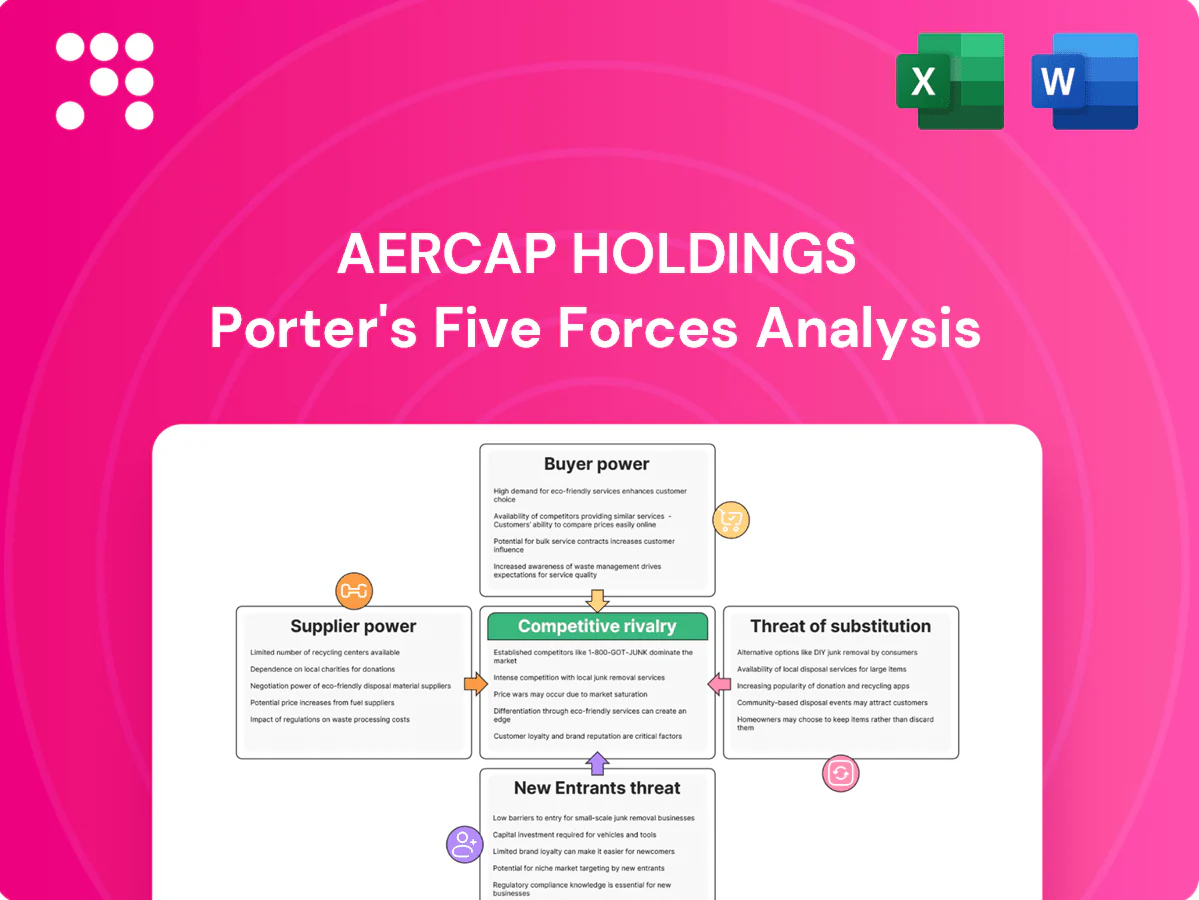
AerCap Holdings Porter's Five Forces Analysis

Go Beyond the Preview—Access the Full Strategic Report
AerCap Holdings faces intense competitive rivalry, concentrated supplier power for aircraft OEMs, and moderate buyer leverage from airlines, while barriers to entry and substitutes remain limited but evolving. This brief snapshot highlights key pressure points but only scratches the surface. Unlock the full Porter's Five Forces Analysis to explore AerCap’s strategic options and risk exposures in detail. Get the complete, consultant-grade report for actionable insights.
Suppliers Bargaining Power

OEM duopoly limits choice
Airbus and Boeing account for roughly 90% of new commercial jet supply and held a combined backlog of about 12,000 aircraft in 2024, constraining AerCap's price and delivery flexibility. Deep backlogs bolster OEM leverage over slot allocation and discounting. Certification and strict configuration control further strengthen OEM negotiating power. AerCap offsets this through scale ordering and diversified fleet planning, leveraging its ~1,600‑aircraft platform.
Engine makers exert leverage
GE, Pratt & Whitney and Rolls-Royce tightly control engines, parts and aftermarket access, collectively accounting for roughly 95% of large commercial engine aftermarket (2024), letting them shape lifecycle costs via power-by-the-hour and exclusivity norms. Technical data and MRO approvals further lock lessors into supplier ecosystems. AerCap’s scale—over 2,000 aircraft (2024) and pooled spares—improves its negotiating leverage on pricing and support terms.

Capital providers shape terms
Leasing is funding-intensive, so banks, bondholders and insurers act as key capital suppliers to AerCap; AerCap owned about 1,850 aircraft and a fleet valued at over $65 billion in 2024, giving it investment-grade scale versus smaller peers. Rate cycles and spreads — with the 10-year Treasury around 4% in 2024 — and ABS market windows directly affect AerCap’s cost of goods sold. Tightening credit conditions can quickly shift bargaining power back to lenders despite AerCap’s scale.

MRO and parts ecosystems matter
Approved repair stations and parts distributors materially affect AerCap turnaround times and costs, with the global commercial MRO market around $85 billion in 2024 increasing bargaining leverage; supply-chain bottlenecks in 2023–24 extended ground time, risking lease non‑compliance and revenue loss. Volume agreements and AerCap’s ~1,800‑aircraft scale and global network partially offset supplier power, though engine shop capacity constraints remain a structural pinch point.
- Approved MROs/parts control turnaround times and pricing
- Supply‑chain delays → longer ground time, lease risk
- Scale/volume agreements mitigate but do not eliminate supplier power
- Engine shop capacity is the persistent bottleneck
Helicopter and niche OEMs add nuance
Rotorcraft and engine markets are concentrated around a few OEMs — Airbus Helicopters, Leonardo, Bell and Sikorsky — and major engine suppliers like Pratt & Whitney, GE and Rolls‑Royce, which strengthens supplier bargaining power. Specialized mission equipment (MEDEVAC, SAR, ISR) raises switching costs and locks lessees into supplier ecosystems. AerCap’s diversified fleet exposure mitigates single‑supplier dependence but cannot eliminate scarcity economics in thin rotorcraft segments. Residual values in niche rotorcraft markets are more volatile, increasing lessor risk.
- Concentration: Few OEMs (Airbus, Leonardo, Bell, Sikorsky)
- Switching costs: Specialized mission kits raise exit barriers
- Diversification: AerCap reduces single‑supplier risk but not scarcity
- Residual risk: Thinner markets → higher residual‑value sensitivity
OEM and engine duopolies tighten pricing and delivery leverage; credit and MRO pinch points persist
OEM concentration (Airbus+Boeing ~90%, backlog ~12,000 in 2024) and engine aftermarket concentration (~95% by GE/PW/RR) give suppliers strong leverage over price, delivery and lifecycle costs. AerCap’s scale (≈1,600 aircraft platform; fleet value >$65bn in 2024) mitigates but does not eliminate supplier power. Credit and MRO capacity remain key pinch points.
| Supplier | 2024 metric |
|---|---|
| Airbus+Boeing | ~90% new jets; backlog ~12,000 |
| Engine OEMs | ~95% large-engine aftermarket |
| AerCap scale | ~1,600 aircraft; >$65bn fleet |
What is included in the product
 Detailed Word Document
Tailored Porter’s Five Forces analysis of AerCap Holdings assessing competitive rivalry, supplier and buyer bargaining power, threat of new entrants and substitutes, and identifying disruptive technologies and regulatory or capital barriers that shape pricing, profitability, and strategic positioning.

 Customizable Excel Spreadsheet
A concise one-sheet Porter’s Five Forces analysis for AerCap Holdings that clarifies supplier, buyer, entrant, substitute, and rivalry pressures—instantly reducing strategic uncertainty and speeding data-driven decisions.
Customers Bargaining Power

Airline fragmentation vs flag carrier clout
AerCap, the world’s largest aircraft lessor with a fleet of over 2,000 aircraft, serves a broad customer base, yet large network carriers and scale-focused low-cost carriers press for lower lease rates and tougher terms. Their fleet scale and stronger credit profiles translate into measurable bargaining leverage versus smaller regional or startup airlines. Smaller carriers accept tighter covenants and premium rents to access capacity. AerCap manages a diversified mix to stabilize portfolio yield.
Sale-leaseback alternatives
Airlines can pit competing lessors for sale-leasebacks, driving price competition in hot markets; AerCap faces this amid an environment where Airbus and Boeing combined backlog exceeded 14,000 jets (end-2023), making SLBs more valuable when OEM slots are scarce. That scarcity amplifies buyers willingness to pay, compressing margins during upcycles, though relationship depth and speed of execution often outweigh lowest-price bids.

Switching and standardization
Common aircraft types (A320/737 families) make operational switching cheaper, with single‑aisle jets accounting for roughly 70% of in‑service demand in 2024, reducing customer bargaining on type. Lease novations, maintenance status and strict return conditions still add friction and cost, often making availability timing more decisive than small rate differences. AerCap, the largest lessor with over 1,700 owned and managed aircraft in 2024, gains higher match rates across tenant needs.

Credit cycles shift leverage
Credit cycles shift leverage: in downturns distressed carriers accept stricter terms or early returns, reducing buyer power, while in strong 2024 demand periods airlines pushed for concessions and incentives as utilization rose; macro volatility redistributes negotiating leverage over time and AerCap prices for cycle risk and counterparty dispersion, with policy rates near 5.25–5.50% in 2024.
- Downturns: stricter terms, lower buyer power
- Upswings: carriers seek concessions
- Macro: leverage shifts over cycles
- AerCap: prices cycle risk, diversifies counterparties
ESG and fuel efficiency demands
Buyers increasingly prefer new-gen, lower-emission aircraft, narrowing acceptable options and concentrating negotiating power; A320neo and 737 MAX families offer up to 20% lower fuel burn, boosting demand for scarce models and enabling select customers to extract better terms and delivery priority. Green preferences also allow airlines to justify paying premiums for latest tech, and AerCap, the world’s largest aircraft lessor, leverages scale pipeline access to meet these needs.
- Up to 20% fuel burn improvement
- Concentrated demand = stronger buyer leverage
- Premium pricing for newest tech
- AerCap scale = pipeline access at scale
Lessors squeezed as single-aisles ≈70%; scarce neo/MAX boost buyer clout
AerCap (fleet >2,000; 1,700+ owned/managed in 2024) faces strong buyer leverage from large carriers and LCCs pressing for lower rates. Single-aisles ≈70% of demand in 2024 and scarce A320neo/737 MAX (up to 20% fuel savings) concentrate negotiating power. Cycles and 2024 policy rates ~5.25–5.50% shift leverage.
| Metric | Value |
|---|---|
| Fleet | >2,000 |
| Single-aisle demand 2024 | ≈70% |
| Policy rates 2024 | 5.25–5.50% |
Full Version Awaits
AerCap Holdings Porter's Five Forces Analysis
This preview shows the exact AerCap Holdings Porter's Five Forces analysis you'll receive upon purchase—fully formatted and ready to use. The file contains the complete competitive assessment, insights, and implications for strategy and investment. No samples or placeholders; instant access after payment.

Go Beyond the Preview—Access the Full Strategic Report
AerCap Holdings faces intense competitive rivalry, concentrated supplier power for aircraft OEMs, and moderate buyer leverage from airlines, while barriers to entry and substitutes remain limited but evolving. This brief snapshot highlights key pressure points but only scratches the surface. Unlock the full Porter's Five Forces Analysis to explore AerCap’s strategic options and risk exposures in detail. Get the complete, consultant-grade report for actionable insights.
Suppliers Bargaining Power
OEM duopoly limits choice
Airbus and Boeing account for roughly 90% of new commercial jet supply and held a combined backlog of about 12,000 aircraft in 2024, constraining AerCap's price and delivery flexibility. Deep backlogs bolster OEM leverage over slot allocation and discounting. Certification and strict configuration control further strengthen OEM negotiating power. AerCap offsets this through scale ordering and diversified fleet planning, leveraging its ~1,600‑aircraft platform.
Engine makers exert leverage
GE, Pratt & Whitney and Rolls-Royce tightly control engines, parts and aftermarket access, collectively accounting for roughly 95% of large commercial engine aftermarket (2024), letting them shape lifecycle costs via power-by-the-hour and exclusivity norms. Technical data and MRO approvals further lock lessors into supplier ecosystems. AerCap’s scale—over 2,000 aircraft (2024) and pooled spares—improves its negotiating leverage on pricing and support terms.
Capital providers shape terms
Leasing is funding-intensive, so banks, bondholders and insurers act as key capital suppliers to AerCap; AerCap owned about 1,850 aircraft and a fleet valued at over $65 billion in 2024, giving it investment-grade scale versus smaller peers. Rate cycles and spreads — with the 10-year Treasury around 4% in 2024 — and ABS market windows directly affect AerCap’s cost of goods sold. Tightening credit conditions can quickly shift bargaining power back to lenders despite AerCap’s scale.
MRO and parts ecosystems matter
Approved repair stations and parts distributors materially affect AerCap turnaround times and costs, with the global commercial MRO market around $85 billion in 2024 increasing bargaining leverage; supply-chain bottlenecks in 2023–24 extended ground time, risking lease non‑compliance and revenue loss. Volume agreements and AerCap’s ~1,800‑aircraft scale and global network partially offset supplier power, though engine shop capacity constraints remain a structural pinch point.
- Approved MROs/parts control turnaround times and pricing
- Supply‑chain delays → longer ground time, lease risk
- Scale/volume agreements mitigate but do not eliminate supplier power
- Engine shop capacity is the persistent bottleneck
Helicopter and niche OEMs add nuance
Rotorcraft and engine markets are concentrated around a few OEMs — Airbus Helicopters, Leonardo, Bell and Sikorsky — and major engine suppliers like Pratt & Whitney, GE and Rolls‑Royce, which strengthens supplier bargaining power. Specialized mission equipment (MEDEVAC, SAR, ISR) raises switching costs and locks lessees into supplier ecosystems. AerCap’s diversified fleet exposure mitigates single‑supplier dependence but cannot eliminate scarcity economics in thin rotorcraft segments. Residual values in niche rotorcraft markets are more volatile, increasing lessor risk.
- Concentration: Few OEMs (Airbus, Leonardo, Bell, Sikorsky)
- Switching costs: Specialized mission kits raise exit barriers
- Diversification: AerCap reduces single‑supplier risk but not scarcity
- Residual risk: Thinner markets → higher residual‑value sensitivity
OEM and engine duopolies tighten pricing and delivery leverage; credit and MRO pinch points persist
OEM concentration (Airbus+Boeing ~90%, backlog ~12,000 in 2024) and engine aftermarket concentration (~95% by GE/PW/RR) give suppliers strong leverage over price, delivery and lifecycle costs. AerCap’s scale (≈1,600 aircraft platform; fleet value >$65bn in 2024) mitigates but does not eliminate supplier power. Credit and MRO capacity remain key pinch points.
| Supplier | 2024 metric |
|---|---|
| Airbus+Boeing | ~90% new jets; backlog ~12,000 |
| Engine OEMs | ~95% large-engine aftermarket |
| AerCap scale | ~1,600 aircraft; >$65bn fleet |
What is included in the product
Detailed Word Document
Tailored Porter’s Five Forces analysis of AerCap Holdings assessing competitive rivalry, supplier and buyer bargaining power, threat of new entrants and substitutes, and identifying disruptive technologies and regulatory or capital barriers that shape pricing, profitability, and strategic positioning.
Customizable Excel Spreadsheet
A concise one-sheet Porter’s Five Forces analysis for AerCap Holdings that clarifies supplier, buyer, entrant, substitute, and rivalry pressures—instantly reducing strategic uncertainty and speeding data-driven decisions.
Customers Bargaining Power
Airline fragmentation vs flag carrier clout
AerCap, the world’s largest aircraft lessor with a fleet of over 2,000 aircraft, serves a broad customer base, yet large network carriers and scale-focused low-cost carriers press for lower lease rates and tougher terms. Their fleet scale and stronger credit profiles translate into measurable bargaining leverage versus smaller regional or startup airlines. Smaller carriers accept tighter covenants and premium rents to access capacity. AerCap manages a diversified mix to stabilize portfolio yield.
Sale-leaseback alternatives
Airlines can pit competing lessors for sale-leasebacks, driving price competition in hot markets; AerCap faces this amid an environment where Airbus and Boeing combined backlog exceeded 14,000 jets (end-2023), making SLBs more valuable when OEM slots are scarce. That scarcity amplifies buyers willingness to pay, compressing margins during upcycles, though relationship depth and speed of execution often outweigh lowest-price bids.
Switching and standardization
Common aircraft types (A320/737 families) make operational switching cheaper, with single‑aisle jets accounting for roughly 70% of in‑service demand in 2024, reducing customer bargaining on type. Lease novations, maintenance status and strict return conditions still add friction and cost, often making availability timing more decisive than small rate differences. AerCap, the largest lessor with over 1,700 owned and managed aircraft in 2024, gains higher match rates across tenant needs.
Credit cycles shift leverage
Credit cycles shift leverage: in downturns distressed carriers accept stricter terms or early returns, reducing buyer power, while in strong 2024 demand periods airlines pushed for concessions and incentives as utilization rose; macro volatility redistributes negotiating leverage over time and AerCap prices for cycle risk and counterparty dispersion, with policy rates near 5.25–5.50% in 2024.
- Downturns: stricter terms, lower buyer power
- Upswings: carriers seek concessions
- Macro: leverage shifts over cycles
- AerCap: prices cycle risk, diversifies counterparties
ESG and fuel efficiency demands
Buyers increasingly prefer new-gen, lower-emission aircraft, narrowing acceptable options and concentrating negotiating power; A320neo and 737 MAX families offer up to 20% lower fuel burn, boosting demand for scarce models and enabling select customers to extract better terms and delivery priority. Green preferences also allow airlines to justify paying premiums for latest tech, and AerCap, the world’s largest aircraft lessor, leverages scale pipeline access to meet these needs.
- Up to 20% fuel burn improvement
- Concentrated demand = stronger buyer leverage
- Premium pricing for newest tech
- AerCap scale = pipeline access at scale
Lessors squeezed as single-aisles ≈70%; scarce neo/MAX boost buyer clout
AerCap (fleet >2,000; 1,700+ owned/managed in 2024) faces strong buyer leverage from large carriers and LCCs pressing for lower rates. Single-aisles ≈70% of demand in 2024 and scarce A320neo/737 MAX (up to 20% fuel savings) concentrate negotiating power. Cycles and 2024 policy rates ~5.25–5.50% shift leverage.
| Metric | Value |
|---|---|
| Fleet | >2,000 |
| Single-aisle demand 2024 | ≈70% |
| Policy rates 2024 | 5.25–5.50% |
Full Version Awaits
AerCap Holdings Porter's Five Forces Analysis
This preview shows the exact AerCap Holdings Porter's Five Forces analysis you'll receive upon purchase—fully formatted and ready to use. The file contains the complete competitive assessment, insights, and implications for strategy and investment. No samples or placeholders; instant access after payment.
Original: $10.00
-65%$10.00
$3.50Description
Go Beyond the Preview—Access the Full Strategic Report
AerCap Holdings faces intense competitive rivalry, concentrated supplier power for aircraft OEMs, and moderate buyer leverage from airlines, while barriers to entry and substitutes remain limited but evolving. This brief snapshot highlights key pressure points but only scratches the surface. Unlock the full Porter's Five Forces Analysis to explore AerCap’s strategic options and risk exposures in detail. Get the complete, consultant-grade report for actionable insights.
Suppliers Bargaining Power
OEM duopoly limits choice
Airbus and Boeing account for roughly 90% of new commercial jet supply and held a combined backlog of about 12,000 aircraft in 2024, constraining AerCap's price and delivery flexibility. Deep backlogs bolster OEM leverage over slot allocation and discounting. Certification and strict configuration control further strengthen OEM negotiating power. AerCap offsets this through scale ordering and diversified fleet planning, leveraging its ~1,600‑aircraft platform.
Engine makers exert leverage
GE, Pratt & Whitney and Rolls-Royce tightly control engines, parts and aftermarket access, collectively accounting for roughly 95% of large commercial engine aftermarket (2024), letting them shape lifecycle costs via power-by-the-hour and exclusivity norms. Technical data and MRO approvals further lock lessors into supplier ecosystems. AerCap’s scale—over 2,000 aircraft (2024) and pooled spares—improves its negotiating leverage on pricing and support terms.
Capital providers shape terms
Leasing is funding-intensive, so banks, bondholders and insurers act as key capital suppliers to AerCap; AerCap owned about 1,850 aircraft and a fleet valued at over $65 billion in 2024, giving it investment-grade scale versus smaller peers. Rate cycles and spreads — with the 10-year Treasury around 4% in 2024 — and ABS market windows directly affect AerCap’s cost of goods sold. Tightening credit conditions can quickly shift bargaining power back to lenders despite AerCap’s scale.
MRO and parts ecosystems matter
Approved repair stations and parts distributors materially affect AerCap turnaround times and costs, with the global commercial MRO market around $85 billion in 2024 increasing bargaining leverage; supply-chain bottlenecks in 2023–24 extended ground time, risking lease non‑compliance and revenue loss. Volume agreements and AerCap’s ~1,800‑aircraft scale and global network partially offset supplier power, though engine shop capacity constraints remain a structural pinch point.
- Approved MROs/parts control turnaround times and pricing
- Supply‑chain delays → longer ground time, lease risk
- Scale/volume agreements mitigate but do not eliminate supplier power
- Engine shop capacity is the persistent bottleneck
Helicopter and niche OEMs add nuance
Rotorcraft and engine markets are concentrated around a few OEMs — Airbus Helicopters, Leonardo, Bell and Sikorsky — and major engine suppliers like Pratt & Whitney, GE and Rolls‑Royce, which strengthens supplier bargaining power. Specialized mission equipment (MEDEVAC, SAR, ISR) raises switching costs and locks lessees into supplier ecosystems. AerCap’s diversified fleet exposure mitigates single‑supplier dependence but cannot eliminate scarcity economics in thin rotorcraft segments. Residual values in niche rotorcraft markets are more volatile, increasing lessor risk.
- Concentration: Few OEMs (Airbus, Leonardo, Bell, Sikorsky)
- Switching costs: Specialized mission kits raise exit barriers
- Diversification: AerCap reduces single‑supplier risk but not scarcity
- Residual risk: Thinner markets → higher residual‑value sensitivity
OEM and engine duopolies tighten pricing and delivery leverage; credit and MRO pinch points persist
OEM concentration (Airbus+Boeing ~90%, backlog ~12,000 in 2024) and engine aftermarket concentration (~95% by GE/PW/RR) give suppliers strong leverage over price, delivery and lifecycle costs. AerCap’s scale (≈1,600 aircraft platform; fleet value >$65bn in 2024) mitigates but does not eliminate supplier power. Credit and MRO capacity remain key pinch points.
| Supplier | 2024 metric |
|---|---|
| Airbus+Boeing | ~90% new jets; backlog ~12,000 |
| Engine OEMs | ~95% large-engine aftermarket |
| AerCap scale | ~1,600 aircraft; >$65bn fleet |
What is included in the product
Detailed Word Document
Tailored Porter’s Five Forces analysis of AerCap Holdings assessing competitive rivalry, supplier and buyer bargaining power, threat of new entrants and substitutes, and identifying disruptive technologies and regulatory or capital barriers that shape pricing, profitability, and strategic positioning.
Customizable Excel Spreadsheet
A concise one-sheet Porter’s Five Forces analysis for AerCap Holdings that clarifies supplier, buyer, entrant, substitute, and rivalry pressures—instantly reducing strategic uncertainty and speeding data-driven decisions.
Customers Bargaining Power
Airline fragmentation vs flag carrier clout
AerCap, the world’s largest aircraft lessor with a fleet of over 2,000 aircraft, serves a broad customer base, yet large network carriers and scale-focused low-cost carriers press for lower lease rates and tougher terms. Their fleet scale and stronger credit profiles translate into measurable bargaining leverage versus smaller regional or startup airlines. Smaller carriers accept tighter covenants and premium rents to access capacity. AerCap manages a diversified mix to stabilize portfolio yield.
Sale-leaseback alternatives
Airlines can pit competing lessors for sale-leasebacks, driving price competition in hot markets; AerCap faces this amid an environment where Airbus and Boeing combined backlog exceeded 14,000 jets (end-2023), making SLBs more valuable when OEM slots are scarce. That scarcity amplifies buyers willingness to pay, compressing margins during upcycles, though relationship depth and speed of execution often outweigh lowest-price bids.
Switching and standardization
Common aircraft types (A320/737 families) make operational switching cheaper, with single‑aisle jets accounting for roughly 70% of in‑service demand in 2024, reducing customer bargaining on type. Lease novations, maintenance status and strict return conditions still add friction and cost, often making availability timing more decisive than small rate differences. AerCap, the largest lessor with over 1,700 owned and managed aircraft in 2024, gains higher match rates across tenant needs.
Credit cycles shift leverage
Credit cycles shift leverage: in downturns distressed carriers accept stricter terms or early returns, reducing buyer power, while in strong 2024 demand periods airlines pushed for concessions and incentives as utilization rose; macro volatility redistributes negotiating leverage over time and AerCap prices for cycle risk and counterparty dispersion, with policy rates near 5.25–5.50% in 2024.
- Downturns: stricter terms, lower buyer power
- Upswings: carriers seek concessions
- Macro: leverage shifts over cycles
- AerCap: prices cycle risk, diversifies counterparties
ESG and fuel efficiency demands
Buyers increasingly prefer new-gen, lower-emission aircraft, narrowing acceptable options and concentrating negotiating power; A320neo and 737 MAX families offer up to 20% lower fuel burn, boosting demand for scarce models and enabling select customers to extract better terms and delivery priority. Green preferences also allow airlines to justify paying premiums for latest tech, and AerCap, the world’s largest aircraft lessor, leverages scale pipeline access to meet these needs.
- Up to 20% fuel burn improvement
- Concentrated demand = stronger buyer leverage
- Premium pricing for newest tech
- AerCap scale = pipeline access at scale
Lessors squeezed as single-aisles ≈70%; scarce neo/MAX boost buyer clout
AerCap (fleet >2,000; 1,700+ owned/managed in 2024) faces strong buyer leverage from large carriers and LCCs pressing for lower rates. Single-aisles ≈70% of demand in 2024 and scarce A320neo/737 MAX (up to 20% fuel savings) concentrate negotiating power. Cycles and 2024 policy rates ~5.25–5.50% shift leverage.
| Metric | Value |
|---|---|
| Fleet | >2,000 |
| Single-aisle demand 2024 | ≈70% |
| Policy rates 2024 | 5.25–5.50% |
Full Version Awaits
AerCap Holdings Porter's Five Forces Analysis
This preview shows the exact AerCap Holdings Porter's Five Forces analysis you'll receive upon purchase—fully formatted and ready to use. The file contains the complete competitive assessment, insights, and implications for strategy and investment. No samples or placeholders; instant access after payment.











