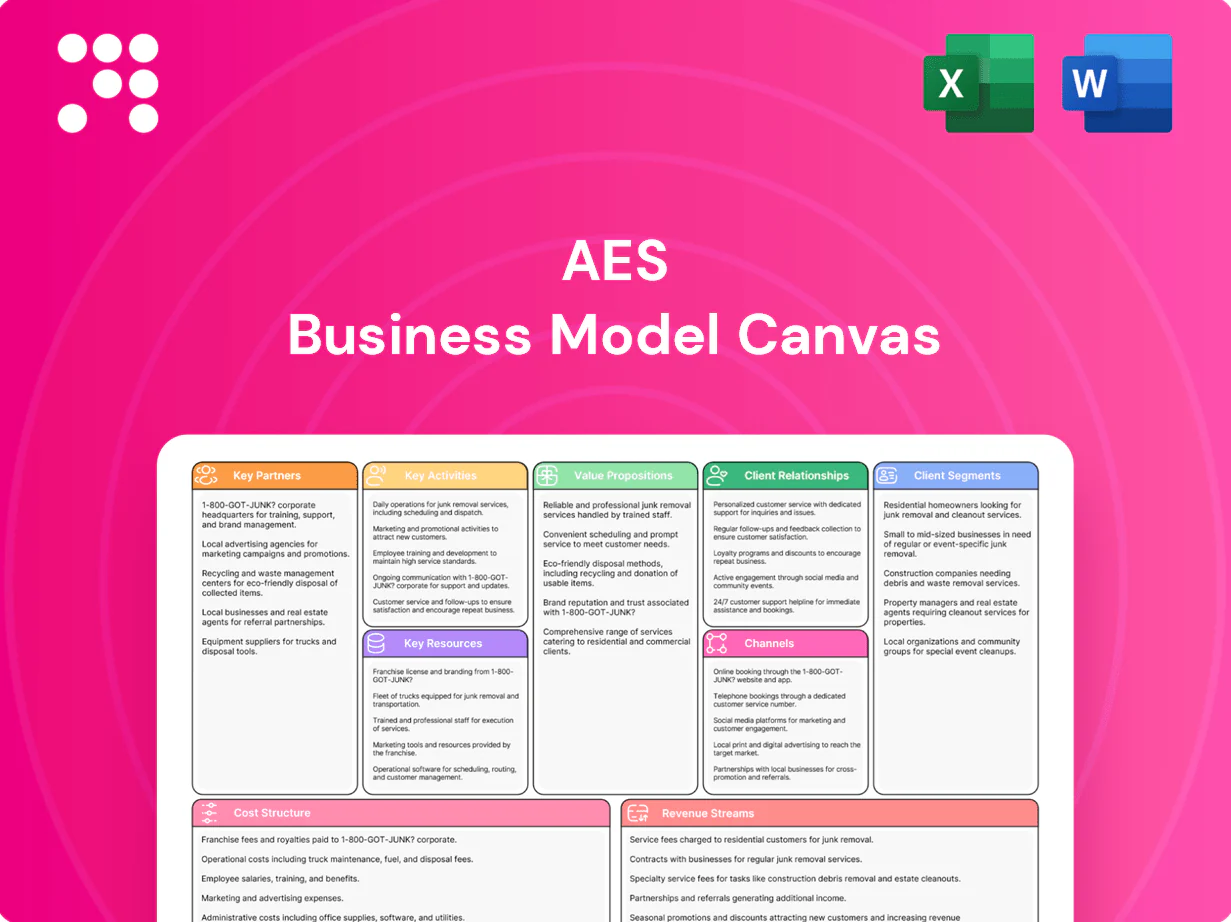
AES Business Model Canvas

Unlock the strategic playbook with a concise Business Model Canvas snapshot
Unlock AES’s strategic playbook with a concise Business Model Canvas that maps value propositions, customer segments, and revenue streams. This snapshot reveals how AES scales, partners, and manages costs to stay competitive. Purchase the full, editable Canvas (Word and Excel) for a section-by-section guide to replicate and adapt their success.
Partnerships

Utility and grid operators
AES partners with transmission and distribution operators to interconnect plants and stabilize grids, coordinating joint planning that in practice uses 10–20 year offtake and interconnection timelines to align investments and regulatory approvals.
These relationships enable grid modernization and smart integration of renewables, with AES and partners deploying utility-scale controls and storage that have supported curtailment reductions reported in industry cases of roughly 20–30%.
Long-term agreements and coordinated planning improve reliability and reduce congestion, enabling AES to optimize dispatch across fleets and meet expanding grid flexibility needs in 2024.
Renewable tech and storage OEMs
Collaborations with turbine, panel, battery, inverter, and EMS providers accelerate AES deployment by enabling integrated project delivery and standardized interfaces. Co-development secures performance guarantees and bundled lifecycle service contracts that improve asset availability. Access to next-gen tech lowers LCOE and boosts uptime through higher efficiency and predictive controls. Strategic sourcing reduces supply risk and capex via long-term OEM agreements.

Developers, EPCs, and financiers
Pipeline growth at AES hinges on co-development with local developers and reliable EPCs to secure sites and expedite permits, reducing cycle times by up to 20% in comparable projects. Project finance, US tax-equity (roughly $20–25 billion annually in 2023–24) and green bonds (global issuance ~ $300+ billion range) optimize capital structure and lower WACC. Syndicated lenders and multilaterals (IFC/ADB-scale financing) de-risk emerging market builds, improving bankability and cost certainty.

Large C&I offtakers and aggregators
Corporate buyers secure long-term PPAs (typically 10–20 years) to meet decarbonization targets, while aggregators bundle demand to scale projects and firm output, enabling dispatchable solutions and shaping ancillary services. Collaboration with large C&I offtakers and aggregators underpins bankability and revenue visibility, with many contracts delivering predictable cash flows used in project finance.
- Typical PPA tenor: 10–20 years
- Aggregated portfolios often exceed 100 MW
- Long-term contracts increase lender confidence and certainty of revenue
Policy makers and community stakeholders
Public-private partnerships accelerate permits and transmission upgrades, leveraging federal programs and private capital to shorten interconnection lead times for AES projects and support grid expansion; AES's global portfolio exceeded 42 GW capacity by 2024, increasing the need for coordinated upgrades.
Active engagement with community stakeholders secures social license, directs local benefits and workforce development, and cuts permitting delays and ESG risks; formal policymaker dialogue aligns incentives with national decarbonization roadmaps and market reforms.
- Permitting: public-private coordination reduces timeline risk
- Transmission: grid upgrades enable scale of 42 GW+ AES portfolio (2024)
- Community: local benefits preserve social license
- Policy: alignment with decarbonization incentives
Long-term PPAs, partners scale renewables to 42 GW and lower LCOE
AES leverages long-term PPAs (10–20y), OEMs, EPCs and T&D partners to de-risk projects, speed interconnection and lower LCOE; global portfolio reached 42 GW by 2024. Co-development, tax‑equity (≈$20–25B/yr 2023–24) and green bonds (global ~$300B+) improve bankability and shorten timelines.
| Metric | Value (2024) |
|---|---|
| Capacity | 42 GW |
| PPA tenor | 10–20 yrs |
| Tax‑equity | $20–25B/yr |
What is included in the product
 Detailed Word Document
A concise, investor-ready Business Model Canvas for AES detailing customer segments, channels, value propositions, revenue streams, cost structure and key activities; includes SWOT-linked insights and strategic recommendations for financing and operational planning.

 Customizable Excel Spreadsheet
One-page, editable Business Model Canvas that condenses AES’s strategy into a clean, boardroom-ready snapshot—save hours formatting and quickly align teams for decision-making and scenario testing.
Activities

Project development and permitting
Sourcing sites, managing an interconnection queue that exceeded 1,000 GW in the US as of 2024, and completing environmental studies are primary drivers of AESs project pipeline creation. Negotiating land deals, community benefits agreements, and securing permits cuts execution risk and shortens typical permitting delays of 12–18 months reported in 2024. Grid impact assessments increasingly dictate siting and technology choices, and timely approvals unlock staged capital deployment.
Construction and commissioning
Managing EPCs to deliver on time and on budget is core to AES, which operates roughly 34 GW of generation capacity (2024); rigorous quality assurance and HSE compliance protect long‑term performance and reputation; detailed testing verifies grid‑code adherence and warranty validation; successful commissioning marks commercial operation and triggers revenue recognition.

Operations, maintenance, and optimization
Remote monitoring, predictive maintenance, and spares management maximize availability; predictive maintenance can cut unplanned downtime by up to 50% and reduce maintenance costs 10–40% (McKinsey). Performance analytics improve capacity factors by a few percentage points and lower heat rates, boosting revenue per MWh. Asset life extension and repowering increase project IRR by hundreds of basis points; AES targets net-zero by 2040 with safety and compliance embedded in routines.

Energy trading and hedging
Energy trading and hedging balance merchant exposure with contracts to stabilize cash flows while AES’s ~35 GW global portfolio in 2024 enabled dispatch optimization to capture day-ahead/real-time spreads and ancillary market revenues; systematic hedging of fuel and power inputs/outputs reduces volatility and risk management frameworks enforce position and credit limits.
- Balance: contracts vs merchant exposure
- Optimization: capture price spreads, ancillary markets
- Hedging: inputs/outputs to mitigate volatility
- Controls: limits via risk management framework
Digital solutions and storage integration
Interconnection queues, permitting delays and $110/kWh batteries reshape 34–35 GW ops
Sourcing sites and managing an interconnection queue >1,000 GW (US, 2024) with permitting delays of 12–18 months drive project pipelines. Operating ~34–35 GW (2024) requires tight EPC oversight, QA/HSE and timely commissioning. Remote monitoring and predictive maintenance cut unplanned downtime up to 50%; VPPs grew ~35% and battery pack prices ≈ $110/kWh (2024), supporting trading and hedging.
| Activity | 2024 metric | Impact |
|---|---|---|
| Interconnection | >1,000 GW | Siting constraints |
| Capacity | 34–35 GW | Operational scale |
| Battery price | $110/kWh | Storage economics |
| VPP growth | ~35% | Flexibility |
| Permitting | 12–18 months | Schedule risk |
Full Document Unlocks After Purchase
Business Model Canvas
The AES Business Model Canvas you’re previewing is the actual deliverable, not a mockup or sample, and reflects the full structure and content you’ll receive after purchase. When you complete your order, you’ll download this exact file in editable Word and Excel formats. It’s ready to present, edit, and apply—no surprises.

Unlock the strategic playbook with a concise Business Model Canvas snapshot
Unlock AES’s strategic playbook with a concise Business Model Canvas that maps value propositions, customer segments, and revenue streams. This snapshot reveals how AES scales, partners, and manages costs to stay competitive. Purchase the full, editable Canvas (Word and Excel) for a section-by-section guide to replicate and adapt their success.
Partnerships
Utility and grid operators
AES partners with transmission and distribution operators to interconnect plants and stabilize grids, coordinating joint planning that in practice uses 10–20 year offtake and interconnection timelines to align investments and regulatory approvals.
These relationships enable grid modernization and smart integration of renewables, with AES and partners deploying utility-scale controls and storage that have supported curtailment reductions reported in industry cases of roughly 20–30%.
Long-term agreements and coordinated planning improve reliability and reduce congestion, enabling AES to optimize dispatch across fleets and meet expanding grid flexibility needs in 2024.
Renewable tech and storage OEMs
Collaborations with turbine, panel, battery, inverter, and EMS providers accelerate AES deployment by enabling integrated project delivery and standardized interfaces. Co-development secures performance guarantees and bundled lifecycle service contracts that improve asset availability. Access to next-gen tech lowers LCOE and boosts uptime through higher efficiency and predictive controls. Strategic sourcing reduces supply risk and capex via long-term OEM agreements.
Developers, EPCs, and financiers
Pipeline growth at AES hinges on co-development with local developers and reliable EPCs to secure sites and expedite permits, reducing cycle times by up to 20% in comparable projects. Project finance, US tax-equity (roughly $20–25 billion annually in 2023–24) and green bonds (global issuance ~ $300+ billion range) optimize capital structure and lower WACC. Syndicated lenders and multilaterals (IFC/ADB-scale financing) de-risk emerging market builds, improving bankability and cost certainty.
Large C&I offtakers and aggregators
Corporate buyers secure long-term PPAs (typically 10–20 years) to meet decarbonization targets, while aggregators bundle demand to scale projects and firm output, enabling dispatchable solutions and shaping ancillary services. Collaboration with large C&I offtakers and aggregators underpins bankability and revenue visibility, with many contracts delivering predictable cash flows used in project finance.
- Typical PPA tenor: 10–20 years
- Aggregated portfolios often exceed 100 MW
- Long-term contracts increase lender confidence and certainty of revenue
Policy makers and community stakeholders
Public-private partnerships accelerate permits and transmission upgrades, leveraging federal programs and private capital to shorten interconnection lead times for AES projects and support grid expansion; AES's global portfolio exceeded 42 GW capacity by 2024, increasing the need for coordinated upgrades.
Active engagement with community stakeholders secures social license, directs local benefits and workforce development, and cuts permitting delays and ESG risks; formal policymaker dialogue aligns incentives with national decarbonization roadmaps and market reforms.
- Permitting: public-private coordination reduces timeline risk
- Transmission: grid upgrades enable scale of 42 GW+ AES portfolio (2024)
- Community: local benefits preserve social license
- Policy: alignment with decarbonization incentives
Long-term PPAs, partners scale renewables to 42 GW and lower LCOE
AES leverages long-term PPAs (10–20y), OEMs, EPCs and T&D partners to de-risk projects, speed interconnection and lower LCOE; global portfolio reached 42 GW by 2024. Co-development, tax‑equity (≈$20–25B/yr 2023–24) and green bonds (global ~$300B+) improve bankability and shorten timelines.
| Metric | Value (2024) |
|---|---|
| Capacity | 42 GW |
| PPA tenor | 10–20 yrs |
| Tax‑equity | $20–25B/yr |
What is included in the product
Detailed Word Document
A concise, investor-ready Business Model Canvas for AES detailing customer segments, channels, value propositions, revenue streams, cost structure and key activities; includes SWOT-linked insights and strategic recommendations for financing and operational planning.
Customizable Excel Spreadsheet
One-page, editable Business Model Canvas that condenses AES’s strategy into a clean, boardroom-ready snapshot—save hours formatting and quickly align teams for decision-making and scenario testing.
Activities
Project development and permitting
Sourcing sites, managing an interconnection queue that exceeded 1,000 GW in the US as of 2024, and completing environmental studies are primary drivers of AESs project pipeline creation. Negotiating land deals, community benefits agreements, and securing permits cuts execution risk and shortens typical permitting delays of 12–18 months reported in 2024. Grid impact assessments increasingly dictate siting and technology choices, and timely approvals unlock staged capital deployment.
Construction and commissioning
Managing EPCs to deliver on time and on budget is core to AES, which operates roughly 34 GW of generation capacity (2024); rigorous quality assurance and HSE compliance protect long‑term performance and reputation; detailed testing verifies grid‑code adherence and warranty validation; successful commissioning marks commercial operation and triggers revenue recognition.
Operations, maintenance, and optimization
Remote monitoring, predictive maintenance, and spares management maximize availability; predictive maintenance can cut unplanned downtime by up to 50% and reduce maintenance costs 10–40% (McKinsey). Performance analytics improve capacity factors by a few percentage points and lower heat rates, boosting revenue per MWh. Asset life extension and repowering increase project IRR by hundreds of basis points; AES targets net-zero by 2040 with safety and compliance embedded in routines.
Energy trading and hedging
Energy trading and hedging balance merchant exposure with contracts to stabilize cash flows while AES’s ~35 GW global portfolio in 2024 enabled dispatch optimization to capture day-ahead/real-time spreads and ancillary market revenues; systematic hedging of fuel and power inputs/outputs reduces volatility and risk management frameworks enforce position and credit limits.
- Balance: contracts vs merchant exposure
- Optimization: capture price spreads, ancillary markets
- Hedging: inputs/outputs to mitigate volatility
- Controls: limits via risk management framework
Digital solutions and storage integration
Interconnection queues, permitting delays and $110/kWh batteries reshape 34–35 GW ops
Sourcing sites and managing an interconnection queue >1,000 GW (US, 2024) with permitting delays of 12–18 months drive project pipelines. Operating ~34–35 GW (2024) requires tight EPC oversight, QA/HSE and timely commissioning. Remote monitoring and predictive maintenance cut unplanned downtime up to 50%; VPPs grew ~35% and battery pack prices ≈ $110/kWh (2024), supporting trading and hedging.
| Activity | 2024 metric | Impact |
|---|---|---|
| Interconnection | >1,000 GW | Siting constraints |
| Capacity | 34–35 GW | Operational scale |
| Battery price | $110/kWh | Storage economics |
| VPP growth | ~35% | Flexibility |
| Permitting | 12–18 months | Schedule risk |
Full Document Unlocks After Purchase
Business Model Canvas
The AES Business Model Canvas you’re previewing is the actual deliverable, not a mockup or sample, and reflects the full structure and content you’ll receive after purchase. When you complete your order, you’ll download this exact file in editable Word and Excel formats. It’s ready to present, edit, and apply—no surprises.
Description
Unlock the strategic playbook with a concise Business Model Canvas snapshot
Unlock AES’s strategic playbook with a concise Business Model Canvas that maps value propositions, customer segments, and revenue streams. This snapshot reveals how AES scales, partners, and manages costs to stay competitive. Purchase the full, editable Canvas (Word and Excel) for a section-by-section guide to replicate and adapt their success.
Partnerships
Utility and grid operators
AES partners with transmission and distribution operators to interconnect plants and stabilize grids, coordinating joint planning that in practice uses 10–20 year offtake and interconnection timelines to align investments and regulatory approvals.
These relationships enable grid modernization and smart integration of renewables, with AES and partners deploying utility-scale controls and storage that have supported curtailment reductions reported in industry cases of roughly 20–30%.
Long-term agreements and coordinated planning improve reliability and reduce congestion, enabling AES to optimize dispatch across fleets and meet expanding grid flexibility needs in 2024.
Renewable tech and storage OEMs
Collaborations with turbine, panel, battery, inverter, and EMS providers accelerate AES deployment by enabling integrated project delivery and standardized interfaces. Co-development secures performance guarantees and bundled lifecycle service contracts that improve asset availability. Access to next-gen tech lowers LCOE and boosts uptime through higher efficiency and predictive controls. Strategic sourcing reduces supply risk and capex via long-term OEM agreements.
Developers, EPCs, and financiers
Pipeline growth at AES hinges on co-development with local developers and reliable EPCs to secure sites and expedite permits, reducing cycle times by up to 20% in comparable projects. Project finance, US tax-equity (roughly $20–25 billion annually in 2023–24) and green bonds (global issuance ~ $300+ billion range) optimize capital structure and lower WACC. Syndicated lenders and multilaterals (IFC/ADB-scale financing) de-risk emerging market builds, improving bankability and cost certainty.
Large C&I offtakers and aggregators
Corporate buyers secure long-term PPAs (typically 10–20 years) to meet decarbonization targets, while aggregators bundle demand to scale projects and firm output, enabling dispatchable solutions and shaping ancillary services. Collaboration with large C&I offtakers and aggregators underpins bankability and revenue visibility, with many contracts delivering predictable cash flows used in project finance.
- Typical PPA tenor: 10–20 years
- Aggregated portfolios often exceed 100 MW
- Long-term contracts increase lender confidence and certainty of revenue
Policy makers and community stakeholders
Public-private partnerships accelerate permits and transmission upgrades, leveraging federal programs and private capital to shorten interconnection lead times for AES projects and support grid expansion; AES's global portfolio exceeded 42 GW capacity by 2024, increasing the need for coordinated upgrades.
Active engagement with community stakeholders secures social license, directs local benefits and workforce development, and cuts permitting delays and ESG risks; formal policymaker dialogue aligns incentives with national decarbonization roadmaps and market reforms.
- Permitting: public-private coordination reduces timeline risk
- Transmission: grid upgrades enable scale of 42 GW+ AES portfolio (2024)
- Community: local benefits preserve social license
- Policy: alignment with decarbonization incentives
Long-term PPAs, partners scale renewables to 42 GW and lower LCOE
AES leverages long-term PPAs (10–20y), OEMs, EPCs and T&D partners to de-risk projects, speed interconnection and lower LCOE; global portfolio reached 42 GW by 2024. Co-development, tax‑equity (≈$20–25B/yr 2023–24) and green bonds (global ~$300B+) improve bankability and shorten timelines.
| Metric | Value (2024) |
|---|---|
| Capacity | 42 GW |
| PPA tenor | 10–20 yrs |
| Tax‑equity | $20–25B/yr |
What is included in the product
Detailed Word Document
A concise, investor-ready Business Model Canvas for AES detailing customer segments, channels, value propositions, revenue streams, cost structure and key activities; includes SWOT-linked insights and strategic recommendations for financing and operational planning.
Customizable Excel Spreadsheet
One-page, editable Business Model Canvas that condenses AES’s strategy into a clean, boardroom-ready snapshot—save hours formatting and quickly align teams for decision-making and scenario testing.
Activities
Project development and permitting
Sourcing sites, managing an interconnection queue that exceeded 1,000 GW in the US as of 2024, and completing environmental studies are primary drivers of AESs project pipeline creation. Negotiating land deals, community benefits agreements, and securing permits cuts execution risk and shortens typical permitting delays of 12–18 months reported in 2024. Grid impact assessments increasingly dictate siting and technology choices, and timely approvals unlock staged capital deployment.
Construction and commissioning
Managing EPCs to deliver on time and on budget is core to AES, which operates roughly 34 GW of generation capacity (2024); rigorous quality assurance and HSE compliance protect long‑term performance and reputation; detailed testing verifies grid‑code adherence and warranty validation; successful commissioning marks commercial operation and triggers revenue recognition.
Operations, maintenance, and optimization
Remote monitoring, predictive maintenance, and spares management maximize availability; predictive maintenance can cut unplanned downtime by up to 50% and reduce maintenance costs 10–40% (McKinsey). Performance analytics improve capacity factors by a few percentage points and lower heat rates, boosting revenue per MWh. Asset life extension and repowering increase project IRR by hundreds of basis points; AES targets net-zero by 2040 with safety and compliance embedded in routines.
Energy trading and hedging
Energy trading and hedging balance merchant exposure with contracts to stabilize cash flows while AES’s ~35 GW global portfolio in 2024 enabled dispatch optimization to capture day-ahead/real-time spreads and ancillary market revenues; systematic hedging of fuel and power inputs/outputs reduces volatility and risk management frameworks enforce position and credit limits.
- Balance: contracts vs merchant exposure
- Optimization: capture price spreads, ancillary markets
- Hedging: inputs/outputs to mitigate volatility
- Controls: limits via risk management framework
Digital solutions and storage integration
Interconnection queues, permitting delays and $110/kWh batteries reshape 34–35 GW ops
Sourcing sites and managing an interconnection queue >1,000 GW (US, 2024) with permitting delays of 12–18 months drive project pipelines. Operating ~34–35 GW (2024) requires tight EPC oversight, QA/HSE and timely commissioning. Remote monitoring and predictive maintenance cut unplanned downtime up to 50%; VPPs grew ~35% and battery pack prices ≈ $110/kWh (2024), supporting trading and hedging.
| Activity | 2024 metric | Impact |
|---|---|---|
| Interconnection | >1,000 GW | Siting constraints |
| Capacity | 34–35 GW | Operational scale |
| Battery price | $110/kWh | Storage economics |
| VPP growth | ~35% | Flexibility |
| Permitting | 12–18 months | Schedule risk |
Full Document Unlocks After Purchase
Business Model Canvas
The AES Business Model Canvas you’re previewing is the actual deliverable, not a mockup or sample, and reflects the full structure and content you’ll receive after purchase. When you complete your order, you’ll download this exact file in editable Word and Excel formats. It’s ready to present, edit, and apply—no surprises.











