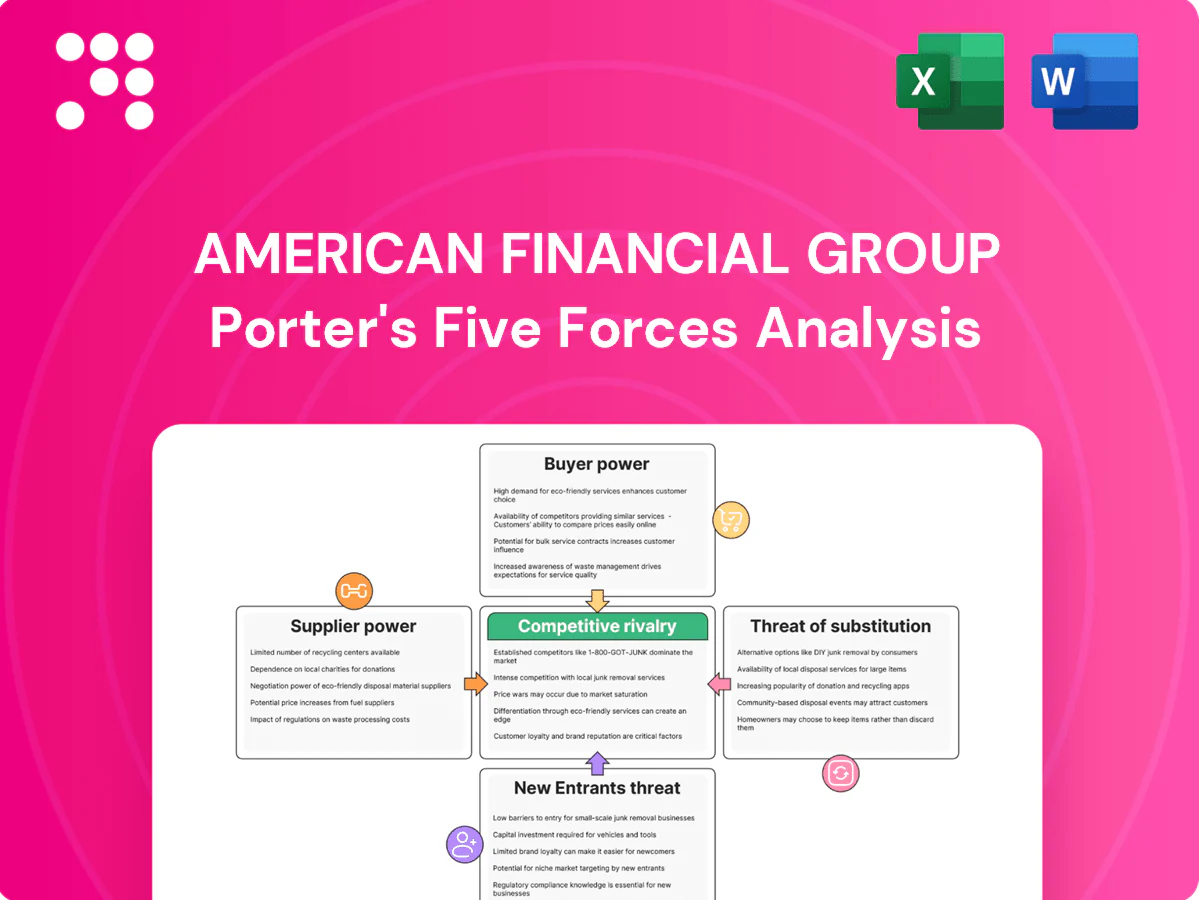
American Financial Group Porter's Five Forces Analysis

Don't Miss the Bigger Picture
American Financial Group faces moderate buyer power and regulatory pressure, while its scale and diversified portfolio mitigate supplier and entrant threats; competitive rivalry and substitutes remain key risks to margin stability. This brief snapshot only scratches the surface—unlock the full Porter’s Five Forces Analysis to access force-by-force ratings, visuals, and actionable strategic insights.
Suppliers Bargaining Power

Concentrated reinsurance market
AFG depends on a limited pool of top-rated reinsurers (Munich Re, Swiss Re, Hannover Re and peers), with the top five reinsurers supplying roughly 50% of global capacity, so market concentration can push up pricing and tighten terms in hard markets. This gives reinsurers leverage over coverage structure and collateral demands, especially for catastrophe layers. AFG mitigates through multi‑partner panels and prudent retentions to preserve capacity and control cost.
Specialized data and modeling vendors
Specialized vendors such as RMS, AIR and CoreLogic supply catastrophe models, cyber analytics and fraud tools, and industry reports in 2024 show the largest model providers account for the majority of market share, creating supplier concentration. Vendor switching is costly due to systems integration and model governance, with commercial contracts commonly spanning 3–7 years. This concentration can constrain AFG’s pricing granularity and portfolio risk management, though AFG’s growing internal analytics and long-term agreements reduce dependency.

Underwriting and actuarial talent
Experienced niche underwriters and actuaries remained scarce in 2024, with insurers reporting industry-wide hiring pressure and rising wage inflation and retention bonuses that increase the supplier power of talent.
Losing subject-matter experts can materially weaken risk selection and product development, raising loss-cost volatility and go-to-market delays.
AFG mitigates this by offering defined career paths, profit-sharing arrangements and centralized knowledge systems to retain and redeploy actuarial and underwriting expertise.

Claims and repair networks
Adjusters, TPAs and specialized repair providers materially influence loss severity and cycle time; 2024 industry data show surge events raised field labor fees by about 25–40%, extending cycle times and increasing indemnity costs and customer satisfaction risk for carriers like American Financial Group.
- Adjuster/TPA leverage: regional shortages drive up fees
- Surge events: 25–40% fee increases, longer turnaround
- Mitigation: preferred networks and SLAs reduce supplier power
IT platforms and core systems
Policy administration and digital distribution platforms are highly sticky once implemented, and customization plus compliance demands make migrations risky, allowing vendors to push pricing uplifts and extended upgrade timelines in 2024. AFG mitigates this supplier power by using modular architectures and multi-vendor sourcing to preserve flexibility and reduce lock-in.
- Vendor leverage: higher upgrade/pricing pressure in 2024
- Migration risk: customization and compliance increase cost/time
- AFG defense: modular design, multi-vendor sourcing
Reinsurer top-5 ~50%; adjuster fees 25–40% in 2024
Reinsurer concentration (top five ~50% global capacity) and model/vendor concentration (multi-year contracts) give suppliers pricing and terms leverage; surge event data show adjuster/repair fees up 25–40% in 2024. Talent scarcity raises wage/retention cost pressure. AFG uses panels, retentions, modular systems and retention programs to reduce dependency.
| Supplier | Power driver | 2024 metric | AFG mitigation |
|---|---|---|---|
| Reinsurers | Capacity concentration | Top5 ~50% global | Multi‑partner panels, higher retentions |
| Model vendors | Switching costs | 3–7yr contracts | Internal analytics, multi‑vendor |
| Adjusters/TPAs | Regional shortages | Fees +25–40% | Preferred networks, SLAs |
What is included in the product
 Detailed Word Document
Tailored Porter’s Five Forces analysis for American Financial Group, uncovering key drivers of competition, customer influence, and market entry risks affecting its insurance and specialty underwriting segments. Evaluates supplier/buyer power, substitutes, rivalry intensity, and barriers protecting incumbents to inform strategic and investor decisions.

 Customizable Excel Spreadsheet
Condensed Porter’s Five Forces snapshot for American Financial Group—one-sheet clarity that relieves analysis bottlenecks with customizable pressure levels and a ready-to-use radar chart for quick, slide-ready strategic decisions.
Customers Bargaining Power

Broker-driven negotiation leverage
Wholesale and retail brokers aggregate demand and pressure pricing and terms, often steering business to carriers with stronger commissions or appetite; brokers accounted for about 60% of commercial placements in 2024, elevating buyer power on large schedules. AFG reported roughly $5.6 billion of net premiums written in 2024 and offsets broker leverage through differentiated service, underwriting expertise and responsiveness to retain business and preserve margins.
Large commercial accounts
Large national accounts demand tailored coverages and loss-sensitive programs, using scale to drive RFPs and multi-carrier bidding that commonly compresses margins and lengthens negotiation cycles; industry practice sees margin erosion in the high-single to low-double digits. AFG defends pricing with strict underwriting discipline, selective appetite and deployment of value-added risk engineering services and loss control to preserve profitability and limit adverse selection.

Availability of alternatives
Clients can solicit quotes from hundreds of specialty carriers and managing general agents, making alternatives widely available.
Comparable policy forms in several niche lines reduce differentiation and, combined with easy online comparability, strengthen buyer bargaining power.
AFG in 2024 emphasized bespoke endorsements and claims excellence in its annual report to lower substitutability and defend pricing.

Price sensitivity in soft markets
In soft markets, capacity expansion drives buyer price sensitivity: clients push for lower rates and broader terms, and even long-standing accounts seek concessions, reinforcing cyclicality and buyer power. American Financial Group responds by tightening appetite and limits to protect underwriting discipline and the combined ratio, which management reported at 97.8% for 1H 2024.
- Buyer leverage: higher in soft markets
- Concessions: broadened terms even from loyal clients
- AFG action: tightened appetite/limits
- Key metric: 97.8% combined ratio (1H 2024)
Data transparency and benchmarking
Data transparency and loss benchmarking, driven by broker analytics, have made pricing significantly more contestable as buyers use loss data to challenge rates and retentions; greater transparency narrows information asymmetry and increases rate pressure. American Financial Group leverages proprietary loss insights and portfolio analytics to justify risk-adjusted pricing and defend retention levels. This dynamic raises customer bargaining power by enabling targeted rate negotiations and alternative sourcing.
Brokers control ~60% of placements; insurers tighten appetite as margins compress
Brokers drove ~60% of commercial placements in 2024, amplifying buyer leverage on pricing and terms; AFG wrote about $5.6B NPW in 2024 and offsets pressure via underwriting discipline, claims service and loss control. Large accounts and transparent broker analytics compress margins, especially in soft markets; AFG reported a 97.8% combined ratio in 1H 2024 and tightens appetite to defend pricing.
| Metric | 2024 |
|---|---|
| Broker share | ~60% |
| Net premiums written | $5.6B |
| Combined ratio (1H) | 97.8% |
Preview Before You Purchase
American Financial Group Porter's Five Forces Analysis
This preview is the exact Porter’s Five Forces analysis for American Financial Group you’ll receive—fully written, professionally formatted, and ready for immediate use. It covers competitive rivalry, supplier and buyer power, threat of substitutes, and barriers to entry with actionable insights. No placeholders or samples—purchase grants instant access to this identical file.

Don't Miss the Bigger Picture
American Financial Group faces moderate buyer power and regulatory pressure, while its scale and diversified portfolio mitigate supplier and entrant threats; competitive rivalry and substitutes remain key risks to margin stability. This brief snapshot only scratches the surface—unlock the full Porter’s Five Forces Analysis to access force-by-force ratings, visuals, and actionable strategic insights.
Suppliers Bargaining Power
Concentrated reinsurance market
AFG depends on a limited pool of top-rated reinsurers (Munich Re, Swiss Re, Hannover Re and peers), with the top five reinsurers supplying roughly 50% of global capacity, so market concentration can push up pricing and tighten terms in hard markets. This gives reinsurers leverage over coverage structure and collateral demands, especially for catastrophe layers. AFG mitigates through multi‑partner panels and prudent retentions to preserve capacity and control cost.
Specialized data and modeling vendors
Specialized vendors such as RMS, AIR and CoreLogic supply catastrophe models, cyber analytics and fraud tools, and industry reports in 2024 show the largest model providers account for the majority of market share, creating supplier concentration. Vendor switching is costly due to systems integration and model governance, with commercial contracts commonly spanning 3–7 years. This concentration can constrain AFG’s pricing granularity and portfolio risk management, though AFG’s growing internal analytics and long-term agreements reduce dependency.
Underwriting and actuarial talent
Experienced niche underwriters and actuaries remained scarce in 2024, with insurers reporting industry-wide hiring pressure and rising wage inflation and retention bonuses that increase the supplier power of talent.
Losing subject-matter experts can materially weaken risk selection and product development, raising loss-cost volatility and go-to-market delays.
AFG mitigates this by offering defined career paths, profit-sharing arrangements and centralized knowledge systems to retain and redeploy actuarial and underwriting expertise.
Claims and repair networks
Adjusters, TPAs and specialized repair providers materially influence loss severity and cycle time; 2024 industry data show surge events raised field labor fees by about 25–40%, extending cycle times and increasing indemnity costs and customer satisfaction risk for carriers like American Financial Group.
- Adjuster/TPA leverage: regional shortages drive up fees
- Surge events: 25–40% fee increases, longer turnaround
- Mitigation: preferred networks and SLAs reduce supplier power
IT platforms and core systems
Policy administration and digital distribution platforms are highly sticky once implemented, and customization plus compliance demands make migrations risky, allowing vendors to push pricing uplifts and extended upgrade timelines in 2024. AFG mitigates this supplier power by using modular architectures and multi-vendor sourcing to preserve flexibility and reduce lock-in.
- Vendor leverage: higher upgrade/pricing pressure in 2024
- Migration risk: customization and compliance increase cost/time
- AFG defense: modular design, multi-vendor sourcing
Reinsurer top-5 ~50%; adjuster fees 25–40% in 2024
Reinsurer concentration (top five ~50% global capacity) and model/vendor concentration (multi-year contracts) give suppliers pricing and terms leverage; surge event data show adjuster/repair fees up 25–40% in 2024. Talent scarcity raises wage/retention cost pressure. AFG uses panels, retentions, modular systems and retention programs to reduce dependency.
| Supplier | Power driver | 2024 metric | AFG mitigation |
|---|---|---|---|
| Reinsurers | Capacity concentration | Top5 ~50% global | Multi‑partner panels, higher retentions |
| Model vendors | Switching costs | 3–7yr contracts | Internal analytics, multi‑vendor |
| Adjusters/TPAs | Regional shortages | Fees +25–40% | Preferred networks, SLAs |
What is included in the product
Detailed Word Document
Tailored Porter’s Five Forces analysis for American Financial Group, uncovering key drivers of competition, customer influence, and market entry risks affecting its insurance and specialty underwriting segments. Evaluates supplier/buyer power, substitutes, rivalry intensity, and barriers protecting incumbents to inform strategic and investor decisions.
Customizable Excel Spreadsheet
Condensed Porter’s Five Forces snapshot for American Financial Group—one-sheet clarity that relieves analysis bottlenecks with customizable pressure levels and a ready-to-use radar chart for quick, slide-ready strategic decisions.
Customers Bargaining Power
Broker-driven negotiation leverage
Wholesale and retail brokers aggregate demand and pressure pricing and terms, often steering business to carriers with stronger commissions or appetite; brokers accounted for about 60% of commercial placements in 2024, elevating buyer power on large schedules. AFG reported roughly $5.6 billion of net premiums written in 2024 and offsets broker leverage through differentiated service, underwriting expertise and responsiveness to retain business and preserve margins.
Large commercial accounts
Large national accounts demand tailored coverages and loss-sensitive programs, using scale to drive RFPs and multi-carrier bidding that commonly compresses margins and lengthens negotiation cycles; industry practice sees margin erosion in the high-single to low-double digits. AFG defends pricing with strict underwriting discipline, selective appetite and deployment of value-added risk engineering services and loss control to preserve profitability and limit adverse selection.
Availability of alternatives
Clients can solicit quotes from hundreds of specialty carriers and managing general agents, making alternatives widely available.
Comparable policy forms in several niche lines reduce differentiation and, combined with easy online comparability, strengthen buyer bargaining power.
AFG in 2024 emphasized bespoke endorsements and claims excellence in its annual report to lower substitutability and defend pricing.
Price sensitivity in soft markets
In soft markets, capacity expansion drives buyer price sensitivity: clients push for lower rates and broader terms, and even long-standing accounts seek concessions, reinforcing cyclicality and buyer power. American Financial Group responds by tightening appetite and limits to protect underwriting discipline and the combined ratio, which management reported at 97.8% for 1H 2024.
- Buyer leverage: higher in soft markets
- Concessions: broadened terms even from loyal clients
- AFG action: tightened appetite/limits
- Key metric: 97.8% combined ratio (1H 2024)
Data transparency and benchmarking
Data transparency and loss benchmarking, driven by broker analytics, have made pricing significantly more contestable as buyers use loss data to challenge rates and retentions; greater transparency narrows information asymmetry and increases rate pressure. American Financial Group leverages proprietary loss insights and portfolio analytics to justify risk-adjusted pricing and defend retention levels. This dynamic raises customer bargaining power by enabling targeted rate negotiations and alternative sourcing.
Brokers control ~60% of placements; insurers tighten appetite as margins compress
Brokers drove ~60% of commercial placements in 2024, amplifying buyer leverage on pricing and terms; AFG wrote about $5.6B NPW in 2024 and offsets pressure via underwriting discipline, claims service and loss control. Large accounts and transparent broker analytics compress margins, especially in soft markets; AFG reported a 97.8% combined ratio in 1H 2024 and tightens appetite to defend pricing.
| Metric | 2024 |
|---|---|
| Broker share | ~60% |
| Net premiums written | $5.6B |
| Combined ratio (1H) | 97.8% |
Preview Before You Purchase
American Financial Group Porter's Five Forces Analysis
This preview is the exact Porter’s Five Forces analysis for American Financial Group you’ll receive—fully written, professionally formatted, and ready for immediate use. It covers competitive rivalry, supplier and buyer power, threat of substitutes, and barriers to entry with actionable insights. No placeholders or samples—purchase grants instant access to this identical file.
Original: $10.00
-65%$10.00
$3.50Description
Don't Miss the Bigger Picture
American Financial Group faces moderate buyer power and regulatory pressure, while its scale and diversified portfolio mitigate supplier and entrant threats; competitive rivalry and substitutes remain key risks to margin stability. This brief snapshot only scratches the surface—unlock the full Porter’s Five Forces Analysis to access force-by-force ratings, visuals, and actionable strategic insights.
Suppliers Bargaining Power
Concentrated reinsurance market
AFG depends on a limited pool of top-rated reinsurers (Munich Re, Swiss Re, Hannover Re and peers), with the top five reinsurers supplying roughly 50% of global capacity, so market concentration can push up pricing and tighten terms in hard markets. This gives reinsurers leverage over coverage structure and collateral demands, especially for catastrophe layers. AFG mitigates through multi‑partner panels and prudent retentions to preserve capacity and control cost.
Specialized data and modeling vendors
Specialized vendors such as RMS, AIR and CoreLogic supply catastrophe models, cyber analytics and fraud tools, and industry reports in 2024 show the largest model providers account for the majority of market share, creating supplier concentration. Vendor switching is costly due to systems integration and model governance, with commercial contracts commonly spanning 3–7 years. This concentration can constrain AFG’s pricing granularity and portfolio risk management, though AFG’s growing internal analytics and long-term agreements reduce dependency.
Underwriting and actuarial talent
Experienced niche underwriters and actuaries remained scarce in 2024, with insurers reporting industry-wide hiring pressure and rising wage inflation and retention bonuses that increase the supplier power of talent.
Losing subject-matter experts can materially weaken risk selection and product development, raising loss-cost volatility and go-to-market delays.
AFG mitigates this by offering defined career paths, profit-sharing arrangements and centralized knowledge systems to retain and redeploy actuarial and underwriting expertise.
Claims and repair networks
Adjusters, TPAs and specialized repair providers materially influence loss severity and cycle time; 2024 industry data show surge events raised field labor fees by about 25–40%, extending cycle times and increasing indemnity costs and customer satisfaction risk for carriers like American Financial Group.
- Adjuster/TPA leverage: regional shortages drive up fees
- Surge events: 25–40% fee increases, longer turnaround
- Mitigation: preferred networks and SLAs reduce supplier power
IT platforms and core systems
Policy administration and digital distribution platforms are highly sticky once implemented, and customization plus compliance demands make migrations risky, allowing vendors to push pricing uplifts and extended upgrade timelines in 2024. AFG mitigates this supplier power by using modular architectures and multi-vendor sourcing to preserve flexibility and reduce lock-in.
- Vendor leverage: higher upgrade/pricing pressure in 2024
- Migration risk: customization and compliance increase cost/time
- AFG defense: modular design, multi-vendor sourcing
Reinsurer top-5 ~50%; adjuster fees 25–40% in 2024
Reinsurer concentration (top five ~50% global capacity) and model/vendor concentration (multi-year contracts) give suppliers pricing and terms leverage; surge event data show adjuster/repair fees up 25–40% in 2024. Talent scarcity raises wage/retention cost pressure. AFG uses panels, retentions, modular systems and retention programs to reduce dependency.
| Supplier | Power driver | 2024 metric | AFG mitigation |
|---|---|---|---|
| Reinsurers | Capacity concentration | Top5 ~50% global | Multi‑partner panels, higher retentions |
| Model vendors | Switching costs | 3–7yr contracts | Internal analytics, multi‑vendor |
| Adjusters/TPAs | Regional shortages | Fees +25–40% | Preferred networks, SLAs |
What is included in the product
Detailed Word Document
Tailored Porter’s Five Forces analysis for American Financial Group, uncovering key drivers of competition, customer influence, and market entry risks affecting its insurance and specialty underwriting segments. Evaluates supplier/buyer power, substitutes, rivalry intensity, and barriers protecting incumbents to inform strategic and investor decisions.
Customizable Excel Spreadsheet
Condensed Porter’s Five Forces snapshot for American Financial Group—one-sheet clarity that relieves analysis bottlenecks with customizable pressure levels and a ready-to-use radar chart for quick, slide-ready strategic decisions.
Customers Bargaining Power
Broker-driven negotiation leverage
Wholesale and retail brokers aggregate demand and pressure pricing and terms, often steering business to carriers with stronger commissions or appetite; brokers accounted for about 60% of commercial placements in 2024, elevating buyer power on large schedules. AFG reported roughly $5.6 billion of net premiums written in 2024 and offsets broker leverage through differentiated service, underwriting expertise and responsiveness to retain business and preserve margins.
Large commercial accounts
Large national accounts demand tailored coverages and loss-sensitive programs, using scale to drive RFPs and multi-carrier bidding that commonly compresses margins and lengthens negotiation cycles; industry practice sees margin erosion in the high-single to low-double digits. AFG defends pricing with strict underwriting discipline, selective appetite and deployment of value-added risk engineering services and loss control to preserve profitability and limit adverse selection.
Availability of alternatives
Clients can solicit quotes from hundreds of specialty carriers and managing general agents, making alternatives widely available.
Comparable policy forms in several niche lines reduce differentiation and, combined with easy online comparability, strengthen buyer bargaining power.
AFG in 2024 emphasized bespoke endorsements and claims excellence in its annual report to lower substitutability and defend pricing.
Price sensitivity in soft markets
In soft markets, capacity expansion drives buyer price sensitivity: clients push for lower rates and broader terms, and even long-standing accounts seek concessions, reinforcing cyclicality and buyer power. American Financial Group responds by tightening appetite and limits to protect underwriting discipline and the combined ratio, which management reported at 97.8% for 1H 2024.
- Buyer leverage: higher in soft markets
- Concessions: broadened terms even from loyal clients
- AFG action: tightened appetite/limits
- Key metric: 97.8% combined ratio (1H 2024)
Data transparency and benchmarking
Data transparency and loss benchmarking, driven by broker analytics, have made pricing significantly more contestable as buyers use loss data to challenge rates and retentions; greater transparency narrows information asymmetry and increases rate pressure. American Financial Group leverages proprietary loss insights and portfolio analytics to justify risk-adjusted pricing and defend retention levels. This dynamic raises customer bargaining power by enabling targeted rate negotiations and alternative sourcing.
Brokers control ~60% of placements; insurers tighten appetite as margins compress
Brokers drove ~60% of commercial placements in 2024, amplifying buyer leverage on pricing and terms; AFG wrote about $5.6B NPW in 2024 and offsets pressure via underwriting discipline, claims service and loss control. Large accounts and transparent broker analytics compress margins, especially in soft markets; AFG reported a 97.8% combined ratio in 1H 2024 and tightens appetite to defend pricing.
| Metric | 2024 |
|---|---|
| Broker share | ~60% |
| Net premiums written | $5.6B |
| Combined ratio (1H) | 97.8% |
Preview Before You Purchase
American Financial Group Porter's Five Forces Analysis
This preview is the exact Porter’s Five Forces analysis for American Financial Group you’ll receive—fully written, professionally formatted, and ready for immediate use. It covers competitive rivalry, supplier and buyer power, threat of substitutes, and barriers to entry with actionable insights. No placeholders or samples—purchase grants instant access to this identical file.











