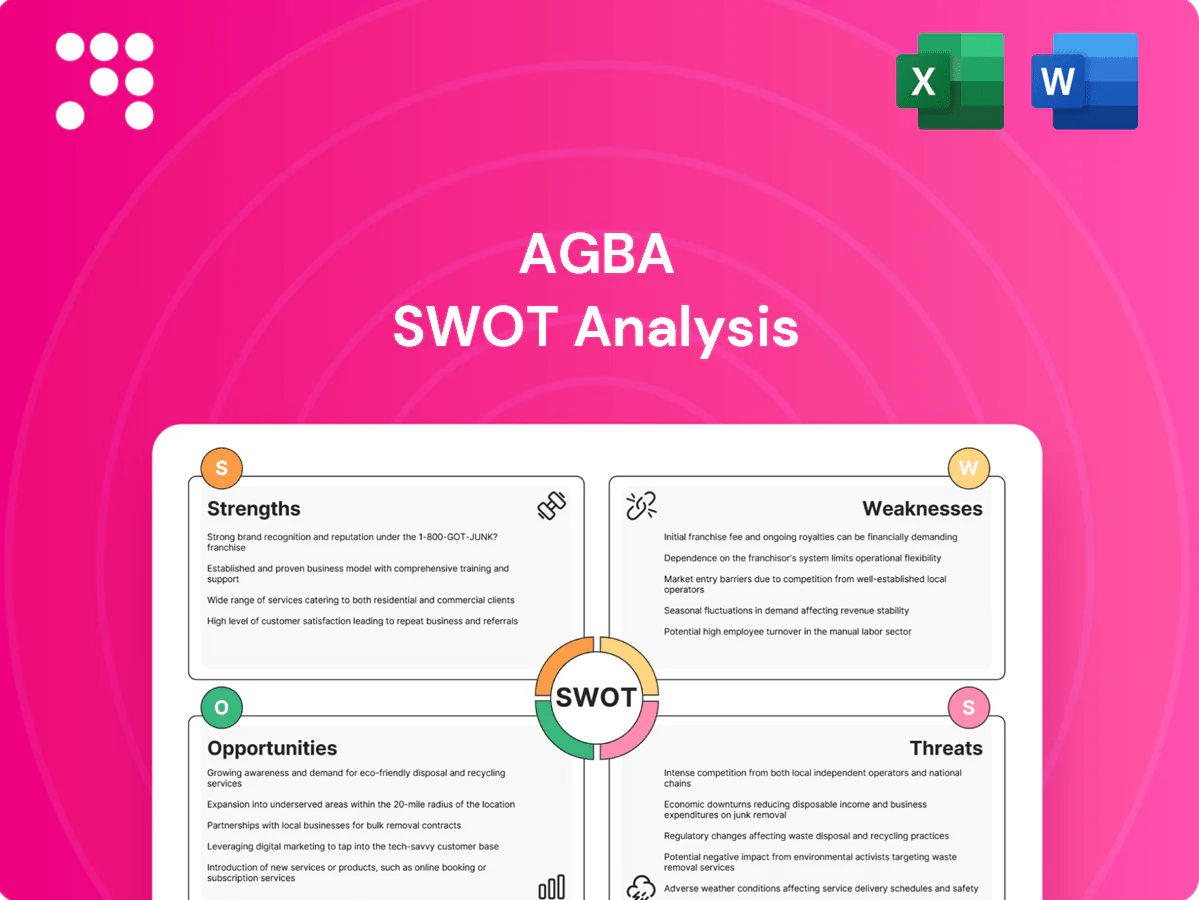
AGBA SWOT Analysis

Go Beyond the Preview—Access the Full Strategic Report
AGBA’s SWOT snapshot highlights solid niche positioning, diversified product lines, and regulatory exposure that could reshape near‑term growth; key risks and strategic opportunities deserve deeper analysis. Purchase the full SWOT analysis to access a research‑backed, investor‑ready Word report plus an editable Excel matrix—perfect for strategy, pitches, and investment decisions.
Strengths

One-stop financial supermarket
AGBA’s one-stop financial supermarket bundles wealth, healthcare and fintech to simplify client journeys and boost wallet share, enabling advisory, protection, investment and health services in a single platform. This integration improves retention and cuts acquisition costs, with cross-domain data enabling richer personalization and better product fit. McKinsey-type studies show integrated cross-sell can raise wallet share by up to 30%.
Diversified revenue streams
Multiple business lines reduce AGBA’s reliance on any single economic cycle; fee-based wealth management, insurance distribution, healthcare services and fintech subscriptions collectively smooth earnings. This diversification helps stabilize cash flow through market volatility and supports flexible capital allocation toward higher-return segments.

Strong Hong Kong footprint
Operating in Hong Kong gives AGBA direct access to deep capital markets and affluent client pools in Asia’s leading exchange ecosystem. Established licensing and regulatory familiarity under SFC regimes fosters trust and compliance. Proximity to the Greater Bay Area (≈86 million people, GDP >US$1.6tn in 2022) expands cross‑border deal flow and credibility via rigorous market standards.

Tech-enabled advisory and distribution
Tech-enabled advisory streamlines onboarding, KYC and product matching to compress conversion timelines and reduce manual errors, supporting faster client acquisition and scalability observed across digital-first firms in 2024.
Advanced analytics enhance segmentation and targeted upsell, while platform scalability boosts advisor productivity and customer self-service, driving lower unit costs as volumes expand.
- Digital onboarding: faster conversion
- Data analytics: sharper segmentation
- Scalability: higher advisor productivity
- Volume leverage: lower unit costs
Cross-selling and ecosystem synergies
Healthcare insights inform protection and wealth planning, enabling personalized offers that raise customer lifetime value; industry studies (2023–24) indicate bundled financial-health propositions can lower churn by roughly 10–20% and lift CLV materially. Partnerships with insurers, asset managers and providers expand shelf breadth, while network effects deepen AGBA’s competitive moat over time.
- Insight-driven cross-sell
- Bundled offers: -10–20% churn
- Partnerships + network effects
One-stop financial supermarket boosts wallet share up to 30% and lowers churn
AGBA’s one-stop financial supermarket drives cross-sell (wallet share uplift up to 30%), reduces acquisition cost and boosts retention (bundles lower churn 10–20%). Diversified fees across wealth, insurance, healthcare and fintech smooth earnings and enable capital rotation to higher-return segments. HK/GBA footprint (≈86M people, GDP >US$1.6tn) grants deep capital access and affluent client pools.
| Metric | Value |
|---|---|
| Wallet share uplift | up to 30% |
| Churn reduction | 10–20% |
| GBA population / GDP | ≈86M / >US$1.6tn (2022) |
What is included in the product
 Detailed Word Document
Delivers a strategic overview of AGBA’s internal and external business factors, outlining strengths, weaknesses, opportunities, and threats to map its competitive position, identify key growth drivers and operational gaps, and highlight market risks shaping the company’s future.

 Customizable Excel Spreadsheet
Provides a concise AGBA SWOT matrix for fast, visual strategy alignment and quick stakeholder briefings, with an editable layout for rapid updates to reflect shifting priorities.
Weaknesses

Geographic concentration risk
AGBA’s heavy exposure to Hong Kong concentrates regulatory, macro and competitive risk in a single jurisdiction, raising vulnerability to local rate, property and policy swings. Limited international diversification can amplify shocks from regional downturns. Cross-border expansion will require multiple foreign licences and new operational capabilities, likely slowing scale-up relative to globally diversified peers.
Scale versus incumbents
Large banks and insurers control multi‑trillion dollar balance sheets—JPMorgan Chase ~$4.1tn in assets (2024) and Allianz ~€1.3tn—giving them far greater marketing reach and capital flexibility than AGBA. Negotiating leverage on product economics can be weaker for smaller players, compressing margins. Brand recognition often lags universal banks, raising customer acquisition costs that industry studies put above $200–$300 per retail customer (2023), pressuring pricing.

Advisor network dependence
Performance hinges on recruiting, training and retaining productive advisors and partners, with industry attrition often exceeding 10% annually and 30–50% of new advisors leaving within 3 years. High turnover disrupts sales momentum and client service; replacing a producer can cost firms $10,000–$30,000 in onboarding and lost revenue. Misaligned incentives raise compliance and reputational risk, requiring ongoing enablement investment.

Profitability sensitivity to markets
Wealth fees and insurance sales at AGBA are highly cyclical, tracking market sentiment and net flows; global AUM movements (PwC: global AWM AUM ~116 trillion in 2023) show sensitivity to downturns. AUM declines compress fee revenue while fixed operating costs persist, squeezing margins and cash flow. Product mix shifts toward lower-fee solutions and higher insurance mix can dilute unit economics and complicate forecasting and capital planning.
- Market-linked fees
- Fixed-cost leverage risk
- Margin dilution from product mix
- Complex forecasting & capital needs
Operational complexity across verticals
Integrating wealth, healthcare, and fintech heightens process and governance complexity, with data interoperability and privacy controls critical to avoid breaches; IBM's 2024 Cost of a Data Breach Report puts the global average at $4.45M and healthcare at $10.93M. Multiple regimes like GDPR and HIPAA raise compliance overhead and execution missteps can quickly erode customer experience.
- Cross-vertical controls: high
- Avg breach cost: $4.45M (2024)
- Healthcare breach cost: $10.93M (2024)
- Regulatory overlap: GDPR vs HIPAA
Hong Kong concentration raises regulatory, rate and property risks; costly advisor churn
AGBA’s Hong Kong concentration raises regulatory, rate and property risk; limited international diversification slows shock absorption and licenseed expansion. Competing against JPMorgan ~$4.1tn (2024) and Allianz €1.3tn compresses margins and raises CAC (~$200–$300). Advisor attrition >10%/yr and 30–50% early turnover inflates replacement ($10k–$30k). Data breaches costly: global $4.45M, healthcare $10.93M (2024).
| Metric | Value |
|---|---|
| JPMorgan assets (2024) | $4.1tn |
| Allianz assets | €1.3tn |
| Global AWM AUM (2023) | $116tn |
| Advisor attrition | >10%/yr |
| Early advisor turnover | 30–50% |
| Onboard cost | $10k–$30k |
| Customer acquisition | $200–$300 |
| Avg breach cost (2024) | $4.45M |
| Healthcare breach (2024) | $10.93M |
Preview the Actual Deliverable
AGBA SWOT Analysis
This is the actual SWOT analysis document you’ll receive upon purchase—no surprises, just professional quality. The preview below is taken directly from the full report and reflects the complete structure and findings. Buy to download the full, editable AGBA SWOT file immediately.

Go Beyond the Preview—Access the Full Strategic Report
AGBA’s SWOT snapshot highlights solid niche positioning, diversified product lines, and regulatory exposure that could reshape near‑term growth; key risks and strategic opportunities deserve deeper analysis. Purchase the full SWOT analysis to access a research‑backed, investor‑ready Word report plus an editable Excel matrix—perfect for strategy, pitches, and investment decisions.
Strengths
One-stop financial supermarket
AGBA’s one-stop financial supermarket bundles wealth, healthcare and fintech to simplify client journeys and boost wallet share, enabling advisory, protection, investment and health services in a single platform. This integration improves retention and cuts acquisition costs, with cross-domain data enabling richer personalization and better product fit. McKinsey-type studies show integrated cross-sell can raise wallet share by up to 30%.
Diversified revenue streams
Multiple business lines reduce AGBA’s reliance on any single economic cycle; fee-based wealth management, insurance distribution, healthcare services and fintech subscriptions collectively smooth earnings. This diversification helps stabilize cash flow through market volatility and supports flexible capital allocation toward higher-return segments.
Strong Hong Kong footprint
Operating in Hong Kong gives AGBA direct access to deep capital markets and affluent client pools in Asia’s leading exchange ecosystem. Established licensing and regulatory familiarity under SFC regimes fosters trust and compliance. Proximity to the Greater Bay Area (≈86 million people, GDP >US$1.6tn in 2022) expands cross‑border deal flow and credibility via rigorous market standards.
Tech-enabled advisory and distribution
Tech-enabled advisory streamlines onboarding, KYC and product matching to compress conversion timelines and reduce manual errors, supporting faster client acquisition and scalability observed across digital-first firms in 2024.
Advanced analytics enhance segmentation and targeted upsell, while platform scalability boosts advisor productivity and customer self-service, driving lower unit costs as volumes expand.
- Digital onboarding: faster conversion
- Data analytics: sharper segmentation
- Scalability: higher advisor productivity
- Volume leverage: lower unit costs
Cross-selling and ecosystem synergies
Healthcare insights inform protection and wealth planning, enabling personalized offers that raise customer lifetime value; industry studies (2023–24) indicate bundled financial-health propositions can lower churn by roughly 10–20% and lift CLV materially. Partnerships with insurers, asset managers and providers expand shelf breadth, while network effects deepen AGBA’s competitive moat over time.
- Insight-driven cross-sell
- Bundled offers: -10–20% churn
- Partnerships + network effects
One-stop financial supermarket boosts wallet share up to 30% and lowers churn
AGBA’s one-stop financial supermarket drives cross-sell (wallet share uplift up to 30%), reduces acquisition cost and boosts retention (bundles lower churn 10–20%). Diversified fees across wealth, insurance, healthcare and fintech smooth earnings and enable capital rotation to higher-return segments. HK/GBA footprint (≈86M people, GDP >US$1.6tn) grants deep capital access and affluent client pools.
| Metric | Value |
|---|---|
| Wallet share uplift | up to 30% |
| Churn reduction | 10–20% |
| GBA population / GDP | ≈86M / >US$1.6tn (2022) |
What is included in the product
Detailed Word Document
Delivers a strategic overview of AGBA’s internal and external business factors, outlining strengths, weaknesses, opportunities, and threats to map its competitive position, identify key growth drivers and operational gaps, and highlight market risks shaping the company’s future.
Customizable Excel Spreadsheet
Provides a concise AGBA SWOT matrix for fast, visual strategy alignment and quick stakeholder briefings, with an editable layout for rapid updates to reflect shifting priorities.
Weaknesses
Geographic concentration risk
AGBA’s heavy exposure to Hong Kong concentrates regulatory, macro and competitive risk in a single jurisdiction, raising vulnerability to local rate, property and policy swings. Limited international diversification can amplify shocks from regional downturns. Cross-border expansion will require multiple foreign licences and new operational capabilities, likely slowing scale-up relative to globally diversified peers.
Scale versus incumbents
Large banks and insurers control multi‑trillion dollar balance sheets—JPMorgan Chase ~$4.1tn in assets (2024) and Allianz ~€1.3tn—giving them far greater marketing reach and capital flexibility than AGBA. Negotiating leverage on product economics can be weaker for smaller players, compressing margins. Brand recognition often lags universal banks, raising customer acquisition costs that industry studies put above $200–$300 per retail customer (2023), pressuring pricing.
Advisor network dependence
Performance hinges on recruiting, training and retaining productive advisors and partners, with industry attrition often exceeding 10% annually and 30–50% of new advisors leaving within 3 years. High turnover disrupts sales momentum and client service; replacing a producer can cost firms $10,000–$30,000 in onboarding and lost revenue. Misaligned incentives raise compliance and reputational risk, requiring ongoing enablement investment.
Profitability sensitivity to markets
Wealth fees and insurance sales at AGBA are highly cyclical, tracking market sentiment and net flows; global AUM movements (PwC: global AWM AUM ~116 trillion in 2023) show sensitivity to downturns. AUM declines compress fee revenue while fixed operating costs persist, squeezing margins and cash flow. Product mix shifts toward lower-fee solutions and higher insurance mix can dilute unit economics and complicate forecasting and capital planning.
- Market-linked fees
- Fixed-cost leverage risk
- Margin dilution from product mix
- Complex forecasting & capital needs
Operational complexity across verticals
Integrating wealth, healthcare, and fintech heightens process and governance complexity, with data interoperability and privacy controls critical to avoid breaches; IBM's 2024 Cost of a Data Breach Report puts the global average at $4.45M and healthcare at $10.93M. Multiple regimes like GDPR and HIPAA raise compliance overhead and execution missteps can quickly erode customer experience.
- Cross-vertical controls: high
- Avg breach cost: $4.45M (2024)
- Healthcare breach cost: $10.93M (2024)
- Regulatory overlap: GDPR vs HIPAA
Hong Kong concentration raises regulatory, rate and property risks; costly advisor churn
AGBA’s Hong Kong concentration raises regulatory, rate and property risk; limited international diversification slows shock absorption and licenseed expansion. Competing against JPMorgan ~$4.1tn (2024) and Allianz €1.3tn compresses margins and raises CAC (~$200–$300). Advisor attrition >10%/yr and 30–50% early turnover inflates replacement ($10k–$30k). Data breaches costly: global $4.45M, healthcare $10.93M (2024).
| Metric | Value |
|---|---|
| JPMorgan assets (2024) | $4.1tn |
| Allianz assets | €1.3tn |
| Global AWM AUM (2023) | $116tn |
| Advisor attrition | >10%/yr |
| Early advisor turnover | 30–50% |
| Onboard cost | $10k–$30k |
| Customer acquisition | $200–$300 |
| Avg breach cost (2024) | $4.45M |
| Healthcare breach (2024) | $10.93M |
Preview the Actual Deliverable
AGBA SWOT Analysis
This is the actual SWOT analysis document you’ll receive upon purchase—no surprises, just professional quality. The preview below is taken directly from the full report and reflects the complete structure and findings. Buy to download the full, editable AGBA SWOT file immediately.
Original: $10.00
-65%$10.00
$3.50Description
Go Beyond the Preview—Access the Full Strategic Report
AGBA’s SWOT snapshot highlights solid niche positioning, diversified product lines, and regulatory exposure that could reshape near‑term growth; key risks and strategic opportunities deserve deeper analysis. Purchase the full SWOT analysis to access a research‑backed, investor‑ready Word report plus an editable Excel matrix—perfect for strategy, pitches, and investment decisions.
Strengths
One-stop financial supermarket
AGBA’s one-stop financial supermarket bundles wealth, healthcare and fintech to simplify client journeys and boost wallet share, enabling advisory, protection, investment and health services in a single platform. This integration improves retention and cuts acquisition costs, with cross-domain data enabling richer personalization and better product fit. McKinsey-type studies show integrated cross-sell can raise wallet share by up to 30%.
Diversified revenue streams
Multiple business lines reduce AGBA’s reliance on any single economic cycle; fee-based wealth management, insurance distribution, healthcare services and fintech subscriptions collectively smooth earnings. This diversification helps stabilize cash flow through market volatility and supports flexible capital allocation toward higher-return segments.
Strong Hong Kong footprint
Operating in Hong Kong gives AGBA direct access to deep capital markets and affluent client pools in Asia’s leading exchange ecosystem. Established licensing and regulatory familiarity under SFC regimes fosters trust and compliance. Proximity to the Greater Bay Area (≈86 million people, GDP >US$1.6tn in 2022) expands cross‑border deal flow and credibility via rigorous market standards.
Tech-enabled advisory and distribution
Tech-enabled advisory streamlines onboarding, KYC and product matching to compress conversion timelines and reduce manual errors, supporting faster client acquisition and scalability observed across digital-first firms in 2024.
Advanced analytics enhance segmentation and targeted upsell, while platform scalability boosts advisor productivity and customer self-service, driving lower unit costs as volumes expand.
- Digital onboarding: faster conversion
- Data analytics: sharper segmentation
- Scalability: higher advisor productivity
- Volume leverage: lower unit costs
Cross-selling and ecosystem synergies
Healthcare insights inform protection and wealth planning, enabling personalized offers that raise customer lifetime value; industry studies (2023–24) indicate bundled financial-health propositions can lower churn by roughly 10–20% and lift CLV materially. Partnerships with insurers, asset managers and providers expand shelf breadth, while network effects deepen AGBA’s competitive moat over time.
- Insight-driven cross-sell
- Bundled offers: -10–20% churn
- Partnerships + network effects
One-stop financial supermarket boosts wallet share up to 30% and lowers churn
AGBA’s one-stop financial supermarket drives cross-sell (wallet share uplift up to 30%), reduces acquisition cost and boosts retention (bundles lower churn 10–20%). Diversified fees across wealth, insurance, healthcare and fintech smooth earnings and enable capital rotation to higher-return segments. HK/GBA footprint (≈86M people, GDP >US$1.6tn) grants deep capital access and affluent client pools.
| Metric | Value |
|---|---|
| Wallet share uplift | up to 30% |
| Churn reduction | 10–20% |
| GBA population / GDP | ≈86M / >US$1.6tn (2022) |
What is included in the product
Detailed Word Document
Delivers a strategic overview of AGBA’s internal and external business factors, outlining strengths, weaknesses, opportunities, and threats to map its competitive position, identify key growth drivers and operational gaps, and highlight market risks shaping the company’s future.
Customizable Excel Spreadsheet
Provides a concise AGBA SWOT matrix for fast, visual strategy alignment and quick stakeholder briefings, with an editable layout for rapid updates to reflect shifting priorities.
Weaknesses
Geographic concentration risk
AGBA’s heavy exposure to Hong Kong concentrates regulatory, macro and competitive risk in a single jurisdiction, raising vulnerability to local rate, property and policy swings. Limited international diversification can amplify shocks from regional downturns. Cross-border expansion will require multiple foreign licences and new operational capabilities, likely slowing scale-up relative to globally diversified peers.
Scale versus incumbents
Large banks and insurers control multi‑trillion dollar balance sheets—JPMorgan Chase ~$4.1tn in assets (2024) and Allianz ~€1.3tn—giving them far greater marketing reach and capital flexibility than AGBA. Negotiating leverage on product economics can be weaker for smaller players, compressing margins. Brand recognition often lags universal banks, raising customer acquisition costs that industry studies put above $200–$300 per retail customer (2023), pressuring pricing.
Advisor network dependence
Performance hinges on recruiting, training and retaining productive advisors and partners, with industry attrition often exceeding 10% annually and 30–50% of new advisors leaving within 3 years. High turnover disrupts sales momentum and client service; replacing a producer can cost firms $10,000–$30,000 in onboarding and lost revenue. Misaligned incentives raise compliance and reputational risk, requiring ongoing enablement investment.
Profitability sensitivity to markets
Wealth fees and insurance sales at AGBA are highly cyclical, tracking market sentiment and net flows; global AUM movements (PwC: global AWM AUM ~116 trillion in 2023) show sensitivity to downturns. AUM declines compress fee revenue while fixed operating costs persist, squeezing margins and cash flow. Product mix shifts toward lower-fee solutions and higher insurance mix can dilute unit economics and complicate forecasting and capital planning.
- Market-linked fees
- Fixed-cost leverage risk
- Margin dilution from product mix
- Complex forecasting & capital needs
Operational complexity across verticals
Integrating wealth, healthcare, and fintech heightens process and governance complexity, with data interoperability and privacy controls critical to avoid breaches; IBM's 2024 Cost of a Data Breach Report puts the global average at $4.45M and healthcare at $10.93M. Multiple regimes like GDPR and HIPAA raise compliance overhead and execution missteps can quickly erode customer experience.
- Cross-vertical controls: high
- Avg breach cost: $4.45M (2024)
- Healthcare breach cost: $10.93M (2024)
- Regulatory overlap: GDPR vs HIPAA
Hong Kong concentration raises regulatory, rate and property risks; costly advisor churn
AGBA’s Hong Kong concentration raises regulatory, rate and property risk; limited international diversification slows shock absorption and licenseed expansion. Competing against JPMorgan ~$4.1tn (2024) and Allianz €1.3tn compresses margins and raises CAC (~$200–$300). Advisor attrition >10%/yr and 30–50% early turnover inflates replacement ($10k–$30k). Data breaches costly: global $4.45M, healthcare $10.93M (2024).
| Metric | Value |
|---|---|
| JPMorgan assets (2024) | $4.1tn |
| Allianz assets | €1.3tn |
| Global AWM AUM (2023) | $116tn |
| Advisor attrition | >10%/yr |
| Early advisor turnover | 30–50% |
| Onboard cost | $10k–$30k |
| Customer acquisition | $200–$300 |
| Avg breach cost (2024) | $4.45M |
| Healthcare breach (2024) | $10.93M |
Preview the Actual Deliverable
AGBA SWOT Analysis
This is the actual SWOT analysis document you’ll receive upon purchase—no surprises, just professional quality. The preview below is taken directly from the full report and reflects the complete structure and findings. Buy to download the full, editable AGBA SWOT file immediately.











