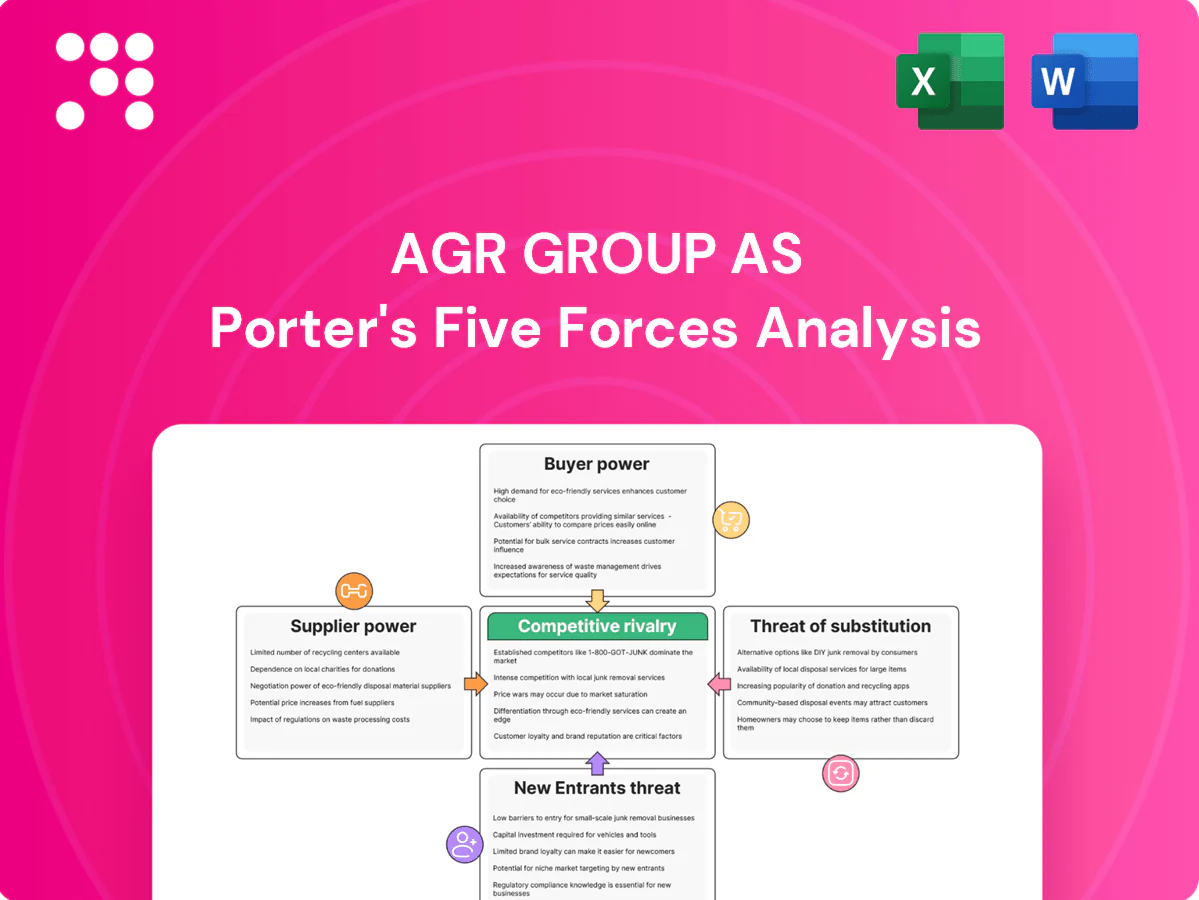
AGR Group AS Porter's Five Forces Analysis

Elevate Your Analysis with the Complete Porter's Five Forces Analysis
AGR Group AS faces moderate supplier leverage, concentrated buyers in select markets, and persistent rivalry from regional players. New entrant risk is muted by regulatory and capital barriers, while substitutes present niche threats. This snapshot only scratches the surface—unlock the full Porter's Five Forces Analysis for force-by-force ratings, visuals, and strategic implications.
Suppliers Bargaining Power

Consolidated critical tool and rig suppliers
Core inputs—rigs, BOPs, OCTG and drilling fluids—are concentrated among vendors such as Schlumberger, Halliburton and NOV, giving suppliers leverage in tight markets; global offshore rig utilization climbed above 80% in 2024, pressuring availability. Dayrates and tool rentals can spike, compressing turnkey margins. AGR reduces risk via multi‑sourcing and detailed planning, but supplier dependency and contract timing versus cycle remain material.
Specialized talent and certification dependence
Experienced drilling engineers, well managers and HSE-certified specialists are scarce, giving labor suppliers notable bargaining power and driving double-digit wage inflation in 2023–24 for oilfield services. Retention bonuses and higher dayrates have increased delivery costs during upcycles, while long training cycles (commonly 12–24 months) and strict compliance limit rapid substitution. AGR’s internal talent pipelines and global mobility programs partially offset these pressures by shortening vacancy times and reducing external hiring premiums.

Switching costs on proprietary software and data
Integration of AGR’s proprietary software with well design/planning systems and historical well data creates switching friction for operators, reinforcing supplier price power over niche subsurface models, real-time streams and cloud services. Vendors leveraging proprietary data APIs can impose premiums; global cloud spending exceeded $500 billion in 2024, strengthening vendor leverage. AGR’s in‑house tools reduce dependency but still require third‑party interfaces. Improved data portability and open standards such as WITSML accelerate reduced lock‑in over time.

Input price volatility and logistics risk
Input-price volatility drives supplier power for AGR Group as steel (HRC ≈ 600 USD/ton in 2024) and energy (Brent ≈ 86 USD/bbl in 2024) feed through to consumables and service costs; geopolitical and shipping disruptions push lead times and force premium expediting, raising margins. Contract pass-through clauses and fixed-price vs index-linked agreements determine how effectively cost spikes are transferred. Inventory buffers and hedging reduced but did not remove 2024 shocks.
- Steel: HRC ≈ 600 USD/ton (2024)
- Energy: Brent ≈ 86 USD/bbl (2024)
- Logistics: disruption-driven expediting increases OPEX
- Mitigants: contracts, inventory, hedging—partial dampeners
Regulatory and certification gatekeepers
Compliance bodies and inspection agencies function as quasi-suppliers for approvals, with tightened standards in 2024 increasing cost and schedule risk for project owners through longer approval cycles and additional testing requirements.
Maintaining impeccable documentation and pre-qualifications reduces exposure, and AGR Group ASs long-standing track record strengthens negotiation with auditors and insurers, lowering underwriting scrutiny and contingency loads.
- Compliance approvals = critical gate
- Delays raise schedule/cost risk
- Impeccable docs cut exposure
- Track record improves audit/insurer leverage
Supplier power, labor scarcity and input shocks squeeze oilfield-services margins
AGR faces strong supplier power from concentrated rig/OCTG/tool vendors and scarce skilled labor, with global offshore utilization >80% in 2024 and double-digit oilfield services wage inflation in 2023–24. Input-price shocks (Brent ~86 USD/bbl; HRC ~600 USD/ton) and proprietary software lock‑ins raise costs; AGR’s multi‑sourcing, talent pipelines and in‑house tools partially mitigate risk.
| Metric | 2024 |
|---|---|
| Offshore rig utilization | 80%+ |
| Brent | 86 USD/bbl |
| HRC steel | ~600 USD/ton |
| Global cloud spend | >500 bn USD |
What is included in the product
 Detailed Word Document
Concise Porter’s Five Forces assessment of AGR Group AS, detailing competitive rivalry, supplier and buyer power, threats from new entrants and substitutes, and strategic implications for pricing and market positioning.

 Customizable Excel Spreadsheet
Clear, one-sheet Porter's Five Forces for AGR Group AS that pinpoints supplier/buyer power, competitive rivalry and threats—relieving analysis bottlenecks and enabling faster, confident strategic decisions.
Customers Bargaining Power

Concentrated E&P customer base
IOCs, NOCs and large independents run competitive tenders and frame agreements that drive strong price pressure on service providers, forcing AGR to compete on cost and scope rather than just availability.
Their procurement scale secures volume discounts and stringent SLAs, shifting bargaining power toward customers and compressing margins across E&P service chains.
AGR must therefore differentiate through superior performance, HSE excellence and integrated delivery models to defend pricing, while multi-year relationships with key clients can partially moderate price churn.
Ability to insource engineering
Many operators — including Shell, BP and Equinor in 2024 — retain in-house drilling and reservoir teams, reducing reliance on external well management and strengthening bargaining leverage via insourcing threats. AGR counters by documenting cycle-time and cost improvements in recent contracts to defend share. Deploying outcome-based pricing ties AGR revenue to performance and reduces customer pushback by aligning incentives.

High project stakes, measurable KPIs
Clients benchmark NPT, cost/ft and safety metrics across vendors, with 2024 procurement surveys showing 68% prioritize NPT, 62% cost/ft and 59% safety when awarding contracts. Poor performance can trigger penalties or replacement if NPT exceed peer medians. Strong analytics and transparency support 5–15% pricing premiums, while reference wells and case studies often decide final awards.

Moderate switching costs mid-campaign
Once a drilling campaign starts, vendor switches are costly and operationally risky, temporarily lowering buyer power, while pre-award multi-bid RFPs keep buyers leveraged; AGR locks value via phased plans and integrated software-toolchains and mitigates churn with clear transition plans and documented handovers.
- mid-campaign lock-in
- pre-award buyer leverage
- phased plans + toolchains
- transition plans reduce churn
Cyclical budget sensitivity
In downcycles buyers push for rate cuts and defer campaigns, squeezing margins, while in upcycles urgency favors incumbents that secure rigs and crews, easing pricing pressure; Brent averaged about 86 USD/bbl in 2024, underpinning cyclical budget swings. Flexible contracting and rapid capacity access are key differentiators, and scenario pricing helps align offers with shifting customer budgets.
- Downcycles: deferred campaigns, rate pressure
- Upcycles: incumbency advantage for rigs/crews
- Key levers: flexible contracts, capacity access
- Pricing tool: scenario-based alignment
Buyers set terms; 68% prioritize NPT; premiums 5–15%
Operators' large-scale tenders and insourcing options push bargaining power to buyers, forcing AGR to compete on cost, scope and performance; 2024 procurement surveys show 68% prioritize NPT, 62% cost/ft, 59% safety. Mid-campaign lock-in limits switching, while outcome-based pricing and analytics can secure 5–15% premium. Brent averaged ~86 USD/bbl in 2024, driving cyclical buyer leverage.
| Metric | 2024 | Implication |
|---|---|---|
| Procurement priorities | 68/62/59% | Buyers set terms |
| Performance premium | 5–15% | Differentiation value |
| Brent | ~86 USD/bbl | Cyclic budget swing |
Preview Before You Purchase
AGR Group AS Porter's Five Forces Analysis
This preview shows the exact AGR Group AS Porter's Five Forces Analysis you'll receive—no surprises, no placeholders. The document displayed is the final, professionally formatted file, ready for immediate download and use the moment you buy. You're looking at the same deliverable that will be available to you instantly after purchase.

Elevate Your Analysis with the Complete Porter's Five Forces Analysis
AGR Group AS faces moderate supplier leverage, concentrated buyers in select markets, and persistent rivalry from regional players. New entrant risk is muted by regulatory and capital barriers, while substitutes present niche threats. This snapshot only scratches the surface—unlock the full Porter's Five Forces Analysis for force-by-force ratings, visuals, and strategic implications.
Suppliers Bargaining Power
Consolidated critical tool and rig suppliers
Core inputs—rigs, BOPs, OCTG and drilling fluids—are concentrated among vendors such as Schlumberger, Halliburton and NOV, giving suppliers leverage in tight markets; global offshore rig utilization climbed above 80% in 2024, pressuring availability. Dayrates and tool rentals can spike, compressing turnkey margins. AGR reduces risk via multi‑sourcing and detailed planning, but supplier dependency and contract timing versus cycle remain material.
Specialized talent and certification dependence
Experienced drilling engineers, well managers and HSE-certified specialists are scarce, giving labor suppliers notable bargaining power and driving double-digit wage inflation in 2023–24 for oilfield services. Retention bonuses and higher dayrates have increased delivery costs during upcycles, while long training cycles (commonly 12–24 months) and strict compliance limit rapid substitution. AGR’s internal talent pipelines and global mobility programs partially offset these pressures by shortening vacancy times and reducing external hiring premiums.
Switching costs on proprietary software and data
Integration of AGR’s proprietary software with well design/planning systems and historical well data creates switching friction for operators, reinforcing supplier price power over niche subsurface models, real-time streams and cloud services. Vendors leveraging proprietary data APIs can impose premiums; global cloud spending exceeded $500 billion in 2024, strengthening vendor leverage. AGR’s in‑house tools reduce dependency but still require third‑party interfaces. Improved data portability and open standards such as WITSML accelerate reduced lock‑in over time.
Input price volatility and logistics risk
Input-price volatility drives supplier power for AGR Group as steel (HRC ≈ 600 USD/ton in 2024) and energy (Brent ≈ 86 USD/bbl in 2024) feed through to consumables and service costs; geopolitical and shipping disruptions push lead times and force premium expediting, raising margins. Contract pass-through clauses and fixed-price vs index-linked agreements determine how effectively cost spikes are transferred. Inventory buffers and hedging reduced but did not remove 2024 shocks.
- Steel: HRC ≈ 600 USD/ton (2024)
- Energy: Brent ≈ 86 USD/bbl (2024)
- Logistics: disruption-driven expediting increases OPEX
- Mitigants: contracts, inventory, hedging—partial dampeners
Regulatory and certification gatekeepers
Compliance bodies and inspection agencies function as quasi-suppliers for approvals, with tightened standards in 2024 increasing cost and schedule risk for project owners through longer approval cycles and additional testing requirements.
Maintaining impeccable documentation and pre-qualifications reduces exposure, and AGR Group ASs long-standing track record strengthens negotiation with auditors and insurers, lowering underwriting scrutiny and contingency loads.
- Compliance approvals = critical gate
- Delays raise schedule/cost risk
- Impeccable docs cut exposure
- Track record improves audit/insurer leverage
Supplier power, labor scarcity and input shocks squeeze oilfield-services margins
AGR faces strong supplier power from concentrated rig/OCTG/tool vendors and scarce skilled labor, with global offshore utilization >80% in 2024 and double-digit oilfield services wage inflation in 2023–24. Input-price shocks (Brent ~86 USD/bbl; HRC ~600 USD/ton) and proprietary software lock‑ins raise costs; AGR’s multi‑sourcing, talent pipelines and in‑house tools partially mitigate risk.
| Metric | 2024 |
|---|---|
| Offshore rig utilization | 80%+ |
| Brent | 86 USD/bbl |
| HRC steel | ~600 USD/ton |
| Global cloud spend | >500 bn USD |
What is included in the product
Detailed Word Document
Concise Porter’s Five Forces assessment of AGR Group AS, detailing competitive rivalry, supplier and buyer power, threats from new entrants and substitutes, and strategic implications for pricing and market positioning.
Customizable Excel Spreadsheet
Clear, one-sheet Porter's Five Forces for AGR Group AS that pinpoints supplier/buyer power, competitive rivalry and threats—relieving analysis bottlenecks and enabling faster, confident strategic decisions.
Customers Bargaining Power
Concentrated E&P customer base
IOCs, NOCs and large independents run competitive tenders and frame agreements that drive strong price pressure on service providers, forcing AGR to compete on cost and scope rather than just availability.
Their procurement scale secures volume discounts and stringent SLAs, shifting bargaining power toward customers and compressing margins across E&P service chains.
AGR must therefore differentiate through superior performance, HSE excellence and integrated delivery models to defend pricing, while multi-year relationships with key clients can partially moderate price churn.
Ability to insource engineering
Many operators — including Shell, BP and Equinor in 2024 — retain in-house drilling and reservoir teams, reducing reliance on external well management and strengthening bargaining leverage via insourcing threats. AGR counters by documenting cycle-time and cost improvements in recent contracts to defend share. Deploying outcome-based pricing ties AGR revenue to performance and reduces customer pushback by aligning incentives.
High project stakes, measurable KPIs
Clients benchmark NPT, cost/ft and safety metrics across vendors, with 2024 procurement surveys showing 68% prioritize NPT, 62% cost/ft and 59% safety when awarding contracts. Poor performance can trigger penalties or replacement if NPT exceed peer medians. Strong analytics and transparency support 5–15% pricing premiums, while reference wells and case studies often decide final awards.
Moderate switching costs mid-campaign
Once a drilling campaign starts, vendor switches are costly and operationally risky, temporarily lowering buyer power, while pre-award multi-bid RFPs keep buyers leveraged; AGR locks value via phased plans and integrated software-toolchains and mitigates churn with clear transition plans and documented handovers.
- mid-campaign lock-in
- pre-award buyer leverage
- phased plans + toolchains
- transition plans reduce churn
Cyclical budget sensitivity
In downcycles buyers push for rate cuts and defer campaigns, squeezing margins, while in upcycles urgency favors incumbents that secure rigs and crews, easing pricing pressure; Brent averaged about 86 USD/bbl in 2024, underpinning cyclical budget swings. Flexible contracting and rapid capacity access are key differentiators, and scenario pricing helps align offers with shifting customer budgets.
- Downcycles: deferred campaigns, rate pressure
- Upcycles: incumbency advantage for rigs/crews
- Key levers: flexible contracts, capacity access
- Pricing tool: scenario-based alignment
Buyers set terms; 68% prioritize NPT; premiums 5–15%
Operators' large-scale tenders and insourcing options push bargaining power to buyers, forcing AGR to compete on cost, scope and performance; 2024 procurement surveys show 68% prioritize NPT, 62% cost/ft, 59% safety. Mid-campaign lock-in limits switching, while outcome-based pricing and analytics can secure 5–15% premium. Brent averaged ~86 USD/bbl in 2024, driving cyclical buyer leverage.
| Metric | 2024 | Implication |
|---|---|---|
| Procurement priorities | 68/62/59% | Buyers set terms |
| Performance premium | 5–15% | Differentiation value |
| Brent | ~86 USD/bbl | Cyclic budget swing |
Preview Before You Purchase
AGR Group AS Porter's Five Forces Analysis
This preview shows the exact AGR Group AS Porter's Five Forces Analysis you'll receive—no surprises, no placeholders. The document displayed is the final, professionally formatted file, ready for immediate download and use the moment you buy. You're looking at the same deliverable that will be available to you instantly after purchase.
Original: $10.00
-65%$10.00
$3.50Description
Elevate Your Analysis with the Complete Porter's Five Forces Analysis
AGR Group AS faces moderate supplier leverage, concentrated buyers in select markets, and persistent rivalry from regional players. New entrant risk is muted by regulatory and capital barriers, while substitutes present niche threats. This snapshot only scratches the surface—unlock the full Porter's Five Forces Analysis for force-by-force ratings, visuals, and strategic implications.
Suppliers Bargaining Power
Consolidated critical tool and rig suppliers
Core inputs—rigs, BOPs, OCTG and drilling fluids—are concentrated among vendors such as Schlumberger, Halliburton and NOV, giving suppliers leverage in tight markets; global offshore rig utilization climbed above 80% in 2024, pressuring availability. Dayrates and tool rentals can spike, compressing turnkey margins. AGR reduces risk via multi‑sourcing and detailed planning, but supplier dependency and contract timing versus cycle remain material.
Specialized talent and certification dependence
Experienced drilling engineers, well managers and HSE-certified specialists are scarce, giving labor suppliers notable bargaining power and driving double-digit wage inflation in 2023–24 for oilfield services. Retention bonuses and higher dayrates have increased delivery costs during upcycles, while long training cycles (commonly 12–24 months) and strict compliance limit rapid substitution. AGR’s internal talent pipelines and global mobility programs partially offset these pressures by shortening vacancy times and reducing external hiring premiums.
Switching costs on proprietary software and data
Integration of AGR’s proprietary software with well design/planning systems and historical well data creates switching friction for operators, reinforcing supplier price power over niche subsurface models, real-time streams and cloud services. Vendors leveraging proprietary data APIs can impose premiums; global cloud spending exceeded $500 billion in 2024, strengthening vendor leverage. AGR’s in‑house tools reduce dependency but still require third‑party interfaces. Improved data portability and open standards such as WITSML accelerate reduced lock‑in over time.
Input price volatility and logistics risk
Input-price volatility drives supplier power for AGR Group as steel (HRC ≈ 600 USD/ton in 2024) and energy (Brent ≈ 86 USD/bbl in 2024) feed through to consumables and service costs; geopolitical and shipping disruptions push lead times and force premium expediting, raising margins. Contract pass-through clauses and fixed-price vs index-linked agreements determine how effectively cost spikes are transferred. Inventory buffers and hedging reduced but did not remove 2024 shocks.
- Steel: HRC ≈ 600 USD/ton (2024)
- Energy: Brent ≈ 86 USD/bbl (2024)
- Logistics: disruption-driven expediting increases OPEX
- Mitigants: contracts, inventory, hedging—partial dampeners
Regulatory and certification gatekeepers
Compliance bodies and inspection agencies function as quasi-suppliers for approvals, with tightened standards in 2024 increasing cost and schedule risk for project owners through longer approval cycles and additional testing requirements.
Maintaining impeccable documentation and pre-qualifications reduces exposure, and AGR Group ASs long-standing track record strengthens negotiation with auditors and insurers, lowering underwriting scrutiny and contingency loads.
- Compliance approvals = critical gate
- Delays raise schedule/cost risk
- Impeccable docs cut exposure
- Track record improves audit/insurer leverage
Supplier power, labor scarcity and input shocks squeeze oilfield-services margins
AGR faces strong supplier power from concentrated rig/OCTG/tool vendors and scarce skilled labor, with global offshore utilization >80% in 2024 and double-digit oilfield services wage inflation in 2023–24. Input-price shocks (Brent ~86 USD/bbl; HRC ~600 USD/ton) and proprietary software lock‑ins raise costs; AGR’s multi‑sourcing, talent pipelines and in‑house tools partially mitigate risk.
| Metric | 2024 |
|---|---|
| Offshore rig utilization | 80%+ |
| Brent | 86 USD/bbl |
| HRC steel | ~600 USD/ton |
| Global cloud spend | >500 bn USD |
What is included in the product
Detailed Word Document
Concise Porter’s Five Forces assessment of AGR Group AS, detailing competitive rivalry, supplier and buyer power, threats from new entrants and substitutes, and strategic implications for pricing and market positioning.
Customizable Excel Spreadsheet
Clear, one-sheet Porter's Five Forces for AGR Group AS that pinpoints supplier/buyer power, competitive rivalry and threats—relieving analysis bottlenecks and enabling faster, confident strategic decisions.
Customers Bargaining Power
Concentrated E&P customer base
IOCs, NOCs and large independents run competitive tenders and frame agreements that drive strong price pressure on service providers, forcing AGR to compete on cost and scope rather than just availability.
Their procurement scale secures volume discounts and stringent SLAs, shifting bargaining power toward customers and compressing margins across E&P service chains.
AGR must therefore differentiate through superior performance, HSE excellence and integrated delivery models to defend pricing, while multi-year relationships with key clients can partially moderate price churn.
Ability to insource engineering
Many operators — including Shell, BP and Equinor in 2024 — retain in-house drilling and reservoir teams, reducing reliance on external well management and strengthening bargaining leverage via insourcing threats. AGR counters by documenting cycle-time and cost improvements in recent contracts to defend share. Deploying outcome-based pricing ties AGR revenue to performance and reduces customer pushback by aligning incentives.
High project stakes, measurable KPIs
Clients benchmark NPT, cost/ft and safety metrics across vendors, with 2024 procurement surveys showing 68% prioritize NPT, 62% cost/ft and 59% safety when awarding contracts. Poor performance can trigger penalties or replacement if NPT exceed peer medians. Strong analytics and transparency support 5–15% pricing premiums, while reference wells and case studies often decide final awards.
Moderate switching costs mid-campaign
Once a drilling campaign starts, vendor switches are costly and operationally risky, temporarily lowering buyer power, while pre-award multi-bid RFPs keep buyers leveraged; AGR locks value via phased plans and integrated software-toolchains and mitigates churn with clear transition plans and documented handovers.
- mid-campaign lock-in
- pre-award buyer leverage
- phased plans + toolchains
- transition plans reduce churn
Cyclical budget sensitivity
In downcycles buyers push for rate cuts and defer campaigns, squeezing margins, while in upcycles urgency favors incumbents that secure rigs and crews, easing pricing pressure; Brent averaged about 86 USD/bbl in 2024, underpinning cyclical budget swings. Flexible contracting and rapid capacity access are key differentiators, and scenario pricing helps align offers with shifting customer budgets.
- Downcycles: deferred campaigns, rate pressure
- Upcycles: incumbency advantage for rigs/crews
- Key levers: flexible contracts, capacity access
- Pricing tool: scenario-based alignment
Buyers set terms; 68% prioritize NPT; premiums 5–15%
Operators' large-scale tenders and insourcing options push bargaining power to buyers, forcing AGR to compete on cost, scope and performance; 2024 procurement surveys show 68% prioritize NPT, 62% cost/ft, 59% safety. Mid-campaign lock-in limits switching, while outcome-based pricing and analytics can secure 5–15% premium. Brent averaged ~86 USD/bbl in 2024, driving cyclical buyer leverage.
| Metric | 2024 | Implication |
|---|---|---|
| Procurement priorities | 68/62/59% | Buyers set terms |
| Performance premium | 5–15% | Differentiation value |
| Brent | ~86 USD/bbl | Cyclic budget swing |
Preview Before You Purchase
AGR Group AS Porter's Five Forces Analysis
This preview shows the exact AGR Group AS Porter's Five Forces Analysis you'll receive—no surprises, no placeholders. The document displayed is the final, professionally formatted file, ready for immediate download and use the moment you buy. You're looking at the same deliverable that will be available to you instantly after purchase.











