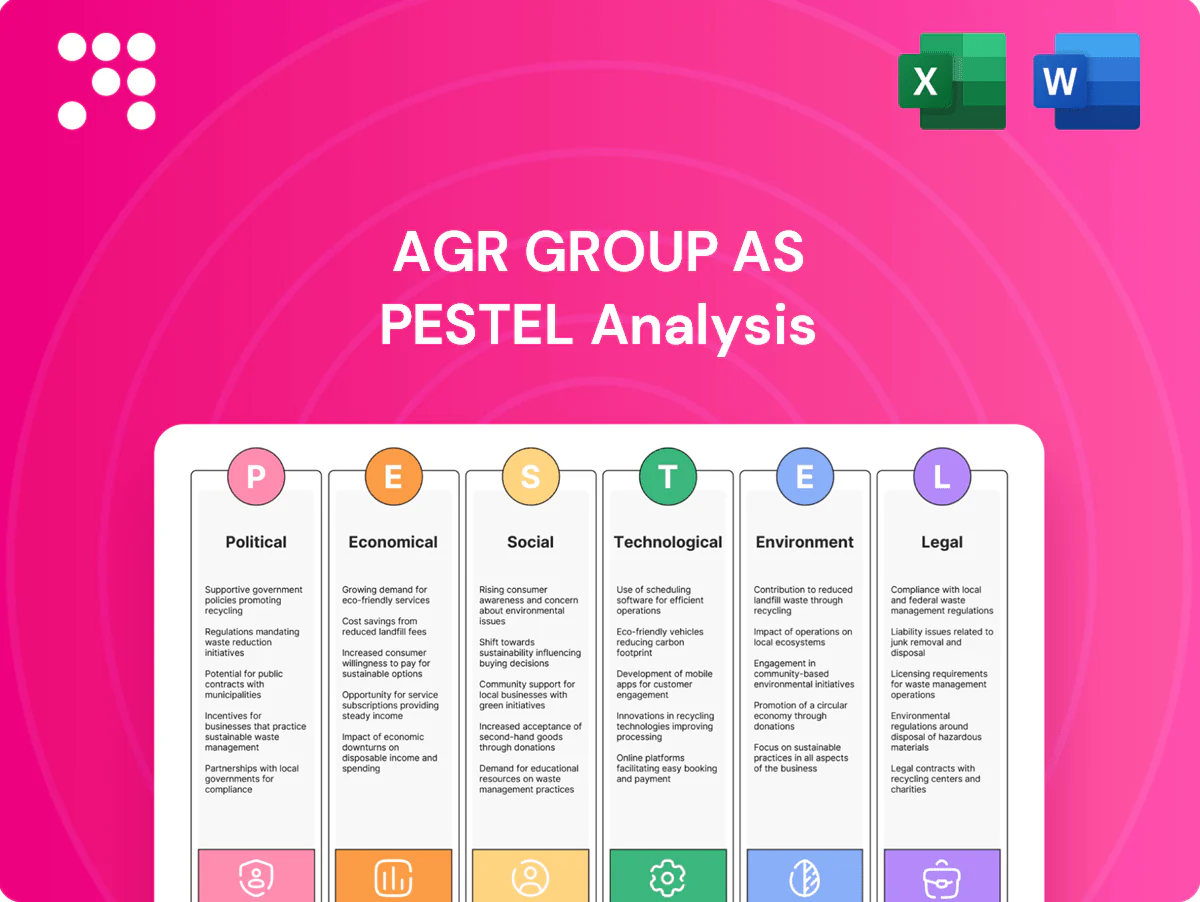
AGR Group AS PESTLE Analysis

Your Competitive Advantage Starts with This Report
Unlock strategic advantage with our tailored PESTLE Analysis of AGR Group AS. This concise report reveals political, economic, social, technological, legal, and environmental forces shaping the company’s future. Purchase the full version to access actionable insights and ready-to-use recommendations for investors and strategists.
Political factors

Energy transition policies and subsidies
Shifting government support from hydrocarbons to renewables, driven by policies like the US Inflation Reduction Act (about 369 billion USD of clean-energy incentives) and the EU CBAM phased from 2023, is reshaping client capex and reducing offshore/onshore well counts. Carbon-border adjustments and tax credits tilt basin economics; AGR must position well management and decommissioning as transition enablers and engage early with policymakers to anticipate demand swings.
Sanctions, export controls, and geopolitical risk
Sanctions targeting Russia, Iran and tech vendors limit market access and software deployments; Russia accounted for ~11% of global oil output in 2024, amplifying impacts on projects and supply chains. Geopolitical tensions have driven regional insurance and shipping premiums up to 300% and delayed drilling schedules. AGR needs flexible country strategies, compliant suppliers and scenario planning to protect multi-country campaigns.

Fiscal regimes and licensing terms
Changes in royalties, production-sharing and tax holidays materially affect drilling decisions; for example Norway’s marginal petroleum tax rate reaches 78% while UK headline corporation tax is 25%, shifting operators to higher-margin or lower-tax jurisdictions. Licensing rounds and local content rules determine project timing and partner selection. AGR should stress measurable cost savings under tighter fiscal terms and advocate for predictable frameworks to stabilize pipeline visibility.

National oil company priorities
NOCs set multi-year drilling agendas that anchor service demand; globally NOCs control roughly 80% of proven oil reserves and account for about 55% of production (2024), making their CAPEX plans decisive. Policy mandates for domestic capability push preference for local partnerships; AGR can meet NOC objectives via technology transfer, certified training and strategic alliances to qualify for long-term frameworks.
- NOC-led demand: ~80% reserves, ~55% production (2024)
- Policy tilt: domestic content mandates
- AGR levers: tech transfer + training
- Alliances boost long-term framework eligibility
Trade policy and mobility of talent
Trade policy and tighter visa rules increasingly constrain AGR Group AS crew deployment and equipment transfers; 2024 IATA surveys reported a c.20% rise in international crew visa processing delays, while cabotage limits force rerouting of vessels and raise mobilization costs.
Shifts in import duty regimes and border checks can delay projects and inflate costs; AGR should keep multi-hub resourcing, local vendor bases and proactive compliance to avoid border bottlenecks during critical drilling windows.
- Visa rules: impacts crew mobility and scheduling
- Cabotage: limits vessel use, increases transit costs
- Import duties: raises equipment mobilization costs
- Mitigation: multi-hub staffing, local suppliers, compliance
IRA USD 369bn, 300% premiums reshape hydrocarbon capex
Policy shifts (US IRA ~369bn clean incentives; EU CBAM phased 2023) cut hydrocarbon capex and lower well counts, boosting decommissioning demand. Sanctions and geopolitics raised shipping/insurance premiums up to ~300% (2024), disrupting projects. NOCs (≈80% reserves, 55% production 2024) and tax regimes (Norway top rate 78%) drive regional investment flows and local content needs.
| Issue | Key metric | Impact on AGR |
|---|---|---|
| Clean subsidies | USD 369bn (IRA) | Shift to decommissioning |
| Sanctions/geopolitics | Insurance +300% | Supply chain risk |
| NOC influence | ≈80% reserves | Long-term contracts |
What is included in the product
 Detailed Word Document
Provides a concise PESTLE evaluation of AGR Group AS, examining Political, Economic, Social, Technological, Environmental and Legal forces with region- and industry-specific data and trends; each factor includes actionable implications and forward-looking insights to help executives, consultants and investors identify risks, opportunities and strategic responses.

 Customizable Excel Spreadsheet
A concise, visually segmented PESTLE summary of AGR Group AS that can be dropped into presentations, shared across teams, and annotated with local notes to streamline external risk discussions and strategic planning.
Economic factors

Oil and gas price volatility
Commodity cycles directly affect drilling activity and service pricing: Brent averaged about 86 USD/bbl in 2024, driving spikes in demand for well planning, while troughs shift operators toward optimization and decommissioning. AGR’s countercyclical offerings—inspection, integrity and decommissioning services—help balance revenue across cycles. Hedging exposure via recurring software subscriptions and service contracts stabilizes cash flow during activity swings.
Client capex and financing conditions
Rates (US federal funds ~5.25–5.50% in mid‑2025) and credit spreads (US IG ~120–150bps in 2024–25) plus constrained equity appetite are delaying operator FIDs and pushing higher hurdle rates, favoring shorter‑payback wells. AGR should quantify cost‑per‑barrel reductions and demonstrate, e.g., 10–20% unit cost cuts, to win awards. Bundled services that raise client capital efficiency can shorten payback and increase award probability.

Inflation and supply chain costs
Rig day rates rose roughly 20% in 2024 while tubulars and chemicals saw input-cost inflation in the 10–25% range, pressuring operating margins. Cost passthroughs and index-linked contracts in AGRs portfolio have preserved margins by shifting ~70–90% of variable cost inflation to clients. Data-driven planning and predictive analytics can cut non-productive time by ~10–15%. Strategic procurement and inventory buffers reduced supply volatility and spot-price exposure by an estimated 10–20%.

Currency fluctuations
AGR Group invoices and incurs costs in USD, NOK, GBP and several emerging-market currencies; 2024 saw elevated FX volatility that materially affected project margins and bid competitiveness. FX swings compress margins on long-cycle projects unless offset; natural hedging from mixed currency cashflows and use of forward contracts are standard mitigation. Multi-currency software pricing preserves ARR by locking customer payments in stable currencies.
- Currency mix: USD/NOK/GBP + emerging markets
- Risk: 2024 FX volatility hit project margins
- Mitigants: natural hedges, forwards
- Revenue protection: multi-currency license pricing
M&A and industry consolidation
M&A and consolidation shift vendor lists and bargaining power toward larger integrated suppliers; global energy M&A deal value topped about $250 billion in 2023–24, increasing procurement scale and contract size.
Larger clients now prefer scalable, end-to-end partners, and AGR can capture share by offering full well lifecycle solutions; post-merger integrations create windows for replacements and pilot projects.
- Consolidation: larger buyers, fewer vendors
- Opportunity: end-to-end well lifecycle wins
- Timing: post-merger pilots and replacements
IRA USD 369bn, 300% premiums reshape hydrocarbon capex
Commodity cycles (Brent ~86 USD/bbl in 2024) drive drilling demand while AGR’s countercyclical inspection, integrity and decommissioning work smooths revenue; software/subscription ARR hedges activity swings. Higher rates (US fed ~5.25–5.50% mid‑2025) and tighter credit delay FIDs, favoring short‑payback wells; cost‑saving bundles (10–20% unit cuts) win bids. Input inflation (rig day rates +20% in 2024; tubulars +10–25%) pressures margins; index‑linked contracts pass ~70–90% to clients.
| Metric | 2024–25 |
|---|---|
| Brent | ~86 USD/bbl (2024) |
| Fed funds | 5.25–5.50% (mid‑2025) |
| Rig day rates | +20% (2024) |
| M&A energy | ~250 bn USD (2023–24) |
Preview the Actual Deliverable
AGR Group AS PESTLE Analysis
The preview shown here is the exact AGR Group AS PESTLE Analysis you’ll receive after purchase—fully formatted and ready to use. The layout, content, and structure visible are identical to the file you’ll download immediately after payment. No placeholders or teasers—this is the real, finished document you’ll own upon checkout.

Your Competitive Advantage Starts with This Report
Unlock strategic advantage with our tailored PESTLE Analysis of AGR Group AS. This concise report reveals political, economic, social, technological, legal, and environmental forces shaping the company’s future. Purchase the full version to access actionable insights and ready-to-use recommendations for investors and strategists.
Political factors
Energy transition policies and subsidies
Shifting government support from hydrocarbons to renewables, driven by policies like the US Inflation Reduction Act (about 369 billion USD of clean-energy incentives) and the EU CBAM phased from 2023, is reshaping client capex and reducing offshore/onshore well counts. Carbon-border adjustments and tax credits tilt basin economics; AGR must position well management and decommissioning as transition enablers and engage early with policymakers to anticipate demand swings.
Sanctions, export controls, and geopolitical risk
Sanctions targeting Russia, Iran and tech vendors limit market access and software deployments; Russia accounted for ~11% of global oil output in 2024, amplifying impacts on projects and supply chains. Geopolitical tensions have driven regional insurance and shipping premiums up to 300% and delayed drilling schedules. AGR needs flexible country strategies, compliant suppliers and scenario planning to protect multi-country campaigns.
Fiscal regimes and licensing terms
Changes in royalties, production-sharing and tax holidays materially affect drilling decisions; for example Norway’s marginal petroleum tax rate reaches 78% while UK headline corporation tax is 25%, shifting operators to higher-margin or lower-tax jurisdictions. Licensing rounds and local content rules determine project timing and partner selection. AGR should stress measurable cost savings under tighter fiscal terms and advocate for predictable frameworks to stabilize pipeline visibility.
National oil company priorities
NOCs set multi-year drilling agendas that anchor service demand; globally NOCs control roughly 80% of proven oil reserves and account for about 55% of production (2024), making their CAPEX plans decisive. Policy mandates for domestic capability push preference for local partnerships; AGR can meet NOC objectives via technology transfer, certified training and strategic alliances to qualify for long-term frameworks.
- NOC-led demand: ~80% reserves, ~55% production (2024)
- Policy tilt: domestic content mandates
- AGR levers: tech transfer + training
- Alliances boost long-term framework eligibility
Trade policy and mobility of talent
Trade policy and tighter visa rules increasingly constrain AGR Group AS crew deployment and equipment transfers; 2024 IATA surveys reported a c.20% rise in international crew visa processing delays, while cabotage limits force rerouting of vessels and raise mobilization costs.
Shifts in import duty regimes and border checks can delay projects and inflate costs; AGR should keep multi-hub resourcing, local vendor bases and proactive compliance to avoid border bottlenecks during critical drilling windows.
- Visa rules: impacts crew mobility and scheduling
- Cabotage: limits vessel use, increases transit costs
- Import duties: raises equipment mobilization costs
- Mitigation: multi-hub staffing, local suppliers, compliance
IRA USD 369bn, 300% premiums reshape hydrocarbon capex
Policy shifts (US IRA ~369bn clean incentives; EU CBAM phased 2023) cut hydrocarbon capex and lower well counts, boosting decommissioning demand. Sanctions and geopolitics raised shipping/insurance premiums up to ~300% (2024), disrupting projects. NOCs (≈80% reserves, 55% production 2024) and tax regimes (Norway top rate 78%) drive regional investment flows and local content needs.
| Issue | Key metric | Impact on AGR |
|---|---|---|
| Clean subsidies | USD 369bn (IRA) | Shift to decommissioning |
| Sanctions/geopolitics | Insurance +300% | Supply chain risk |
| NOC influence | ≈80% reserves | Long-term contracts |
What is included in the product
Detailed Word Document
Provides a concise PESTLE evaluation of AGR Group AS, examining Political, Economic, Social, Technological, Environmental and Legal forces with region- and industry-specific data and trends; each factor includes actionable implications and forward-looking insights to help executives, consultants and investors identify risks, opportunities and strategic responses.
Customizable Excel Spreadsheet
A concise, visually segmented PESTLE summary of AGR Group AS that can be dropped into presentations, shared across teams, and annotated with local notes to streamline external risk discussions and strategic planning.
Economic factors
Oil and gas price volatility
Commodity cycles directly affect drilling activity and service pricing: Brent averaged about 86 USD/bbl in 2024, driving spikes in demand for well planning, while troughs shift operators toward optimization and decommissioning. AGR’s countercyclical offerings—inspection, integrity and decommissioning services—help balance revenue across cycles. Hedging exposure via recurring software subscriptions and service contracts stabilizes cash flow during activity swings.
Client capex and financing conditions
Rates (US federal funds ~5.25–5.50% in mid‑2025) and credit spreads (US IG ~120–150bps in 2024–25) plus constrained equity appetite are delaying operator FIDs and pushing higher hurdle rates, favoring shorter‑payback wells. AGR should quantify cost‑per‑barrel reductions and demonstrate, e.g., 10–20% unit cost cuts, to win awards. Bundled services that raise client capital efficiency can shorten payback and increase award probability.
Inflation and supply chain costs
Rig day rates rose roughly 20% in 2024 while tubulars and chemicals saw input-cost inflation in the 10–25% range, pressuring operating margins. Cost passthroughs and index-linked contracts in AGRs portfolio have preserved margins by shifting ~70–90% of variable cost inflation to clients. Data-driven planning and predictive analytics can cut non-productive time by ~10–15%. Strategic procurement and inventory buffers reduced supply volatility and spot-price exposure by an estimated 10–20%.
Currency fluctuations
AGR Group invoices and incurs costs in USD, NOK, GBP and several emerging-market currencies; 2024 saw elevated FX volatility that materially affected project margins and bid competitiveness. FX swings compress margins on long-cycle projects unless offset; natural hedging from mixed currency cashflows and use of forward contracts are standard mitigation. Multi-currency software pricing preserves ARR by locking customer payments in stable currencies.
- Currency mix: USD/NOK/GBP + emerging markets
- Risk: 2024 FX volatility hit project margins
- Mitigants: natural hedges, forwards
- Revenue protection: multi-currency license pricing
M&A and industry consolidation
M&A and consolidation shift vendor lists and bargaining power toward larger integrated suppliers; global energy M&A deal value topped about $250 billion in 2023–24, increasing procurement scale and contract size.
Larger clients now prefer scalable, end-to-end partners, and AGR can capture share by offering full well lifecycle solutions; post-merger integrations create windows for replacements and pilot projects.
- Consolidation: larger buyers, fewer vendors
- Opportunity: end-to-end well lifecycle wins
- Timing: post-merger pilots and replacements
IRA USD 369bn, 300% premiums reshape hydrocarbon capex
Commodity cycles (Brent ~86 USD/bbl in 2024) drive drilling demand while AGR’s countercyclical inspection, integrity and decommissioning work smooths revenue; software/subscription ARR hedges activity swings. Higher rates (US fed ~5.25–5.50% mid‑2025) and tighter credit delay FIDs, favoring short‑payback wells; cost‑saving bundles (10–20% unit cuts) win bids. Input inflation (rig day rates +20% in 2024; tubulars +10–25%) pressures margins; index‑linked contracts pass ~70–90% to clients.
| Metric | 2024–25 |
|---|---|
| Brent | ~86 USD/bbl (2024) |
| Fed funds | 5.25–5.50% (mid‑2025) |
| Rig day rates | +20% (2024) |
| M&A energy | ~250 bn USD (2023–24) |
Preview the Actual Deliverable
AGR Group AS PESTLE Analysis
The preview shown here is the exact AGR Group AS PESTLE Analysis you’ll receive after purchase—fully formatted and ready to use. The layout, content, and structure visible are identical to the file you’ll download immediately after payment. No placeholders or teasers—this is the real, finished document you’ll own upon checkout.
Description
Your Competitive Advantage Starts with This Report
Unlock strategic advantage with our tailored PESTLE Analysis of AGR Group AS. This concise report reveals political, economic, social, technological, legal, and environmental forces shaping the company’s future. Purchase the full version to access actionable insights and ready-to-use recommendations for investors and strategists.
Political factors
Energy transition policies and subsidies
Shifting government support from hydrocarbons to renewables, driven by policies like the US Inflation Reduction Act (about 369 billion USD of clean-energy incentives) and the EU CBAM phased from 2023, is reshaping client capex and reducing offshore/onshore well counts. Carbon-border adjustments and tax credits tilt basin economics; AGR must position well management and decommissioning as transition enablers and engage early with policymakers to anticipate demand swings.
Sanctions, export controls, and geopolitical risk
Sanctions targeting Russia, Iran and tech vendors limit market access and software deployments; Russia accounted for ~11% of global oil output in 2024, amplifying impacts on projects and supply chains. Geopolitical tensions have driven regional insurance and shipping premiums up to 300% and delayed drilling schedules. AGR needs flexible country strategies, compliant suppliers and scenario planning to protect multi-country campaigns.
Fiscal regimes and licensing terms
Changes in royalties, production-sharing and tax holidays materially affect drilling decisions; for example Norway’s marginal petroleum tax rate reaches 78% while UK headline corporation tax is 25%, shifting operators to higher-margin or lower-tax jurisdictions. Licensing rounds and local content rules determine project timing and partner selection. AGR should stress measurable cost savings under tighter fiscal terms and advocate for predictable frameworks to stabilize pipeline visibility.
National oil company priorities
NOCs set multi-year drilling agendas that anchor service demand; globally NOCs control roughly 80% of proven oil reserves and account for about 55% of production (2024), making their CAPEX plans decisive. Policy mandates for domestic capability push preference for local partnerships; AGR can meet NOC objectives via technology transfer, certified training and strategic alliances to qualify for long-term frameworks.
- NOC-led demand: ~80% reserves, ~55% production (2024)
- Policy tilt: domestic content mandates
- AGR levers: tech transfer + training
- Alliances boost long-term framework eligibility
Trade policy and mobility of talent
Trade policy and tighter visa rules increasingly constrain AGR Group AS crew deployment and equipment transfers; 2024 IATA surveys reported a c.20% rise in international crew visa processing delays, while cabotage limits force rerouting of vessels and raise mobilization costs.
Shifts in import duty regimes and border checks can delay projects and inflate costs; AGR should keep multi-hub resourcing, local vendor bases and proactive compliance to avoid border bottlenecks during critical drilling windows.
- Visa rules: impacts crew mobility and scheduling
- Cabotage: limits vessel use, increases transit costs
- Import duties: raises equipment mobilization costs
- Mitigation: multi-hub staffing, local suppliers, compliance
IRA USD 369bn, 300% premiums reshape hydrocarbon capex
Policy shifts (US IRA ~369bn clean incentives; EU CBAM phased 2023) cut hydrocarbon capex and lower well counts, boosting decommissioning demand. Sanctions and geopolitics raised shipping/insurance premiums up to ~300% (2024), disrupting projects. NOCs (≈80% reserves, 55% production 2024) and tax regimes (Norway top rate 78%) drive regional investment flows and local content needs.
| Issue | Key metric | Impact on AGR |
|---|---|---|
| Clean subsidies | USD 369bn (IRA) | Shift to decommissioning |
| Sanctions/geopolitics | Insurance +300% | Supply chain risk |
| NOC influence | ≈80% reserves | Long-term contracts |
What is included in the product
Detailed Word Document
Provides a concise PESTLE evaluation of AGR Group AS, examining Political, Economic, Social, Technological, Environmental and Legal forces with region- and industry-specific data and trends; each factor includes actionable implications and forward-looking insights to help executives, consultants and investors identify risks, opportunities and strategic responses.
Customizable Excel Spreadsheet
A concise, visually segmented PESTLE summary of AGR Group AS that can be dropped into presentations, shared across teams, and annotated with local notes to streamline external risk discussions and strategic planning.
Economic factors
Oil and gas price volatility
Commodity cycles directly affect drilling activity and service pricing: Brent averaged about 86 USD/bbl in 2024, driving spikes in demand for well planning, while troughs shift operators toward optimization and decommissioning. AGR’s countercyclical offerings—inspection, integrity and decommissioning services—help balance revenue across cycles. Hedging exposure via recurring software subscriptions and service contracts stabilizes cash flow during activity swings.
Client capex and financing conditions
Rates (US federal funds ~5.25–5.50% in mid‑2025) and credit spreads (US IG ~120–150bps in 2024–25) plus constrained equity appetite are delaying operator FIDs and pushing higher hurdle rates, favoring shorter‑payback wells. AGR should quantify cost‑per‑barrel reductions and demonstrate, e.g., 10–20% unit cost cuts, to win awards. Bundled services that raise client capital efficiency can shorten payback and increase award probability.
Inflation and supply chain costs
Rig day rates rose roughly 20% in 2024 while tubulars and chemicals saw input-cost inflation in the 10–25% range, pressuring operating margins. Cost passthroughs and index-linked contracts in AGRs portfolio have preserved margins by shifting ~70–90% of variable cost inflation to clients. Data-driven planning and predictive analytics can cut non-productive time by ~10–15%. Strategic procurement and inventory buffers reduced supply volatility and spot-price exposure by an estimated 10–20%.
Currency fluctuations
AGR Group invoices and incurs costs in USD, NOK, GBP and several emerging-market currencies; 2024 saw elevated FX volatility that materially affected project margins and bid competitiveness. FX swings compress margins on long-cycle projects unless offset; natural hedging from mixed currency cashflows and use of forward contracts are standard mitigation. Multi-currency software pricing preserves ARR by locking customer payments in stable currencies.
- Currency mix: USD/NOK/GBP + emerging markets
- Risk: 2024 FX volatility hit project margins
- Mitigants: natural hedges, forwards
- Revenue protection: multi-currency license pricing
M&A and industry consolidation
M&A and consolidation shift vendor lists and bargaining power toward larger integrated suppliers; global energy M&A deal value topped about $250 billion in 2023–24, increasing procurement scale and contract size.
Larger clients now prefer scalable, end-to-end partners, and AGR can capture share by offering full well lifecycle solutions; post-merger integrations create windows for replacements and pilot projects.
- Consolidation: larger buyers, fewer vendors
- Opportunity: end-to-end well lifecycle wins
- Timing: post-merger pilots and replacements
IRA USD 369bn, 300% premiums reshape hydrocarbon capex
Commodity cycles (Brent ~86 USD/bbl in 2024) drive drilling demand while AGR’s countercyclical inspection, integrity and decommissioning work smooths revenue; software/subscription ARR hedges activity swings. Higher rates (US fed ~5.25–5.50% mid‑2025) and tighter credit delay FIDs, favoring short‑payback wells; cost‑saving bundles (10–20% unit cuts) win bids. Input inflation (rig day rates +20% in 2024; tubulars +10–25%) pressures margins; index‑linked contracts pass ~70–90% to clients.
| Metric | 2024–25 |
|---|---|
| Brent | ~86 USD/bbl (2024) |
| Fed funds | 5.25–5.50% (mid‑2025) |
| Rig day rates | +20% (2024) |
| M&A energy | ~250 bn USD (2023–24) |
Preview the Actual Deliverable
AGR Group AS PESTLE Analysis
The preview shown here is the exact AGR Group AS PESTLE Analysis you’ll receive after purchase—fully formatted and ready to use. The layout, content, and structure visible are identical to the file you’ll download immediately after payment. No placeholders or teasers—this is the real, finished document you’ll own upon checkout.











