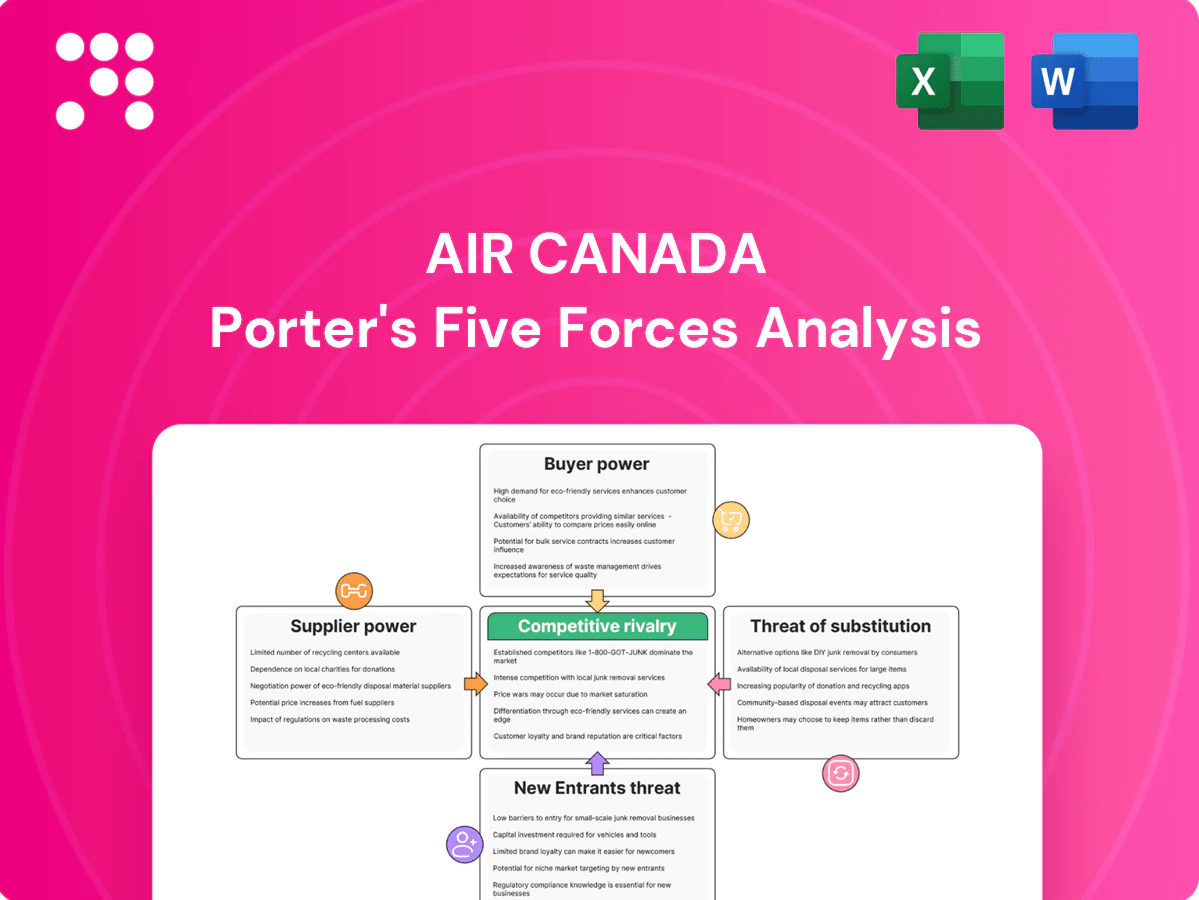
Air Canada Porter's Five Forces Analysis

From Overview to Strategy Blueprint
Air Canada faces intense rivalry, fluctuating fuel and labor supplier power, moderate buyer leverage from corporate contracts, and persistent threats from low-cost carriers and substitutes like video conferencing. This snapshot highlights key pressures shaping margins and growth. Unlock the full Porter's Five Forces Analysis to explore force-by-force ratings, visuals, and strategic implications in detail.
Suppliers Bargaining Power

Concentrated aircraft and engine makers
Airbus and Boeing together account for roughly 85–90% of global large commercial jet deliveries in 2023–24, constraining Air Canada’s leverage on price, specs and delivery slots. A handful of engine OEMs (GE/CFM, Pratt & Whitney, Rolls‑Royce) hold over ~80% of engine market share, further limiting bargaining power. High switching costs — pilot type ratings, maintenance training, spares and certification — and Air Canada’s A220/A320-family and Boeing fleet commonality deepen vendor dependence.
Jet fuel suppliers and price volatility
Jet fuel is a major input, typically accounting for about 20–30% of airline operating costs, and supply is concentrated in a handful of refining hubs making Air Canada exposed to global price swings and geopolitical shocks.
Hedging programs reduce short-term exposure but cannot eliminate market-driven volatility or basis risk; residual exposure remains during sharp spikes.
Rising policy mandates and SAF demand (SAF currently costs roughly 2–4 times conventional jet fuel) are likely to tighten supplier leverage and upward price pressure.

Airports, ATC, and slot constraints
Major hubs such as Toronto Pearson (50+ million passengers in 2023 per GTAA), Vancouver and key international airports enforce fees, slot coordination and operational rules that Air Canada must accept. Peak congestion and slot scarcity at airports like Heathrow and JFK elevate supplier power and push up airport/ATC charges. Limited alternatives on prime transatlantic and transborder routes reduce Air Canada’s bargaining options and capacity flexibility.

Labor unions and specialized skills
Pilots, technicians and cabin crew at Air Canada are unionized and sit within a global skills squeeze — IATA projected a pilot shortfall near 34,000 by 2026 — so contract negotiations materially influence labor costs and operational flexibility; certifications and training (eg 1,500‑hr ATP) raise switching costs.
- Unionized workforce
- IATA pilot gap ~34,000 (by 2026)
- 1,500‑hr ATP raises entry barriers
- Negotiations drive wage and scheduling risk
MRO ecosystems and tech data access
OEM control of parts, manuals and repair approvals limits third-party options; even with in-house MRO, Air Canada remains tied to OEM terms for proprietary components, raising costs and compliance hurdles.
Prolonged parts lead times and AOG risks increase supplier leverage, with industry estimates placing the 2024 global commercial MRO market near US$85 billion, amplifying OEM aftermarket influence.
- OEM repair approvals: constrains third-party choices
- In-house MRO: reduces but does not eliminate OEM dependence
- Parts lead times/AOG: heighten supplier bargaining power
Concentrated OEMs (85-90%) and high fuel/SAF costs squeeze airline margins
Concentrated OEMs (Airbus/Boeing ~85–90% deliveries; engine OEMs ~80% share) plus high switching costs limit Air Canada’s supplier leverage. Jet fuel 20–30% of costs and SAF 2–4x price elevate exposure despite hedging. Airports (Toronto Pearson 50+M pax 2023) and unionized labor (IATA pilot gap ~34,000 by 2026) further constrain bargaining power.
| Item | 2023–24 / 2024 |
|---|---|
| Airframe market share | Airbus+Boeing 85–90% |
| Engine OEM share | ~80% |
| Jet fuel share of costs | 20–30% |
| Toronto Pearson pax | 50+ million (2023) |
| IATA pilot gap | ~34,000 (by 2026) |
| Global MRO market | ~US$85bn (2024) |
| SAF price vs jet | ~2–4x |
What is included in the product
 Detailed Word Document
Tailored Porter's Five Forces analysis for Air Canada uncovering competitive drivers, buyer and supplier power, substitutes and disruptive threats, and barriers to entry—delivering strategic insights you can edit and deploy in investor materials, strategy decks, or academic work.

 Customizable Excel Spreadsheet
One-sheet Air Canada Porter's Five Forces summary with an instant spider/radar chart—customize pressure levels for fuel, regulation, and competition to use in decks or boardrooms without macros or complex code.
Customers Bargaining Power

Price-sensitive leisure travelers
Price-sensitive leisure travelers increasingly compare fares across OTAs and metasearch engines, with over 60% of leisure searches routed through these platforms in 2024, boosting price transparency. Demand on many leisure routes remains elastic (price elasticity often around -1.1 to -1.3), intensifying downward fare pressure. Air Canada offsets some buyer power via ancillary fees and fare families, which in 2024 accounted for roughly 8–10% of passenger revenue.
Corporate and government contracts
Large corporate and government contracts force Air Canada into negotiated discounts, flexible routing and bespoke service levels, reflecting procurement leverage as business travel recovered to roughly 85% of 2019 levels in 2024 per IATA. Volume concentration lets major accounts pressure yields and schedules, especially on transborder and transatlantic routes. Air Canada’s loyalty program and broad network mitigate but do not eliminate this bargaining power.

Loyalty program switching and status
Aeroplan raises switching costs through points balances and elite perks (priority boarding, lounge access), with over 6 million members reported by Air Canada in 2024, reinforcing retention. Transferable bank points (American Express, TD, CIBC) and Star Alliance partners provide alternative redemption routes and some mobility. Periodic award-chart devaluations and service lapses have historically prompted spikes in complaints and defections.

Cargo shippers and forwarders
Cargo shippers and forwarders exert moderate bargaining power over Air Canada: shippers compare air to ocean, rail and trucking on time-value and cost, while forwarders aggregate demand and negotiate rates on behalf of multiple customers. IATA noted in 2024 that passenger recovery restored belly capacity toward pre‑pandemic levels, keeping belly share around 50% and reducing Air Canada’s peak pricing leverage versus off‑peak cycles.
Service quality and disruption sensitivity
Service quality drives customer bargaining power: Air Canada reported a 76% on-time performance in H1 2024 and IRROP-related refunds rose 12% year-over-year, making recovery policies a choice determinant; social media mentions surged 22% in 2024, amplifying reputational impact; strong competition on trunk routes (WestJet, low-cost carriers) raises passenger expectations and switching propensity.
- OTP 76% (H1 2024)
- IRROP refunds +12% YoY (2024)
- Social mentions +22% (2024)
- High competition on trunk routes
Leisure price sensitivity and 76% OTP pressure fares; ancillaries cushion revenue
Customers wield moderate-to-high bargaining power: leisure price sensitivity (60%+ OTA searches in 2024, elasticity ~-1.1 to -1.3) pressures fares while ancillaries (8–10% of passenger revenue in 2024) and Aeroplan (6M+ members) mitigate switching. Corporates negotiate discounts as business travel recovered to ~85% of 2019 levels in 2024; OTP 76% (H1 2024) and service lapses amplify churn.
| Metric | 2024 |
|---|---|
| Leisure OTA share | 60%+ |
| Ancillary rev | 8–10% |
| Aeroplan members | 6M+ |
| Business travel vs 2019 | ~85% |
| OTP (H1) | 76% |
| IRROP refunds YoY | +12% |
Preview the Actual Deliverable
Air Canada Porter's Five Forces Analysis
This preview shows the exact document you'll receive immediately after purchase—no surprises or placeholders. It contains a complete Porter’s Five Forces analysis of Air Canada covering competitive rivalry, supplier and buyer power, and threats of entry and substitution. The file is professionally formatted, sourced and ready for use. You’ll get instant access to this identical document after payment.

From Overview to Strategy Blueprint
Air Canada faces intense rivalry, fluctuating fuel and labor supplier power, moderate buyer leverage from corporate contracts, and persistent threats from low-cost carriers and substitutes like video conferencing. This snapshot highlights key pressures shaping margins and growth. Unlock the full Porter's Five Forces Analysis to explore force-by-force ratings, visuals, and strategic implications in detail.
Suppliers Bargaining Power
Concentrated aircraft and engine makers
Airbus and Boeing together account for roughly 85–90% of global large commercial jet deliveries in 2023–24, constraining Air Canada’s leverage on price, specs and delivery slots. A handful of engine OEMs (GE/CFM, Pratt & Whitney, Rolls‑Royce) hold over ~80% of engine market share, further limiting bargaining power. High switching costs — pilot type ratings, maintenance training, spares and certification — and Air Canada’s A220/A320-family and Boeing fleet commonality deepen vendor dependence.
Jet fuel suppliers and price volatility
Jet fuel is a major input, typically accounting for about 20–30% of airline operating costs, and supply is concentrated in a handful of refining hubs making Air Canada exposed to global price swings and geopolitical shocks.
Hedging programs reduce short-term exposure but cannot eliminate market-driven volatility or basis risk; residual exposure remains during sharp spikes.
Rising policy mandates and SAF demand (SAF currently costs roughly 2–4 times conventional jet fuel) are likely to tighten supplier leverage and upward price pressure.
Airports, ATC, and slot constraints
Major hubs such as Toronto Pearson (50+ million passengers in 2023 per GTAA), Vancouver and key international airports enforce fees, slot coordination and operational rules that Air Canada must accept. Peak congestion and slot scarcity at airports like Heathrow and JFK elevate supplier power and push up airport/ATC charges. Limited alternatives on prime transatlantic and transborder routes reduce Air Canada’s bargaining options and capacity flexibility.
Labor unions and specialized skills
Pilots, technicians and cabin crew at Air Canada are unionized and sit within a global skills squeeze — IATA projected a pilot shortfall near 34,000 by 2026 — so contract negotiations materially influence labor costs and operational flexibility; certifications and training (eg 1,500‑hr ATP) raise switching costs.
- Unionized workforce
- IATA pilot gap ~34,000 (by 2026)
- 1,500‑hr ATP raises entry barriers
- Negotiations drive wage and scheduling risk
MRO ecosystems and tech data access
OEM control of parts, manuals and repair approvals limits third-party options; even with in-house MRO, Air Canada remains tied to OEM terms for proprietary components, raising costs and compliance hurdles.
Prolonged parts lead times and AOG risks increase supplier leverage, with industry estimates placing the 2024 global commercial MRO market near US$85 billion, amplifying OEM aftermarket influence.
- OEM repair approvals: constrains third-party choices
- In-house MRO: reduces but does not eliminate OEM dependence
- Parts lead times/AOG: heighten supplier bargaining power
Concentrated OEMs (85-90%) and high fuel/SAF costs squeeze airline margins
Concentrated OEMs (Airbus/Boeing ~85–90% deliveries; engine OEMs ~80% share) plus high switching costs limit Air Canada’s supplier leverage. Jet fuel 20–30% of costs and SAF 2–4x price elevate exposure despite hedging. Airports (Toronto Pearson 50+M pax 2023) and unionized labor (IATA pilot gap ~34,000 by 2026) further constrain bargaining power.
| Item | 2023–24 / 2024 |
|---|---|
| Airframe market share | Airbus+Boeing 85–90% |
| Engine OEM share | ~80% |
| Jet fuel share of costs | 20–30% |
| Toronto Pearson pax | 50+ million (2023) |
| IATA pilot gap | ~34,000 (by 2026) |
| Global MRO market | ~US$85bn (2024) |
| SAF price vs jet | ~2–4x |
What is included in the product
Detailed Word Document
Tailored Porter's Five Forces analysis for Air Canada uncovering competitive drivers, buyer and supplier power, substitutes and disruptive threats, and barriers to entry—delivering strategic insights you can edit and deploy in investor materials, strategy decks, or academic work.
Customizable Excel Spreadsheet
One-sheet Air Canada Porter's Five Forces summary with an instant spider/radar chart—customize pressure levels for fuel, regulation, and competition to use in decks or boardrooms without macros or complex code.
Customers Bargaining Power
Price-sensitive leisure travelers
Price-sensitive leisure travelers increasingly compare fares across OTAs and metasearch engines, with over 60% of leisure searches routed through these platforms in 2024, boosting price transparency. Demand on many leisure routes remains elastic (price elasticity often around -1.1 to -1.3), intensifying downward fare pressure. Air Canada offsets some buyer power via ancillary fees and fare families, which in 2024 accounted for roughly 8–10% of passenger revenue.
Corporate and government contracts
Large corporate and government contracts force Air Canada into negotiated discounts, flexible routing and bespoke service levels, reflecting procurement leverage as business travel recovered to roughly 85% of 2019 levels in 2024 per IATA. Volume concentration lets major accounts pressure yields and schedules, especially on transborder and transatlantic routes. Air Canada’s loyalty program and broad network mitigate but do not eliminate this bargaining power.
Loyalty program switching and status
Aeroplan raises switching costs through points balances and elite perks (priority boarding, lounge access), with over 6 million members reported by Air Canada in 2024, reinforcing retention. Transferable bank points (American Express, TD, CIBC) and Star Alliance partners provide alternative redemption routes and some mobility. Periodic award-chart devaluations and service lapses have historically prompted spikes in complaints and defections.
Cargo shippers and forwarders
Cargo shippers and forwarders exert moderate bargaining power over Air Canada: shippers compare air to ocean, rail and trucking on time-value and cost, while forwarders aggregate demand and negotiate rates on behalf of multiple customers. IATA noted in 2024 that passenger recovery restored belly capacity toward pre‑pandemic levels, keeping belly share around 50% and reducing Air Canada’s peak pricing leverage versus off‑peak cycles.
Service quality and disruption sensitivity
Service quality drives customer bargaining power: Air Canada reported a 76% on-time performance in H1 2024 and IRROP-related refunds rose 12% year-over-year, making recovery policies a choice determinant; social media mentions surged 22% in 2024, amplifying reputational impact; strong competition on trunk routes (WestJet, low-cost carriers) raises passenger expectations and switching propensity.
- OTP 76% (H1 2024)
- IRROP refunds +12% YoY (2024)
- Social mentions +22% (2024)
- High competition on trunk routes
Leisure price sensitivity and 76% OTP pressure fares; ancillaries cushion revenue
Customers wield moderate-to-high bargaining power: leisure price sensitivity (60%+ OTA searches in 2024, elasticity ~-1.1 to -1.3) pressures fares while ancillaries (8–10% of passenger revenue in 2024) and Aeroplan (6M+ members) mitigate switching. Corporates negotiate discounts as business travel recovered to ~85% of 2019 levels in 2024; OTP 76% (H1 2024) and service lapses amplify churn.
| Metric | 2024 |
|---|---|
| Leisure OTA share | 60%+ |
| Ancillary rev | 8–10% |
| Aeroplan members | 6M+ |
| Business travel vs 2019 | ~85% |
| OTP (H1) | 76% |
| IRROP refunds YoY | +12% |
Preview the Actual Deliverable
Air Canada Porter's Five Forces Analysis
This preview shows the exact document you'll receive immediately after purchase—no surprises or placeholders. It contains a complete Porter’s Five Forces analysis of Air Canada covering competitive rivalry, supplier and buyer power, and threats of entry and substitution. The file is professionally formatted, sourced and ready for use. You’ll get instant access to this identical document after payment.
Description
From Overview to Strategy Blueprint
Air Canada faces intense rivalry, fluctuating fuel and labor supplier power, moderate buyer leverage from corporate contracts, and persistent threats from low-cost carriers and substitutes like video conferencing. This snapshot highlights key pressures shaping margins and growth. Unlock the full Porter's Five Forces Analysis to explore force-by-force ratings, visuals, and strategic implications in detail.
Suppliers Bargaining Power
Concentrated aircraft and engine makers
Airbus and Boeing together account for roughly 85–90% of global large commercial jet deliveries in 2023–24, constraining Air Canada’s leverage on price, specs and delivery slots. A handful of engine OEMs (GE/CFM, Pratt & Whitney, Rolls‑Royce) hold over ~80% of engine market share, further limiting bargaining power. High switching costs — pilot type ratings, maintenance training, spares and certification — and Air Canada’s A220/A320-family and Boeing fleet commonality deepen vendor dependence.
Jet fuel suppliers and price volatility
Jet fuel is a major input, typically accounting for about 20–30% of airline operating costs, and supply is concentrated in a handful of refining hubs making Air Canada exposed to global price swings and geopolitical shocks.
Hedging programs reduce short-term exposure but cannot eliminate market-driven volatility or basis risk; residual exposure remains during sharp spikes.
Rising policy mandates and SAF demand (SAF currently costs roughly 2–4 times conventional jet fuel) are likely to tighten supplier leverage and upward price pressure.
Airports, ATC, and slot constraints
Major hubs such as Toronto Pearson (50+ million passengers in 2023 per GTAA), Vancouver and key international airports enforce fees, slot coordination and operational rules that Air Canada must accept. Peak congestion and slot scarcity at airports like Heathrow and JFK elevate supplier power and push up airport/ATC charges. Limited alternatives on prime transatlantic and transborder routes reduce Air Canada’s bargaining options and capacity flexibility.
Labor unions and specialized skills
Pilots, technicians and cabin crew at Air Canada are unionized and sit within a global skills squeeze — IATA projected a pilot shortfall near 34,000 by 2026 — so contract negotiations materially influence labor costs and operational flexibility; certifications and training (eg 1,500‑hr ATP) raise switching costs.
- Unionized workforce
- IATA pilot gap ~34,000 (by 2026)
- 1,500‑hr ATP raises entry barriers
- Negotiations drive wage and scheduling risk
MRO ecosystems and tech data access
OEM control of parts, manuals and repair approvals limits third-party options; even with in-house MRO, Air Canada remains tied to OEM terms for proprietary components, raising costs and compliance hurdles.
Prolonged parts lead times and AOG risks increase supplier leverage, with industry estimates placing the 2024 global commercial MRO market near US$85 billion, amplifying OEM aftermarket influence.
- OEM repair approvals: constrains third-party choices
- In-house MRO: reduces but does not eliminate OEM dependence
- Parts lead times/AOG: heighten supplier bargaining power
Concentrated OEMs (85-90%) and high fuel/SAF costs squeeze airline margins
Concentrated OEMs (Airbus/Boeing ~85–90% deliveries; engine OEMs ~80% share) plus high switching costs limit Air Canada’s supplier leverage. Jet fuel 20–30% of costs and SAF 2–4x price elevate exposure despite hedging. Airports (Toronto Pearson 50+M pax 2023) and unionized labor (IATA pilot gap ~34,000 by 2026) further constrain bargaining power.
| Item | 2023–24 / 2024 |
|---|---|
| Airframe market share | Airbus+Boeing 85–90% |
| Engine OEM share | ~80% |
| Jet fuel share of costs | 20–30% |
| Toronto Pearson pax | 50+ million (2023) |
| IATA pilot gap | ~34,000 (by 2026) |
| Global MRO market | ~US$85bn (2024) |
| SAF price vs jet | ~2–4x |
What is included in the product
Detailed Word Document
Tailored Porter's Five Forces analysis for Air Canada uncovering competitive drivers, buyer and supplier power, substitutes and disruptive threats, and barriers to entry—delivering strategic insights you can edit and deploy in investor materials, strategy decks, or academic work.
Customizable Excel Spreadsheet
One-sheet Air Canada Porter's Five Forces summary with an instant spider/radar chart—customize pressure levels for fuel, regulation, and competition to use in decks or boardrooms without macros or complex code.
Customers Bargaining Power
Price-sensitive leisure travelers
Price-sensitive leisure travelers increasingly compare fares across OTAs and metasearch engines, with over 60% of leisure searches routed through these platforms in 2024, boosting price transparency. Demand on many leisure routes remains elastic (price elasticity often around -1.1 to -1.3), intensifying downward fare pressure. Air Canada offsets some buyer power via ancillary fees and fare families, which in 2024 accounted for roughly 8–10% of passenger revenue.
Corporate and government contracts
Large corporate and government contracts force Air Canada into negotiated discounts, flexible routing and bespoke service levels, reflecting procurement leverage as business travel recovered to roughly 85% of 2019 levels in 2024 per IATA. Volume concentration lets major accounts pressure yields and schedules, especially on transborder and transatlantic routes. Air Canada’s loyalty program and broad network mitigate but do not eliminate this bargaining power.
Loyalty program switching and status
Aeroplan raises switching costs through points balances and elite perks (priority boarding, lounge access), with over 6 million members reported by Air Canada in 2024, reinforcing retention. Transferable bank points (American Express, TD, CIBC) and Star Alliance partners provide alternative redemption routes and some mobility. Periodic award-chart devaluations and service lapses have historically prompted spikes in complaints and defections.
Cargo shippers and forwarders
Cargo shippers and forwarders exert moderate bargaining power over Air Canada: shippers compare air to ocean, rail and trucking on time-value and cost, while forwarders aggregate demand and negotiate rates on behalf of multiple customers. IATA noted in 2024 that passenger recovery restored belly capacity toward pre‑pandemic levels, keeping belly share around 50% and reducing Air Canada’s peak pricing leverage versus off‑peak cycles.
Service quality and disruption sensitivity
Service quality drives customer bargaining power: Air Canada reported a 76% on-time performance in H1 2024 and IRROP-related refunds rose 12% year-over-year, making recovery policies a choice determinant; social media mentions surged 22% in 2024, amplifying reputational impact; strong competition on trunk routes (WestJet, low-cost carriers) raises passenger expectations and switching propensity.
- OTP 76% (H1 2024)
- IRROP refunds +12% YoY (2024)
- Social mentions +22% (2024)
- High competition on trunk routes
Leisure price sensitivity and 76% OTP pressure fares; ancillaries cushion revenue
Customers wield moderate-to-high bargaining power: leisure price sensitivity (60%+ OTA searches in 2024, elasticity ~-1.1 to -1.3) pressures fares while ancillaries (8–10% of passenger revenue in 2024) and Aeroplan (6M+ members) mitigate switching. Corporates negotiate discounts as business travel recovered to ~85% of 2019 levels in 2024; OTP 76% (H1 2024) and service lapses amplify churn.
| Metric | 2024 |
|---|---|
| Leisure OTA share | 60%+ |
| Ancillary rev | 8–10% |
| Aeroplan members | 6M+ |
| Business travel vs 2019 | ~85% |
| OTP (H1) | 76% |
| IRROP refunds YoY | +12% |
Preview the Actual Deliverable
Air Canada Porter's Five Forces Analysis
This preview shows the exact document you'll receive immediately after purchase—no surprises or placeholders. It contains a complete Porter’s Five Forces analysis of Air Canada covering competitive rivalry, supplier and buyer power, and threats of entry and substitution. The file is professionally formatted, sourced and ready for use. You’ll get instant access to this identical document after payment.











