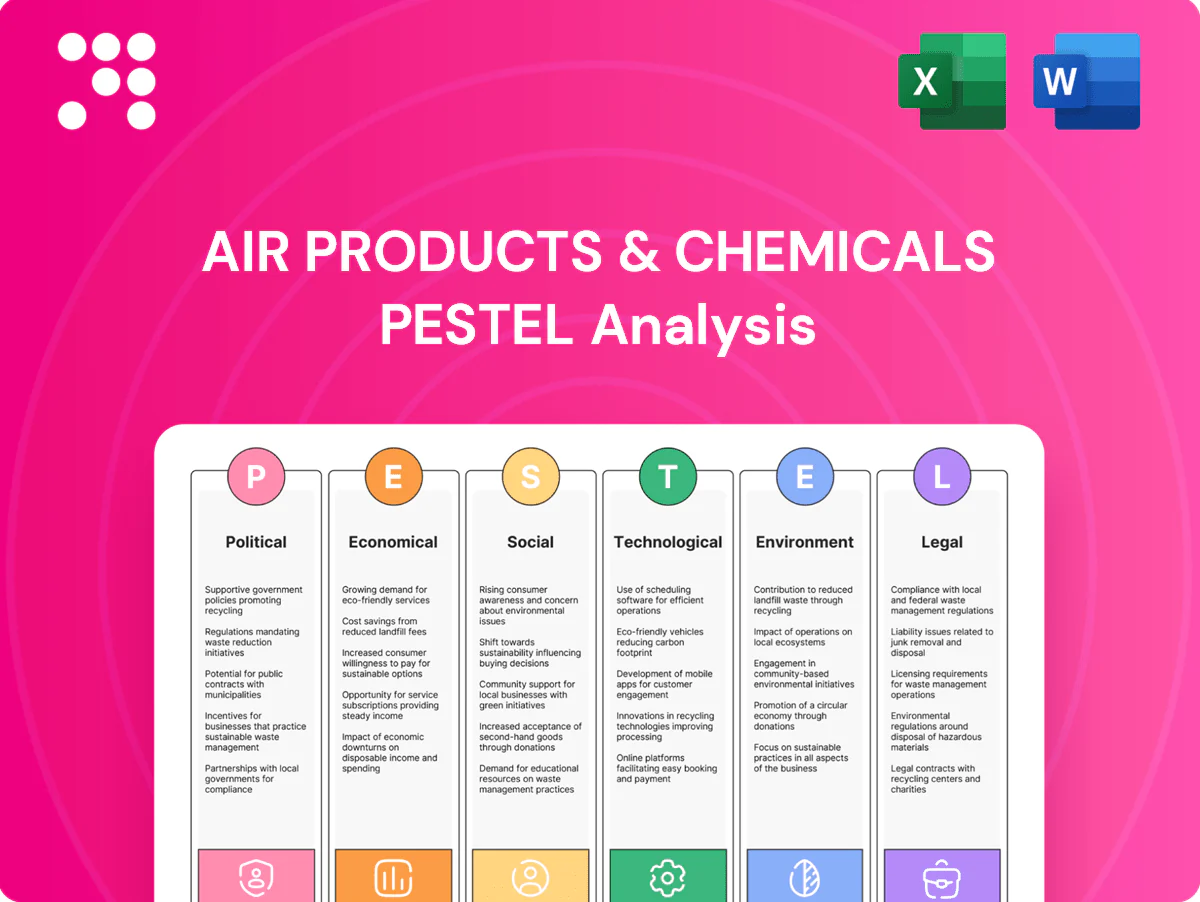
Air Products & Chemicals PESTLE Analysis

Make Smarter Strategic Decisions with a Complete PESTEL View
Discover how political shifts, economic cycles, social trends, technological advances, legal changes, and environmental pressure are reshaping Air Products & Chemicals's strategic outlook in our concise PESTLE snapshot. Use these insights to anticipate risks, identify growth vectors, and sharpen investment or business decisions. Purchase the full analysis for a detailed, actionable breakdown ready for immediate use.
Political factors

Geopolitical stability and trade policy
Industrial gases rely on cross-border supply chains for equipment, feedstocks and project execution; Air Products operates in over 50 countries with roughly 22,000 employees, so tariffs, sanctions or export controls can disrupt cryogenic equipment shipments and specialty gas flows. Political volatility in energy-producing regions undermines long-term contract certainty; diversifying project locations and suppliers mitigates these risks.
Energy transition policy direction
National hydrogen strategies (EU target 10 million tonnes H2 by 2030) and decarbonization roadmaps directly shape demand for low‑carbon hydrogen and oxygen used in refining and industry. Government hub funding—US Bipartisan Infrastructure Law committing up to $8 billion—and public–private partnerships accelerate large‑scale projects. Political leadership shifts can speed or stall approvals and incentives like the 45V hydrogen tax credit (up to $3/kg), so Air Products must align projects with durable bipartisan policy support.

Subsidies and incentives competition
US IRA mobilizes roughly $369 billion in clean energy spending and offers the 45V hydrogen credit up to $3/kg, while the EU Green Deal targets 10 Mt renewable hydrogen by 2030; Asian subsidies (notably Japan and Korea) add production and CCUS support, shifting build locations for blue/green hydrogen, ammonia and CCUS. Incentive certainty dictates capital allocation and offtake pricing; subsidy races or harmonization can swing project IRRs quickly, making stable, bankable credit regimes a locational advantage.

Local permitting and community acceptance
Large Air Products plants trigger municipal zoning, public hearings and environmental justice scrutiny, especially for hydrogen and industrial gas sites in Texas and Louisiana where community concern often centers on safety and emissions; political leaders balance job creation against perceived risks. Early stakeholder engagement and community benefit agreements have proven to reduce opposition and construction delays.
- Local zoning: public hearings required
- Political trade-off: jobs vs. safety
- Mitigation: early engagement
- Tool: community benefit agreements
State-owned enterprise dynamics
In key regions Air Products often sells to state-owned refiners, petrochemical makers and power utilities, with roughly one-third of large industrial contracts in APAC and MENA involving SOEs. National mandates on fuel quality, emissions (eg China 2060 net-zero) and localization reshape pricing, offset terms and capex timing, while political priorities can postpone projects by quarters. Strong government relations materially affect project selection, permitting and execution.
- SOE share ~33% of major regional contracts
- Regulatory drivers: emissions targets, localization rules
- Govt relations = critical to schedule and margins
Tariffs, sanctions and zoning threaten hydrogen projects; EU 10 Mt, US incentives drive siting
Air Products (50+ countries, ~22,000 employees) faces tariff, sanction and zoning risks that can delay cryogenic equipment and gas flows; early community engagement reduces delays. National hydrogen targets (EU 10 Mt by 2030) and US incentives (IRA ~$369B, Bipartisan Infrastructure up to $8B, 45V credit up to $3/kg) drive siting and offtake. ~33% large regional contracts involve SOEs, making govt relations critical.
| Metric | Value |
|---|---|
| Countries | 50+ |
| Employees | ~22,000 |
| IRA clean spend | $369B |
| EU H2 target | 10 Mt by 2030 |
| SOE share | ~33% |
What is included in the product
 Detailed Word Document
Explores how Political, Economic, Social, Technological, Environmental and Legal forces uniquely affect Air Products & Chemicals, with data-backed subpoints and trend analysis; designed for executives and investors, it offers forward-looking insights, scenario planning inputs and ready-to-use content for reports, decks and funding discussions.

 Customizable Excel Spreadsheet
A clean, summarized PESTLE of Air Products & Chemicals that’s visually segmented for quick interpretation, easing meeting prep and slide drops. It’s editable for regional or business-line notes, making it ideal for cross-team alignment and strategic risk discussions.
Economic factors

Industrial cycle sensitivity
End-markets such as refining, metals and electronics drive Air Products base gas volumes, making merchant demand highly cyclical; recessions compress merchant volumes while long-term on-site take-or-pay contracts provide partial insulation. Price pass-through clauses in many contracts mitigate input-cost volatility, and the company’s portfolio mix balances cyclical merchant exposure with recurring on-site revenue.
Energy and feedstock costs
Electricity (~$0.075/kWh US avg 2024) and natural gas (Henry Hub ~ $3.90/MMBtu 2024) materially drive hydrogen and ASU unit economics, with feedstock often 60-70% of grey hydrogen cost. Regional spreads—sometimes >$3–5/MMBtu—determine delivered cost and margin. Hedging and long-term PPAs (often 10–20 years) lower price volatility. Siting near low-cost basins (Permian/Gulf Coast power < $0.05/kWh) preserves competitiveness.

Capital intensity and interest rates
Large-scale Air Products plants require multiyear capex with typical payback horizons of 10–20 years; higher US policy rates (Fed funds ~5.25–5.50% in 2024–25) lift WACC and can raise hurdle rates by 200–300 bps, squeezing project IRRs. Offtake-backed financing and export credit agencies (ECA support often covering up to ~70–80% of debt) de-risk funding. Phased development and modularization can cut delivery schedules and improve cash-flow timing by roughly 20–30%.

Currency fluctuations
Air Products operates in more than 50 countries, creating FX exposure across revenues, costs and capex; emerging-market currency depreciations can reduce local affordability and strain balance sheets, particularly in Latin America and parts of Asia. The company uses natural hedges and financial derivatives to mitigate volatility and increasingly prefers contracting in hard currencies where feasible to reduce translation and transaction risk.
Customer consolidation and pricing power
Customer consolidation among refiners, steelmakers and semiconductor fabs gives buyers negotiating leverage, but Air Products secures pricing stability via long-term, volume-commitment contracts and differentiated services such as onsite reliability and extensive pipeline networks that raise switching costs and support margin resilience across cycles.
- Concentrated buyers → stronger negotiation
- Long-term contracts → price stability
- Onsite services & pipelines → high switching costs
- Differentiation → margin resilience
Tariffs, sanctions and zoning threaten hydrogen projects; EU 10 Mt, US incentives drive siting
End-market cyclicality (refining, metals, electronics) drives merchant volumes while long-term on-site contracts provide insulation. Electricity (~$0.075/kWh US avg 2024) and Henry Hub (~$3.90/MMBtu 2024) heavily influence hydrogen costs. Higher rates (Fed funds ~5.25–5.50% 2024–25) raise WACC and project hurdles. Global footprint >50 countries creates FX and demand risk.
| Metric | Value |
|---|---|
| US power 2024 | $0.075/kWh |
| Henry Hub 2024 | $3.90/MMBtu |
| Fed funds | 5.25–5.50% |
| Countries | >50 |
Preview the Actual Deliverable
Air Products & Chemicals PESTLE Analysis
The preview shown here is the exact Air Products & Chemicals PESTLE Analysis you’ll receive after purchase—fully formatted and ready to use. The content, layout, and structure are identical to the downloadable file. No placeholders or teasers—this is the final, professional document you’ll own upon checkout.

Make Smarter Strategic Decisions with a Complete PESTEL View
Discover how political shifts, economic cycles, social trends, technological advances, legal changes, and environmental pressure are reshaping Air Products & Chemicals's strategic outlook in our concise PESTLE snapshot. Use these insights to anticipate risks, identify growth vectors, and sharpen investment or business decisions. Purchase the full analysis for a detailed, actionable breakdown ready for immediate use.
Political factors
Geopolitical stability and trade policy
Industrial gases rely on cross-border supply chains for equipment, feedstocks and project execution; Air Products operates in over 50 countries with roughly 22,000 employees, so tariffs, sanctions or export controls can disrupt cryogenic equipment shipments and specialty gas flows. Political volatility in energy-producing regions undermines long-term contract certainty; diversifying project locations and suppliers mitigates these risks.
Energy transition policy direction
National hydrogen strategies (EU target 10 million tonnes H2 by 2030) and decarbonization roadmaps directly shape demand for low‑carbon hydrogen and oxygen used in refining and industry. Government hub funding—US Bipartisan Infrastructure Law committing up to $8 billion—and public–private partnerships accelerate large‑scale projects. Political leadership shifts can speed or stall approvals and incentives like the 45V hydrogen tax credit (up to $3/kg), so Air Products must align projects with durable bipartisan policy support.
Subsidies and incentives competition
US IRA mobilizes roughly $369 billion in clean energy spending and offers the 45V hydrogen credit up to $3/kg, while the EU Green Deal targets 10 Mt renewable hydrogen by 2030; Asian subsidies (notably Japan and Korea) add production and CCUS support, shifting build locations for blue/green hydrogen, ammonia and CCUS. Incentive certainty dictates capital allocation and offtake pricing; subsidy races or harmonization can swing project IRRs quickly, making stable, bankable credit regimes a locational advantage.
Local permitting and community acceptance
Large Air Products plants trigger municipal zoning, public hearings and environmental justice scrutiny, especially for hydrogen and industrial gas sites in Texas and Louisiana where community concern often centers on safety and emissions; political leaders balance job creation against perceived risks. Early stakeholder engagement and community benefit agreements have proven to reduce opposition and construction delays.
- Local zoning: public hearings required
- Political trade-off: jobs vs. safety
- Mitigation: early engagement
- Tool: community benefit agreements
State-owned enterprise dynamics
In key regions Air Products often sells to state-owned refiners, petrochemical makers and power utilities, with roughly one-third of large industrial contracts in APAC and MENA involving SOEs. National mandates on fuel quality, emissions (eg China 2060 net-zero) and localization reshape pricing, offset terms and capex timing, while political priorities can postpone projects by quarters. Strong government relations materially affect project selection, permitting and execution.
- SOE share ~33% of major regional contracts
- Regulatory drivers: emissions targets, localization rules
- Govt relations = critical to schedule and margins
Tariffs, sanctions and zoning threaten hydrogen projects; EU 10 Mt, US incentives drive siting
Air Products (50+ countries, ~22,000 employees) faces tariff, sanction and zoning risks that can delay cryogenic equipment and gas flows; early community engagement reduces delays. National hydrogen targets (EU 10 Mt by 2030) and US incentives (IRA ~$369B, Bipartisan Infrastructure up to $8B, 45V credit up to $3/kg) drive siting and offtake. ~33% large regional contracts involve SOEs, making govt relations critical.
| Metric | Value |
|---|---|
| Countries | 50+ |
| Employees | ~22,000 |
| IRA clean spend | $369B |
| EU H2 target | 10 Mt by 2030 |
| SOE share | ~33% |
What is included in the product
Detailed Word Document
Explores how Political, Economic, Social, Technological, Environmental and Legal forces uniquely affect Air Products & Chemicals, with data-backed subpoints and trend analysis; designed for executives and investors, it offers forward-looking insights, scenario planning inputs and ready-to-use content for reports, decks and funding discussions.
Customizable Excel Spreadsheet
A clean, summarized PESTLE of Air Products & Chemicals that’s visually segmented for quick interpretation, easing meeting prep and slide drops. It’s editable for regional or business-line notes, making it ideal for cross-team alignment and strategic risk discussions.
Economic factors
Industrial cycle sensitivity
End-markets such as refining, metals and electronics drive Air Products base gas volumes, making merchant demand highly cyclical; recessions compress merchant volumes while long-term on-site take-or-pay contracts provide partial insulation. Price pass-through clauses in many contracts mitigate input-cost volatility, and the company’s portfolio mix balances cyclical merchant exposure with recurring on-site revenue.
Energy and feedstock costs
Electricity (~$0.075/kWh US avg 2024) and natural gas (Henry Hub ~ $3.90/MMBtu 2024) materially drive hydrogen and ASU unit economics, with feedstock often 60-70% of grey hydrogen cost. Regional spreads—sometimes >$3–5/MMBtu—determine delivered cost and margin. Hedging and long-term PPAs (often 10–20 years) lower price volatility. Siting near low-cost basins (Permian/Gulf Coast power < $0.05/kWh) preserves competitiveness.
Capital intensity and interest rates
Large-scale Air Products plants require multiyear capex with typical payback horizons of 10–20 years; higher US policy rates (Fed funds ~5.25–5.50% in 2024–25) lift WACC and can raise hurdle rates by 200–300 bps, squeezing project IRRs. Offtake-backed financing and export credit agencies (ECA support often covering up to ~70–80% of debt) de-risk funding. Phased development and modularization can cut delivery schedules and improve cash-flow timing by roughly 20–30%.
Currency fluctuations
Air Products operates in more than 50 countries, creating FX exposure across revenues, costs and capex; emerging-market currency depreciations can reduce local affordability and strain balance sheets, particularly in Latin America and parts of Asia. The company uses natural hedges and financial derivatives to mitigate volatility and increasingly prefers contracting in hard currencies where feasible to reduce translation and transaction risk.
Customer consolidation and pricing power
Customer consolidation among refiners, steelmakers and semiconductor fabs gives buyers negotiating leverage, but Air Products secures pricing stability via long-term, volume-commitment contracts and differentiated services such as onsite reliability and extensive pipeline networks that raise switching costs and support margin resilience across cycles.
- Concentrated buyers → stronger negotiation
- Long-term contracts → price stability
- Onsite services & pipelines → high switching costs
- Differentiation → margin resilience
Tariffs, sanctions and zoning threaten hydrogen projects; EU 10 Mt, US incentives drive siting
End-market cyclicality (refining, metals, electronics) drives merchant volumes while long-term on-site contracts provide insulation. Electricity (~$0.075/kWh US avg 2024) and Henry Hub (~$3.90/MMBtu 2024) heavily influence hydrogen costs. Higher rates (Fed funds ~5.25–5.50% 2024–25) raise WACC and project hurdles. Global footprint >50 countries creates FX and demand risk.
| Metric | Value |
|---|---|
| US power 2024 | $0.075/kWh |
| Henry Hub 2024 | $3.90/MMBtu |
| Fed funds | 5.25–5.50% |
| Countries | >50 |
Preview the Actual Deliverable
Air Products & Chemicals PESTLE Analysis
The preview shown here is the exact Air Products & Chemicals PESTLE Analysis you’ll receive after purchase—fully formatted and ready to use. The content, layout, and structure are identical to the downloadable file. No placeholders or teasers—this is the final, professional document you’ll own upon checkout.
Original: $10.00
-65%$10.00
$3.50Description
Make Smarter Strategic Decisions with a Complete PESTEL View
Discover how political shifts, economic cycles, social trends, technological advances, legal changes, and environmental pressure are reshaping Air Products & Chemicals's strategic outlook in our concise PESTLE snapshot. Use these insights to anticipate risks, identify growth vectors, and sharpen investment or business decisions. Purchase the full analysis for a detailed, actionable breakdown ready for immediate use.
Political factors
Geopolitical stability and trade policy
Industrial gases rely on cross-border supply chains for equipment, feedstocks and project execution; Air Products operates in over 50 countries with roughly 22,000 employees, so tariffs, sanctions or export controls can disrupt cryogenic equipment shipments and specialty gas flows. Political volatility in energy-producing regions undermines long-term contract certainty; diversifying project locations and suppliers mitigates these risks.
Energy transition policy direction
National hydrogen strategies (EU target 10 million tonnes H2 by 2030) and decarbonization roadmaps directly shape demand for low‑carbon hydrogen and oxygen used in refining and industry. Government hub funding—US Bipartisan Infrastructure Law committing up to $8 billion—and public–private partnerships accelerate large‑scale projects. Political leadership shifts can speed or stall approvals and incentives like the 45V hydrogen tax credit (up to $3/kg), so Air Products must align projects with durable bipartisan policy support.
Subsidies and incentives competition
US IRA mobilizes roughly $369 billion in clean energy spending and offers the 45V hydrogen credit up to $3/kg, while the EU Green Deal targets 10 Mt renewable hydrogen by 2030; Asian subsidies (notably Japan and Korea) add production and CCUS support, shifting build locations for blue/green hydrogen, ammonia and CCUS. Incentive certainty dictates capital allocation and offtake pricing; subsidy races or harmonization can swing project IRRs quickly, making stable, bankable credit regimes a locational advantage.
Local permitting and community acceptance
Large Air Products plants trigger municipal zoning, public hearings and environmental justice scrutiny, especially for hydrogen and industrial gas sites in Texas and Louisiana where community concern often centers on safety and emissions; political leaders balance job creation against perceived risks. Early stakeholder engagement and community benefit agreements have proven to reduce opposition and construction delays.
- Local zoning: public hearings required
- Political trade-off: jobs vs. safety
- Mitigation: early engagement
- Tool: community benefit agreements
State-owned enterprise dynamics
In key regions Air Products often sells to state-owned refiners, petrochemical makers and power utilities, with roughly one-third of large industrial contracts in APAC and MENA involving SOEs. National mandates on fuel quality, emissions (eg China 2060 net-zero) and localization reshape pricing, offset terms and capex timing, while political priorities can postpone projects by quarters. Strong government relations materially affect project selection, permitting and execution.
- SOE share ~33% of major regional contracts
- Regulatory drivers: emissions targets, localization rules
- Govt relations = critical to schedule and margins
Tariffs, sanctions and zoning threaten hydrogen projects; EU 10 Mt, US incentives drive siting
Air Products (50+ countries, ~22,000 employees) faces tariff, sanction and zoning risks that can delay cryogenic equipment and gas flows; early community engagement reduces delays. National hydrogen targets (EU 10 Mt by 2030) and US incentives (IRA ~$369B, Bipartisan Infrastructure up to $8B, 45V credit up to $3/kg) drive siting and offtake. ~33% large regional contracts involve SOEs, making govt relations critical.
| Metric | Value |
|---|---|
| Countries | 50+ |
| Employees | ~22,000 |
| IRA clean spend | $369B |
| EU H2 target | 10 Mt by 2030 |
| SOE share | ~33% |
What is included in the product
Detailed Word Document
Explores how Political, Economic, Social, Technological, Environmental and Legal forces uniquely affect Air Products & Chemicals, with data-backed subpoints and trend analysis; designed for executives and investors, it offers forward-looking insights, scenario planning inputs and ready-to-use content for reports, decks and funding discussions.
Customizable Excel Spreadsheet
A clean, summarized PESTLE of Air Products & Chemicals that’s visually segmented for quick interpretation, easing meeting prep and slide drops. It’s editable for regional or business-line notes, making it ideal for cross-team alignment and strategic risk discussions.
Economic factors
Industrial cycle sensitivity
End-markets such as refining, metals and electronics drive Air Products base gas volumes, making merchant demand highly cyclical; recessions compress merchant volumes while long-term on-site take-or-pay contracts provide partial insulation. Price pass-through clauses in many contracts mitigate input-cost volatility, and the company’s portfolio mix balances cyclical merchant exposure with recurring on-site revenue.
Energy and feedstock costs
Electricity (~$0.075/kWh US avg 2024) and natural gas (Henry Hub ~ $3.90/MMBtu 2024) materially drive hydrogen and ASU unit economics, with feedstock often 60-70% of grey hydrogen cost. Regional spreads—sometimes >$3–5/MMBtu—determine delivered cost and margin. Hedging and long-term PPAs (often 10–20 years) lower price volatility. Siting near low-cost basins (Permian/Gulf Coast power < $0.05/kWh) preserves competitiveness.
Capital intensity and interest rates
Large-scale Air Products plants require multiyear capex with typical payback horizons of 10–20 years; higher US policy rates (Fed funds ~5.25–5.50% in 2024–25) lift WACC and can raise hurdle rates by 200–300 bps, squeezing project IRRs. Offtake-backed financing and export credit agencies (ECA support often covering up to ~70–80% of debt) de-risk funding. Phased development and modularization can cut delivery schedules and improve cash-flow timing by roughly 20–30%.
Currency fluctuations
Air Products operates in more than 50 countries, creating FX exposure across revenues, costs and capex; emerging-market currency depreciations can reduce local affordability and strain balance sheets, particularly in Latin America and parts of Asia. The company uses natural hedges and financial derivatives to mitigate volatility and increasingly prefers contracting in hard currencies where feasible to reduce translation and transaction risk.
Customer consolidation and pricing power
Customer consolidation among refiners, steelmakers and semiconductor fabs gives buyers negotiating leverage, but Air Products secures pricing stability via long-term, volume-commitment contracts and differentiated services such as onsite reliability and extensive pipeline networks that raise switching costs and support margin resilience across cycles.
- Concentrated buyers → stronger negotiation
- Long-term contracts → price stability
- Onsite services & pipelines → high switching costs
- Differentiation → margin resilience
Tariffs, sanctions and zoning threaten hydrogen projects; EU 10 Mt, US incentives drive siting
End-market cyclicality (refining, metals, electronics) drives merchant volumes while long-term on-site contracts provide insulation. Electricity (~$0.075/kWh US avg 2024) and Henry Hub (~$3.90/MMBtu 2024) heavily influence hydrogen costs. Higher rates (Fed funds ~5.25–5.50% 2024–25) raise WACC and project hurdles. Global footprint >50 countries creates FX and demand risk.
| Metric | Value |
|---|---|
| US power 2024 | $0.075/kWh |
| Henry Hub 2024 | $3.90/MMBtu |
| Fed funds | 5.25–5.50% |
| Countries | >50 |
Preview the Actual Deliverable
Air Products & Chemicals PESTLE Analysis
The preview shown here is the exact Air Products & Chemicals PESTLE Analysis you’ll receive after purchase—fully formatted and ready to use. The content, layout, and structure are identical to the downloadable file. No placeholders or teasers—this is the final, professional document you’ll own upon checkout.











