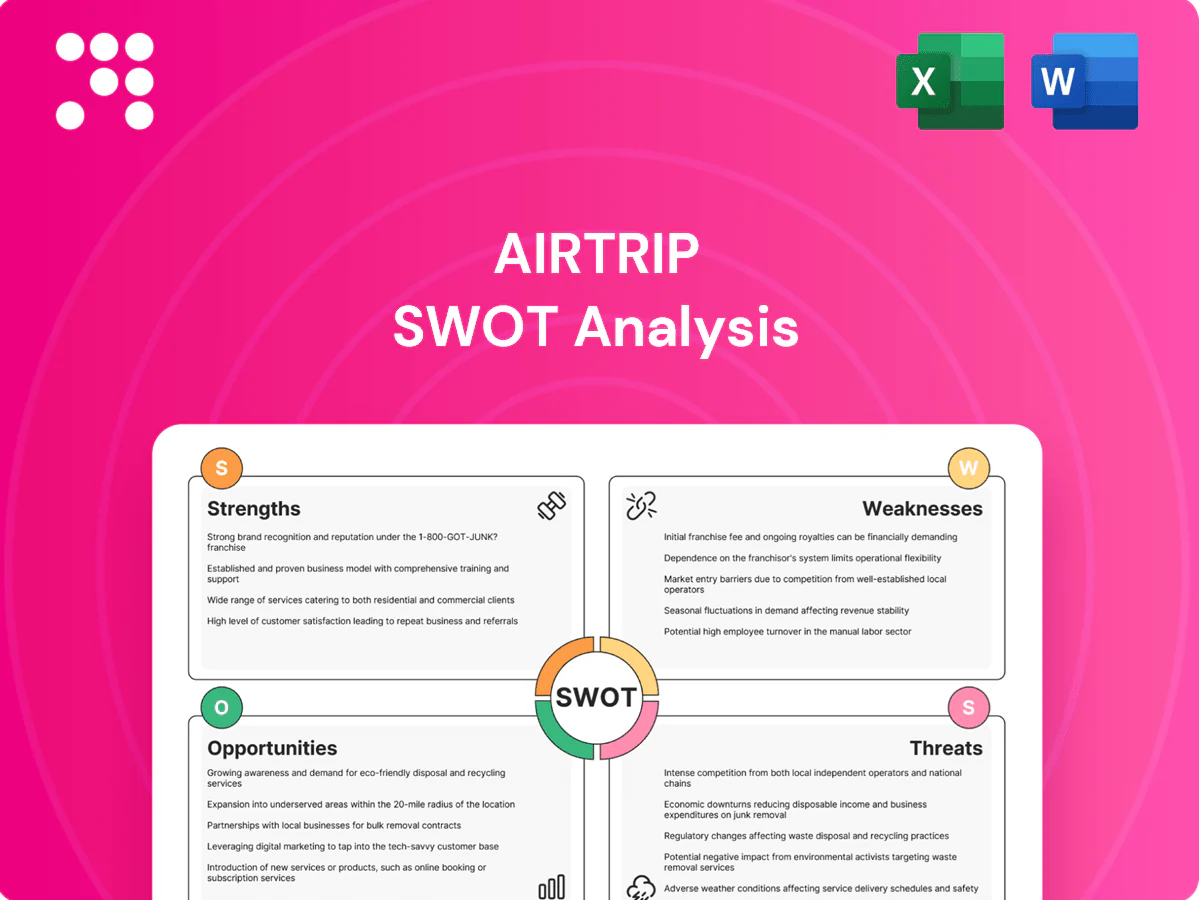
AirTrip SWOT Analysis

Make Insightful Decisions Backed by Expert Research
AirTrip’s SWOT highlights a nimble route network, strong digital booking platform, and brand recognition, balanced against cost pressures and regulatory risks; opportunities include regional expansion and partnerships while competition and fuel volatility pose threats. Want deeper, research-backed strategic insights? Purchase the full SWOT analysis for a professionally formatted Word report and editable Excel matrix to plan, pitch, or invest with confidence.
Strengths

End-to-end travel platform
Offering flights, hotels and package tours on one platform reduces user friction and increases basket size, with global online travel gross bookings topping US$1 trillion in 2024. A unified funnel enables cross-selling and higher conversion rates by keeping users in-platform. Consistent branding and CX improve retention and lifetime value. This breadth widens addressable revenue streams across transport, lodging and packages.
Seamless web and mobile UX
AirTrip’s polished web and mobile UX accelerates discovery, reduces booking time and simplifies post-booking management, aligning with Phocuswright 2024 data showing roughly 60% of online travel bookings occur on mobile. Superior UX drives higher retention and repeat purchases, with app-led engagement commonly improving retention by around 20%. Capturing on-the-go and last-minute demand—about half of last-minute bookings via mobile—supports up to ~25% higher customer lifetime value.

Diversified into IT media and solutions
AirTrip’s diversification into IT, media and solutions reduces travel-driven seasonality by creating steady non-ticket revenue streams and spreads demand risk across cycles. Shared technology, data platforms and engineering talent increase reuse and speed feature delivery. Cross-division synergies lower marginal cost per feature and serve as a strategic hedge, enhancing resilience during downturns.

Data and personalization potential
Booking data across flights, hotels and ancillaries enables real-time recommendations and dynamic pricing, turning cross-product signals into incremental revenue streams.
McKinsey finds personalization can drive 10–15% revenue uplift and 10–30% higher marketing ROI, lifting conversion and ancillary attach rates when offers match user context.
Better targeting reduces acquisition costs and fast data feedback loops improve product-market fit through continuous A/B learning.
- data-driven dynamic pricing
- 10–15% revenue uplift (McKinsey)
- higher ancillary attach via personalization
- lower acquisition costs via targeting
Partner ecosystem leverage
AirTrip leverages deep relationships with airlines, hotels and tour operators to broaden inventory and access exclusive packages, improving availability and price competitiveness for customers. Co-marketing with partners reduces customer acquisition costs and extends reach into partner customer bases. Exclusive bundled offerings from partners enhance differentiation and margin potential.
- Relationships: expanded inventory and exclusive packages
- Supply: better availability and pricing
- Co-marketing: lower CAC, wider reach
Mobile apps and personalization drive growth in US$1.0T travel market
Integrated flights, hotels and packages reduce friction and boost basket size; global online travel GMV ~US$1.0T (2024). Mobile-first UX captures ~60% of bookings (Phocuswright 2024) and app-led retention ~+20%. Data-driven personalization lifts revenue 10–15% (McKinsey) and dynamic pricing improves yield; partner exclusives lower CAC and widen inventory.
| Metric | Value |
|---|---|
| Global online travel GMV (2024) | US$1.0T |
| Mobile share (2024) | ~60% |
| Personalization uplift | 10–15% |
| App retention lift | ~+20% |
What is included in the product
 Detailed Word Document
Provides a concise SWOT overview of AirTrip’s internal capabilities and external market forces, highlighting strengths, weaknesses, growth opportunities, and competitive threats that shape strategic decisions.

 Customizable Excel Spreadsheet
Provides a concise, presentation-ready SWOT matrix for AirTrip that quickly exposes strategic pain points and prioritizes actionable fixes; editable format enables fast updates and seamless integration into reports and stakeholder briefings.
Weaknesses

Exposure to travel cyclicality
Revenue is highly sensitive to macro shocks: IATA RPKs plunged about 65% in 2020 and only recovered to roughly 88% of 2019 levels by 2023, while UNWTO reports international arrivals reached about 87% of 2019 in 2023. Demand volatility complicates forecasting and capacity planning, and fixed tech and support costs can compress margins during downturns. Recovery has been uneven, with business travel lagging leisure.
Margin pressure in OTA model
Commissions in the OTA model are structurally thin—hotel commission rates commonly sit around 15–20% while airline agency fees are often single-digit—leaving little room for margin. Suppliers increasingly drive direct-booking strategies and loyalty programs, diverting volume away from intermediaries and raising customer-acquisition costs. Heavy discounting and promotional spend erode unit economics, so scaling profitably requires strict cost control across marketing, tech and operations.

High customer acquisition costs
Performance marketing in travel is expensive and crowded, with CAC often exceeding $150 per booking and top OTAs spending heavily—Expedia Group reported about $3.9 billion in marketing and sales expense in 2023—while bidding wars on search and apps push CPCs and auction prices higher. Heavy reliance on paid channels increases revenue volatility, and weak loyalty mechanisms shorten payback periods, raising marginal unit economics risk.

Complex tech upkeep
Maintaining integrations with dozens to hundreds of suppliers is resource-intensive, with legacy connections and brittle APIs increasing incident rates and maintenance costs; continuous compliance, security patches and mobile OS updates further strain engineering capacity, and accumulated tech debt has been shown to materially slow feature velocity in travel platforms.
- Dozens–hundreds of suppliers
- Brittle legacy APIs
- Ongoing compliance/security burden
- Tech debt reduces velocity
Fragmented brand awareness
Competing against global OTAs makes differentiation hard: Booking Holdings and Expedia Group together captured roughly two-thirds of global OTA bookings in 2024, squeezing smaller brands. Limited brand recognition reduces direct-traffic share and increases reliance on costly paid channels. Consumers often view offerings as commoditized, weakening pricing power and repeat-booking loyalty.
- Low brand recall vs 66% market leaders
- Higher CAC, lower direct traffic
- Compressed margins and weaker retention
Cyclical travel demand, thin OTA margins and concentrated market squeeze profits
Revenue and bookings remain highly cyclical (IATA RPKs ~88% of 2019 in 2023), compressing margins in downturns. OTA commissions are thin (hotel 15–20%, airline single-digit) while CAC often exceeds $150. Market share concentrated (Booking+Expedia ~66% in 2024) limits pricing power and direct traffic.
| Metric | Value |
|---|---|
| IATA RPKs (2023) | ~88% |
| CAC | >$150 |
| Market share (2024) | Booking+Expedia ~66% |
Preview the Actual Deliverable
AirTrip SWOT Analysis
This is the actual AirTrip SWOT analysis document you’ll receive upon purchase—no surprises, just professional quality. The preview below is taken directly from the full report and reflects the same structured, editable content. Buy now to unlock the complete, in-depth version immediately after checkout.

Make Insightful Decisions Backed by Expert Research
AirTrip’s SWOT highlights a nimble route network, strong digital booking platform, and brand recognition, balanced against cost pressures and regulatory risks; opportunities include regional expansion and partnerships while competition and fuel volatility pose threats. Want deeper, research-backed strategic insights? Purchase the full SWOT analysis for a professionally formatted Word report and editable Excel matrix to plan, pitch, or invest with confidence.
Strengths
End-to-end travel platform
Offering flights, hotels and package tours on one platform reduces user friction and increases basket size, with global online travel gross bookings topping US$1 trillion in 2024. A unified funnel enables cross-selling and higher conversion rates by keeping users in-platform. Consistent branding and CX improve retention and lifetime value. This breadth widens addressable revenue streams across transport, lodging and packages.
Seamless web and mobile UX
AirTrip’s polished web and mobile UX accelerates discovery, reduces booking time and simplifies post-booking management, aligning with Phocuswright 2024 data showing roughly 60% of online travel bookings occur on mobile. Superior UX drives higher retention and repeat purchases, with app-led engagement commonly improving retention by around 20%. Capturing on-the-go and last-minute demand—about half of last-minute bookings via mobile—supports up to ~25% higher customer lifetime value.
Diversified into IT media and solutions
AirTrip’s diversification into IT, media and solutions reduces travel-driven seasonality by creating steady non-ticket revenue streams and spreads demand risk across cycles. Shared technology, data platforms and engineering talent increase reuse and speed feature delivery. Cross-division synergies lower marginal cost per feature and serve as a strategic hedge, enhancing resilience during downturns.
Data and personalization potential
Booking data across flights, hotels and ancillaries enables real-time recommendations and dynamic pricing, turning cross-product signals into incremental revenue streams.
McKinsey finds personalization can drive 10–15% revenue uplift and 10–30% higher marketing ROI, lifting conversion and ancillary attach rates when offers match user context.
Better targeting reduces acquisition costs and fast data feedback loops improve product-market fit through continuous A/B learning.
- data-driven dynamic pricing
- 10–15% revenue uplift (McKinsey)
- higher ancillary attach via personalization
- lower acquisition costs via targeting
Partner ecosystem leverage
AirTrip leverages deep relationships with airlines, hotels and tour operators to broaden inventory and access exclusive packages, improving availability and price competitiveness for customers. Co-marketing with partners reduces customer acquisition costs and extends reach into partner customer bases. Exclusive bundled offerings from partners enhance differentiation and margin potential.
- Relationships: expanded inventory and exclusive packages
- Supply: better availability and pricing
- Co-marketing: lower CAC, wider reach
Mobile apps and personalization drive growth in US$1.0T travel market
Integrated flights, hotels and packages reduce friction and boost basket size; global online travel GMV ~US$1.0T (2024). Mobile-first UX captures ~60% of bookings (Phocuswright 2024) and app-led retention ~+20%. Data-driven personalization lifts revenue 10–15% (McKinsey) and dynamic pricing improves yield; partner exclusives lower CAC and widen inventory.
| Metric | Value |
|---|---|
| Global online travel GMV (2024) | US$1.0T |
| Mobile share (2024) | ~60% |
| Personalization uplift | 10–15% |
| App retention lift | ~+20% |
What is included in the product
Detailed Word Document
Provides a concise SWOT overview of AirTrip’s internal capabilities and external market forces, highlighting strengths, weaknesses, growth opportunities, and competitive threats that shape strategic decisions.
Customizable Excel Spreadsheet
Provides a concise, presentation-ready SWOT matrix for AirTrip that quickly exposes strategic pain points and prioritizes actionable fixes; editable format enables fast updates and seamless integration into reports and stakeholder briefings.
Weaknesses
Exposure to travel cyclicality
Revenue is highly sensitive to macro shocks: IATA RPKs plunged about 65% in 2020 and only recovered to roughly 88% of 2019 levels by 2023, while UNWTO reports international arrivals reached about 87% of 2019 in 2023. Demand volatility complicates forecasting and capacity planning, and fixed tech and support costs can compress margins during downturns. Recovery has been uneven, with business travel lagging leisure.
Margin pressure in OTA model
Commissions in the OTA model are structurally thin—hotel commission rates commonly sit around 15–20% while airline agency fees are often single-digit—leaving little room for margin. Suppliers increasingly drive direct-booking strategies and loyalty programs, diverting volume away from intermediaries and raising customer-acquisition costs. Heavy discounting and promotional spend erode unit economics, so scaling profitably requires strict cost control across marketing, tech and operations.
High customer acquisition costs
Performance marketing in travel is expensive and crowded, with CAC often exceeding $150 per booking and top OTAs spending heavily—Expedia Group reported about $3.9 billion in marketing and sales expense in 2023—while bidding wars on search and apps push CPCs and auction prices higher. Heavy reliance on paid channels increases revenue volatility, and weak loyalty mechanisms shorten payback periods, raising marginal unit economics risk.
Complex tech upkeep
Maintaining integrations with dozens to hundreds of suppliers is resource-intensive, with legacy connections and brittle APIs increasing incident rates and maintenance costs; continuous compliance, security patches and mobile OS updates further strain engineering capacity, and accumulated tech debt has been shown to materially slow feature velocity in travel platforms.
- Dozens–hundreds of suppliers
- Brittle legacy APIs
- Ongoing compliance/security burden
- Tech debt reduces velocity
Fragmented brand awareness
Competing against global OTAs makes differentiation hard: Booking Holdings and Expedia Group together captured roughly two-thirds of global OTA bookings in 2024, squeezing smaller brands. Limited brand recognition reduces direct-traffic share and increases reliance on costly paid channels. Consumers often view offerings as commoditized, weakening pricing power and repeat-booking loyalty.
- Low brand recall vs 66% market leaders
- Higher CAC, lower direct traffic
- Compressed margins and weaker retention
Cyclical travel demand, thin OTA margins and concentrated market squeeze profits
Revenue and bookings remain highly cyclical (IATA RPKs ~88% of 2019 in 2023), compressing margins in downturns. OTA commissions are thin (hotel 15–20%, airline single-digit) while CAC often exceeds $150. Market share concentrated (Booking+Expedia ~66% in 2024) limits pricing power and direct traffic.
| Metric | Value |
|---|---|
| IATA RPKs (2023) | ~88% |
| CAC | >$150 |
| Market share (2024) | Booking+Expedia ~66% |
Preview the Actual Deliverable
AirTrip SWOT Analysis
This is the actual AirTrip SWOT analysis document you’ll receive upon purchase—no surprises, just professional quality. The preview below is taken directly from the full report and reflects the same structured, editable content. Buy now to unlock the complete, in-depth version immediately after checkout.
Original: $10.00
-65%$10.00
$3.50Description
Make Insightful Decisions Backed by Expert Research
AirTrip’s SWOT highlights a nimble route network, strong digital booking platform, and brand recognition, balanced against cost pressures and regulatory risks; opportunities include regional expansion and partnerships while competition and fuel volatility pose threats. Want deeper, research-backed strategic insights? Purchase the full SWOT analysis for a professionally formatted Word report and editable Excel matrix to plan, pitch, or invest with confidence.
Strengths
End-to-end travel platform
Offering flights, hotels and package tours on one platform reduces user friction and increases basket size, with global online travel gross bookings topping US$1 trillion in 2024. A unified funnel enables cross-selling and higher conversion rates by keeping users in-platform. Consistent branding and CX improve retention and lifetime value. This breadth widens addressable revenue streams across transport, lodging and packages.
Seamless web and mobile UX
AirTrip’s polished web and mobile UX accelerates discovery, reduces booking time and simplifies post-booking management, aligning with Phocuswright 2024 data showing roughly 60% of online travel bookings occur on mobile. Superior UX drives higher retention and repeat purchases, with app-led engagement commonly improving retention by around 20%. Capturing on-the-go and last-minute demand—about half of last-minute bookings via mobile—supports up to ~25% higher customer lifetime value.
Diversified into IT media and solutions
AirTrip’s diversification into IT, media and solutions reduces travel-driven seasonality by creating steady non-ticket revenue streams and spreads demand risk across cycles. Shared technology, data platforms and engineering talent increase reuse and speed feature delivery. Cross-division synergies lower marginal cost per feature and serve as a strategic hedge, enhancing resilience during downturns.
Data and personalization potential
Booking data across flights, hotels and ancillaries enables real-time recommendations and dynamic pricing, turning cross-product signals into incremental revenue streams.
McKinsey finds personalization can drive 10–15% revenue uplift and 10–30% higher marketing ROI, lifting conversion and ancillary attach rates when offers match user context.
Better targeting reduces acquisition costs and fast data feedback loops improve product-market fit through continuous A/B learning.
- data-driven dynamic pricing
- 10–15% revenue uplift (McKinsey)
- higher ancillary attach via personalization
- lower acquisition costs via targeting
Partner ecosystem leverage
AirTrip leverages deep relationships with airlines, hotels and tour operators to broaden inventory and access exclusive packages, improving availability and price competitiveness for customers. Co-marketing with partners reduces customer acquisition costs and extends reach into partner customer bases. Exclusive bundled offerings from partners enhance differentiation and margin potential.
- Relationships: expanded inventory and exclusive packages
- Supply: better availability and pricing
- Co-marketing: lower CAC, wider reach
Mobile apps and personalization drive growth in US$1.0T travel market
Integrated flights, hotels and packages reduce friction and boost basket size; global online travel GMV ~US$1.0T (2024). Mobile-first UX captures ~60% of bookings (Phocuswright 2024) and app-led retention ~+20%. Data-driven personalization lifts revenue 10–15% (McKinsey) and dynamic pricing improves yield; partner exclusives lower CAC and widen inventory.
| Metric | Value |
|---|---|
| Global online travel GMV (2024) | US$1.0T |
| Mobile share (2024) | ~60% |
| Personalization uplift | 10–15% |
| App retention lift | ~+20% |
What is included in the product
Detailed Word Document
Provides a concise SWOT overview of AirTrip’s internal capabilities and external market forces, highlighting strengths, weaknesses, growth opportunities, and competitive threats that shape strategic decisions.
Customizable Excel Spreadsheet
Provides a concise, presentation-ready SWOT matrix for AirTrip that quickly exposes strategic pain points and prioritizes actionable fixes; editable format enables fast updates and seamless integration into reports and stakeholder briefings.
Weaknesses
Exposure to travel cyclicality
Revenue is highly sensitive to macro shocks: IATA RPKs plunged about 65% in 2020 and only recovered to roughly 88% of 2019 levels by 2023, while UNWTO reports international arrivals reached about 87% of 2019 in 2023. Demand volatility complicates forecasting and capacity planning, and fixed tech and support costs can compress margins during downturns. Recovery has been uneven, with business travel lagging leisure.
Margin pressure in OTA model
Commissions in the OTA model are structurally thin—hotel commission rates commonly sit around 15–20% while airline agency fees are often single-digit—leaving little room for margin. Suppliers increasingly drive direct-booking strategies and loyalty programs, diverting volume away from intermediaries and raising customer-acquisition costs. Heavy discounting and promotional spend erode unit economics, so scaling profitably requires strict cost control across marketing, tech and operations.
High customer acquisition costs
Performance marketing in travel is expensive and crowded, with CAC often exceeding $150 per booking and top OTAs spending heavily—Expedia Group reported about $3.9 billion in marketing and sales expense in 2023—while bidding wars on search and apps push CPCs and auction prices higher. Heavy reliance on paid channels increases revenue volatility, and weak loyalty mechanisms shorten payback periods, raising marginal unit economics risk.
Complex tech upkeep
Maintaining integrations with dozens to hundreds of suppliers is resource-intensive, with legacy connections and brittle APIs increasing incident rates and maintenance costs; continuous compliance, security patches and mobile OS updates further strain engineering capacity, and accumulated tech debt has been shown to materially slow feature velocity in travel platforms.
- Dozens–hundreds of suppliers
- Brittle legacy APIs
- Ongoing compliance/security burden
- Tech debt reduces velocity
Fragmented brand awareness
Competing against global OTAs makes differentiation hard: Booking Holdings and Expedia Group together captured roughly two-thirds of global OTA bookings in 2024, squeezing smaller brands. Limited brand recognition reduces direct-traffic share and increases reliance on costly paid channels. Consumers often view offerings as commoditized, weakening pricing power and repeat-booking loyalty.
- Low brand recall vs 66% market leaders
- Higher CAC, lower direct traffic
- Compressed margins and weaker retention
Cyclical travel demand, thin OTA margins and concentrated market squeeze profits
Revenue and bookings remain highly cyclical (IATA RPKs ~88% of 2019 in 2023), compressing margins in downturns. OTA commissions are thin (hotel 15–20%, airline single-digit) while CAC often exceeds $150. Market share concentrated (Booking+Expedia ~66% in 2024) limits pricing power and direct traffic.
| Metric | Value |
|---|---|
| IATA RPKs (2023) | ~88% |
| CAC | >$150 |
| Market share (2024) | Booking+Expedia ~66% |
Preview the Actual Deliverable
AirTrip SWOT Analysis
This is the actual AirTrip SWOT analysis document you’ll receive upon purchase—no surprises, just professional quality. The preview below is taken directly from the full report and reflects the same structured, editable content. Buy now to unlock the complete, in-depth version immediately after checkout.











