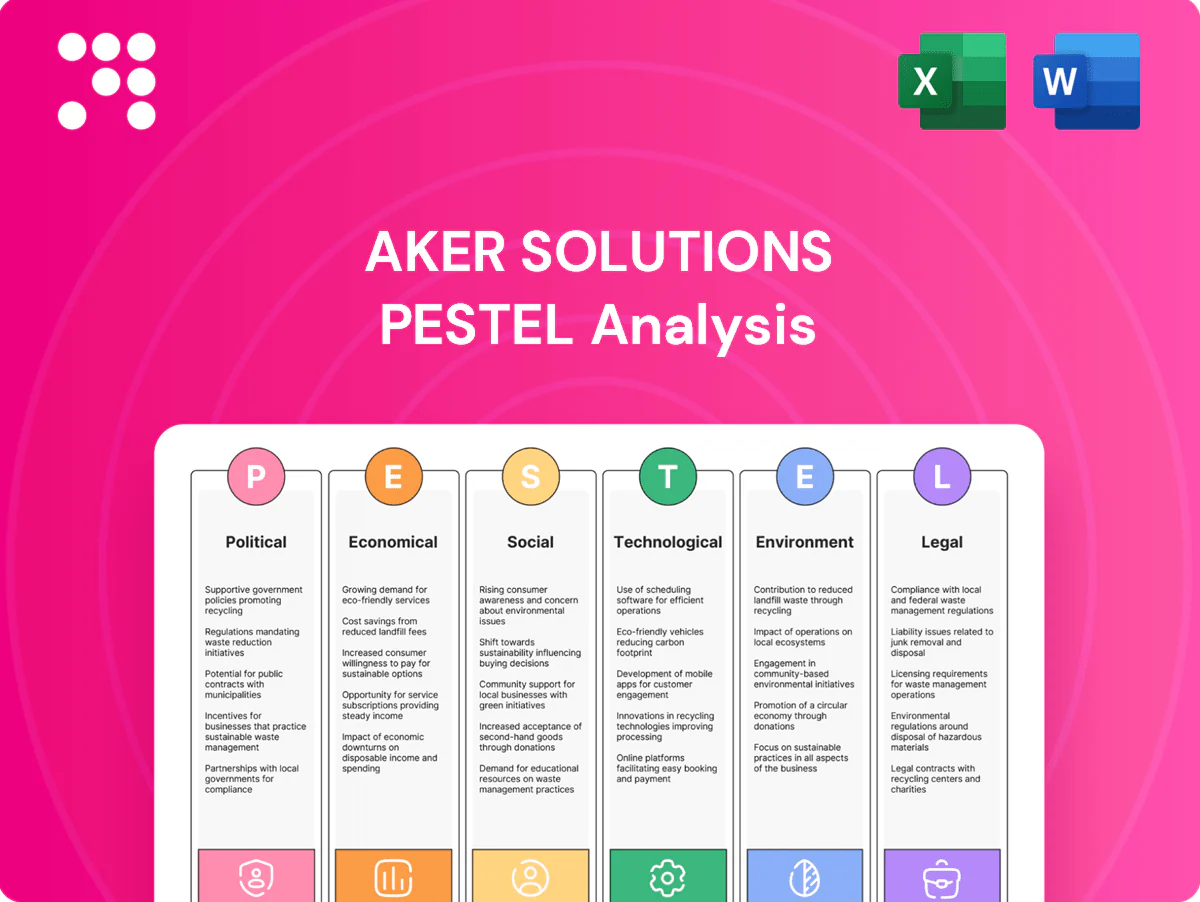
Aker Solutions PESTLE Analysis

Plan Smarter. Present Sharper. Compete Stronger.
Aker Solutions PESTLE snapshot reveals how regulation shifts, the energy transition, and supply-chain pressures are shaping strategic choices. This concise overview highlights key risks and growth levers for investors and advisors. Buy the full PESTLE to access detailed, downloadable analysis and ready-to-use insights.
Political factors

Energy policy and transition targets
Aker Solutions’ project pipeline is shaped by national energy strategies and net-zero roadmaps; Norway targets 50–55% emissions cuts by 2030, the EU -55% by 2030 and the UK/US maintain net‑zero by 2050 frameworks. Supportive policies for CCS, hydrogen and offshore wind in Norway, UK, EU and the US (IRA ~USD 369bn clean energy provisions) can accelerate awards. Shifts in subsidies or tax regimes can delay FIDs or reprioritise oil & gas versus low‑carbon projects. Active policy monitoring and advocacy align offerings with funded programmes.
Geopolitical stability and sanctions
Aker Solutions' operations and sourcing across the North Sea, Brazil, the Gulf and emerging basins are exposed to geopolitical risk, with sanctions since 2022 (notably against Russia) constraining bidding and supplier options.
Sanctions on specific regions, entities and technologies reduce available partners and can force contract exclusions or re-pricing.
Conflict-driven logistics disruptions increase shipping and EPC delivery timelines and costs, especially for modular deliveries.
Diversified market exposure and robust trade-compliance processes mitigate concentration and sanction-related risks.

Local content and industrial policy
Many jurisdictions mandate local content and in‑country value for EPC and subsea packages, with thresholds commonly set between 30% and 60%, forcing Aker Solutions to adapt partner selection, fabrication sites and cost structure. Meeting these thresholds can be decisive for bid eligibility and scoring, while well‑planned localization unlocks contract wins, builds stakeholder goodwill and secures longer‑term market access.

Permitting and stakeholder approvals
Project timing for Aker Solutions hinges on environmental permits, maritime consents and community sign-offs; EIAs commonly take 6–24 months, and lengthy approvals can shift execution windows and resource allocation. Early stakeholder engagement and robust impact assessments reduce denial/delay risk, while streamlined permitting for renewables and CCS is creating competitive openings.
- Permitting timelines: EIAs 6–24 months
- Risk: approvals drive major schedule variance
- Mitigation: early engagement + impact studies
- Opportunity: streamlined renewables/CCS permitting
Public procurement and state clients
State-backed operators and agencies are key clients for offshore and low-carbon projects, with national oil companies holding roughly 80% of global proved oil reserves, shaping demand and contract size. Tender rules, transparency requirements and political cycles drive award cadence and timing. Budget reallocations can re-sequence exploration, retrofit and decarbonization programs. Strong compliance and government relations materially boost tender success.
- State clients drive large-ticket offshore awards
- Tender transparency and political cycles affect timing
- Budget shifts reorder project sequencing
- Compliance/government relations raise win rates
Political risk reshapes offshore energy awards: net-zero targets, IRA, sanctions, local content
Political risk shapes Aker Solutions: national net‑zero targets (Norway 50–55% by 2030; EU −55% by 2030; UK/US net‑zero by 2050) and support (US IRA ~USD 369bn) drive CCS/hydrogen/offshore awards; sanctions since 2022 and state‑owned operators (≈80% of proved reserves) affect bidding; local content (30–60%) and EIAs (6–24 months) determine eligibility and timing.
| Factor | Metric | Impact |
|---|---|---|
| Net‑zero targets | Norway 50–55%/2030; EU −55%/2030 | Market shift to low‑carbon |
| IRA | ~USD 369bn | Increases US awards |
| State reserves | ≈80% proved reserves | Large state tenders |
| Local content | 30–60% | Bid eligibility |
| EIAs | 6–24 months | Schedule variance |
| Sanctions | Since 2022 | Limits partners |
What is included in the product
 Detailed Word Document
Explores how macro-environmental forces uniquely affect Aker Solutions across six dimensions—Political, Economic, Social, Technological, Environmental, and Legal—linking each to industry-specific data and regional dynamics. Designed for executives and investors, it offers actionable, forward-looking insights and detailed sub-points to support strategy, risk mitigation, and investor communication.

 Customizable Excel Spreadsheet
Condensed PESTLE of Aker Solutions, visually segmented for quick interpretation and easily editable so teams can annotate region- or business-specific risks, share in slides or reports, and accelerate alignment on external threats and strategic positioning during planning sessions.
Economic factors

Hydrocarbon price and investment cycles
Brent crude averaged about 86 USD/barrel in 2024 and remained in the 80–90 USD range in H1 2025, driving a recovery in E&P capex—global upstream investment rose toward roughly 350 billion USD in 2024—supporting higher demand for brownfield optimization and long-cycle subsea/topside projects that benefit Aker Solutions. During downturns, spending pivots to maintenance, tie-backs and shorter-cycle projects, moderating revenue volatility. Aker Solutions’ diversified portfolio across lifecycle services and flexible capacity gives cushioning against cycle swings, while strict cost discipline sustains margins across price cycles.
Cost inflation and supply chain tightness
Cost inflation and supply-chain tightness have driven 20–30% swings in steel and specialty-alloy prices and vessel lead times, while skilled-labor shortages elevated dayrates; EPC margins, notably on lump-sum turnkey contracts, have been compressed by roughly 200–300 basis points. Strategic sourcing, framework agreements and index-linked clauses have shielded profitability, and early procurement with design standardization reduces exposure.

Currency and interest rate impacts
Aker Solutions earns revenues in USD, EUR, GBP, NOK and BRL while costs are multi-currency; FX swings in 2024–25 materially affected reported earnings and bid competitiveness. Rising policy rates in 2024–25 increased project financing costs and client WACC, delaying FIDs. Active hedging and currency-matched cost bases have helped stabilize outcomes.

Energy transition capital flows
Public and private capital targeting CCS, offshore wind and hydrogen is rising: global clean energy investment reached about $1.7 trillion in 2023 (IEA) and US IRA incentives are projected to mobilize up to $1 trillion over the next decade, improving project viability and pipeline visibility for Aker Solutions. Competitive auction dynamics can compress margins, so offering bankable, low-risk execution and performance guarantees secures awards.
- Capital rise: IEA $1.7T (2023)
- IRA mobilization: up to $1T
- Risk premium: auctions compress margins
- Mitigation: bankable execution/performance guarantees
Global growth and industrial demand
Global GDP growth slowed to about 3.0% in 2024 with IMF projecting ~3.1% in 2025, moderating power, petrochemical and LNG demand; IEA reports global LNG trade rose ~5% year-on-year to near 395 million tonnes in 2024, supporting throughput-driven orders for Aker Solutions. Strong industrial activity fuels brownfield debottlenecking and electrification projects, while downturns cut discretionary upgrades and delay capex-heavy expansions; Aker Solutions' regional and segment diversification smooths revenue volatility.
- IMF global growth 2024: ~3.0%
- IMF global growth 2025: ~3.1%
- IEA LNG trade 2024: ~395 mt (+5%)
- Implication: supports brownfield, electrification; slowdowns delay expansions
Political risk reshapes offshore energy awards: net-zero targets, IRA, sanctions, local content
Brent ~86 USD/bbl (2024) and 80–90 USD in H1 2025 lifted upstream capex (~350bn USD 2024), boosting demand for subsea and brownfield work. Cost inflation, steel swings (20–30%) and higher rates raised project costs and compressed EPC margins ~200–300bp; hedging and early procurement mitigate. Clean-energy capital (IEA 1.7T USD 2023; IRA up to 1T USD) expands CCS/offshore-wind pipeline but intensifies auction competition.
| Metric | Value |
|---|---|
| Brent (2024) | ~86 USD/bbl |
| Upstream capex (2024) | ~350 bn USD |
| Clean-energy invest (2023) | 1.7 T USD |
| IRA mobilization | up to 1 T USD |
| Global GDP (2024) | ~3.0% |
What You See Is What You Get
Aker Solutions PESTLE Analysis
The Aker Solutions PESTLE Analysis preview shown here is the exact document you’ll receive after purchase—fully formatted and ready to use. This is the real, finished file with complete political, economic, social, technological, legal and environmental insights. No placeholders or teasers—download immediately after payment and start applying the analysis to your decisions.

Plan Smarter. Present Sharper. Compete Stronger.
Aker Solutions PESTLE snapshot reveals how regulation shifts, the energy transition, and supply-chain pressures are shaping strategic choices. This concise overview highlights key risks and growth levers for investors and advisors. Buy the full PESTLE to access detailed, downloadable analysis and ready-to-use insights.
Political factors
Energy policy and transition targets
Aker Solutions’ project pipeline is shaped by national energy strategies and net-zero roadmaps; Norway targets 50–55% emissions cuts by 2030, the EU -55% by 2030 and the UK/US maintain net‑zero by 2050 frameworks. Supportive policies for CCS, hydrogen and offshore wind in Norway, UK, EU and the US (IRA ~USD 369bn clean energy provisions) can accelerate awards. Shifts in subsidies or tax regimes can delay FIDs or reprioritise oil & gas versus low‑carbon projects. Active policy monitoring and advocacy align offerings with funded programmes.
Geopolitical stability and sanctions
Aker Solutions' operations and sourcing across the North Sea, Brazil, the Gulf and emerging basins are exposed to geopolitical risk, with sanctions since 2022 (notably against Russia) constraining bidding and supplier options.
Sanctions on specific regions, entities and technologies reduce available partners and can force contract exclusions or re-pricing.
Conflict-driven logistics disruptions increase shipping and EPC delivery timelines and costs, especially for modular deliveries.
Diversified market exposure and robust trade-compliance processes mitigate concentration and sanction-related risks.
Local content and industrial policy
Many jurisdictions mandate local content and in‑country value for EPC and subsea packages, with thresholds commonly set between 30% and 60%, forcing Aker Solutions to adapt partner selection, fabrication sites and cost structure. Meeting these thresholds can be decisive for bid eligibility and scoring, while well‑planned localization unlocks contract wins, builds stakeholder goodwill and secures longer‑term market access.
Permitting and stakeholder approvals
Project timing for Aker Solutions hinges on environmental permits, maritime consents and community sign-offs; EIAs commonly take 6–24 months, and lengthy approvals can shift execution windows and resource allocation. Early stakeholder engagement and robust impact assessments reduce denial/delay risk, while streamlined permitting for renewables and CCS is creating competitive openings.
- Permitting timelines: EIAs 6–24 months
- Risk: approvals drive major schedule variance
- Mitigation: early engagement + impact studies
- Opportunity: streamlined renewables/CCS permitting
Public procurement and state clients
State-backed operators and agencies are key clients for offshore and low-carbon projects, with national oil companies holding roughly 80% of global proved oil reserves, shaping demand and contract size. Tender rules, transparency requirements and political cycles drive award cadence and timing. Budget reallocations can re-sequence exploration, retrofit and decarbonization programs. Strong compliance and government relations materially boost tender success.
- State clients drive large-ticket offshore awards
- Tender transparency and political cycles affect timing
- Budget shifts reorder project sequencing
- Compliance/government relations raise win rates
Political risk reshapes offshore energy awards: net-zero targets, IRA, sanctions, local content
Political risk shapes Aker Solutions: national net‑zero targets (Norway 50–55% by 2030; EU −55% by 2030; UK/US net‑zero by 2050) and support (US IRA ~USD 369bn) drive CCS/hydrogen/offshore awards; sanctions since 2022 and state‑owned operators (≈80% of proved reserves) affect bidding; local content (30–60%) and EIAs (6–24 months) determine eligibility and timing.
| Factor | Metric | Impact |
|---|---|---|
| Net‑zero targets | Norway 50–55%/2030; EU −55%/2030 | Market shift to low‑carbon |
| IRA | ~USD 369bn | Increases US awards |
| State reserves | ≈80% proved reserves | Large state tenders |
| Local content | 30–60% | Bid eligibility |
| EIAs | 6–24 months | Schedule variance |
| Sanctions | Since 2022 | Limits partners |
What is included in the product
Detailed Word Document
Explores how macro-environmental forces uniquely affect Aker Solutions across six dimensions—Political, Economic, Social, Technological, Environmental, and Legal—linking each to industry-specific data and regional dynamics. Designed for executives and investors, it offers actionable, forward-looking insights and detailed sub-points to support strategy, risk mitigation, and investor communication.
Customizable Excel Spreadsheet
Condensed PESTLE of Aker Solutions, visually segmented for quick interpretation and easily editable so teams can annotate region- or business-specific risks, share in slides or reports, and accelerate alignment on external threats and strategic positioning during planning sessions.
Economic factors
Hydrocarbon price and investment cycles
Brent crude averaged about 86 USD/barrel in 2024 and remained in the 80–90 USD range in H1 2025, driving a recovery in E&P capex—global upstream investment rose toward roughly 350 billion USD in 2024—supporting higher demand for brownfield optimization and long-cycle subsea/topside projects that benefit Aker Solutions. During downturns, spending pivots to maintenance, tie-backs and shorter-cycle projects, moderating revenue volatility. Aker Solutions’ diversified portfolio across lifecycle services and flexible capacity gives cushioning against cycle swings, while strict cost discipline sustains margins across price cycles.
Cost inflation and supply chain tightness
Cost inflation and supply-chain tightness have driven 20–30% swings in steel and specialty-alloy prices and vessel lead times, while skilled-labor shortages elevated dayrates; EPC margins, notably on lump-sum turnkey contracts, have been compressed by roughly 200–300 basis points. Strategic sourcing, framework agreements and index-linked clauses have shielded profitability, and early procurement with design standardization reduces exposure.
Currency and interest rate impacts
Aker Solutions earns revenues in USD, EUR, GBP, NOK and BRL while costs are multi-currency; FX swings in 2024–25 materially affected reported earnings and bid competitiveness. Rising policy rates in 2024–25 increased project financing costs and client WACC, delaying FIDs. Active hedging and currency-matched cost bases have helped stabilize outcomes.
Energy transition capital flows
Public and private capital targeting CCS, offshore wind and hydrogen is rising: global clean energy investment reached about $1.7 trillion in 2023 (IEA) and US IRA incentives are projected to mobilize up to $1 trillion over the next decade, improving project viability and pipeline visibility for Aker Solutions. Competitive auction dynamics can compress margins, so offering bankable, low-risk execution and performance guarantees secures awards.
- Capital rise: IEA $1.7T (2023)
- IRA mobilization: up to $1T
- Risk premium: auctions compress margins
- Mitigation: bankable execution/performance guarantees
Global growth and industrial demand
Global GDP growth slowed to about 3.0% in 2024 with IMF projecting ~3.1% in 2025, moderating power, petrochemical and LNG demand; IEA reports global LNG trade rose ~5% year-on-year to near 395 million tonnes in 2024, supporting throughput-driven orders for Aker Solutions. Strong industrial activity fuels brownfield debottlenecking and electrification projects, while downturns cut discretionary upgrades and delay capex-heavy expansions; Aker Solutions' regional and segment diversification smooths revenue volatility.
- IMF global growth 2024: ~3.0%
- IMF global growth 2025: ~3.1%
- IEA LNG trade 2024: ~395 mt (+5%)
- Implication: supports brownfield, electrification; slowdowns delay expansions
Political risk reshapes offshore energy awards: net-zero targets, IRA, sanctions, local content
Brent ~86 USD/bbl (2024) and 80–90 USD in H1 2025 lifted upstream capex (~350bn USD 2024), boosting demand for subsea and brownfield work. Cost inflation, steel swings (20–30%) and higher rates raised project costs and compressed EPC margins ~200–300bp; hedging and early procurement mitigate. Clean-energy capital (IEA 1.7T USD 2023; IRA up to 1T USD) expands CCS/offshore-wind pipeline but intensifies auction competition.
| Metric | Value |
|---|---|
| Brent (2024) | ~86 USD/bbl |
| Upstream capex (2024) | ~350 bn USD |
| Clean-energy invest (2023) | 1.7 T USD |
| IRA mobilization | up to 1 T USD |
| Global GDP (2024) | ~3.0% |
What You See Is What You Get
Aker Solutions PESTLE Analysis
The Aker Solutions PESTLE Analysis preview shown here is the exact document you’ll receive after purchase—fully formatted and ready to use. This is the real, finished file with complete political, economic, social, technological, legal and environmental insights. No placeholders or teasers—download immediately after payment and start applying the analysis to your decisions.
Original: $10.00
-65%$10.00
$3.50Description
Plan Smarter. Present Sharper. Compete Stronger.
Aker Solutions PESTLE snapshot reveals how regulation shifts, the energy transition, and supply-chain pressures are shaping strategic choices. This concise overview highlights key risks and growth levers for investors and advisors. Buy the full PESTLE to access detailed, downloadable analysis and ready-to-use insights.
Political factors
Energy policy and transition targets
Aker Solutions’ project pipeline is shaped by national energy strategies and net-zero roadmaps; Norway targets 50–55% emissions cuts by 2030, the EU -55% by 2030 and the UK/US maintain net‑zero by 2050 frameworks. Supportive policies for CCS, hydrogen and offshore wind in Norway, UK, EU and the US (IRA ~USD 369bn clean energy provisions) can accelerate awards. Shifts in subsidies or tax regimes can delay FIDs or reprioritise oil & gas versus low‑carbon projects. Active policy monitoring and advocacy align offerings with funded programmes.
Geopolitical stability and sanctions
Aker Solutions' operations and sourcing across the North Sea, Brazil, the Gulf and emerging basins are exposed to geopolitical risk, with sanctions since 2022 (notably against Russia) constraining bidding and supplier options.
Sanctions on specific regions, entities and technologies reduce available partners and can force contract exclusions or re-pricing.
Conflict-driven logistics disruptions increase shipping and EPC delivery timelines and costs, especially for modular deliveries.
Diversified market exposure and robust trade-compliance processes mitigate concentration and sanction-related risks.
Local content and industrial policy
Many jurisdictions mandate local content and in‑country value for EPC and subsea packages, with thresholds commonly set between 30% and 60%, forcing Aker Solutions to adapt partner selection, fabrication sites and cost structure. Meeting these thresholds can be decisive for bid eligibility and scoring, while well‑planned localization unlocks contract wins, builds stakeholder goodwill and secures longer‑term market access.
Permitting and stakeholder approvals
Project timing for Aker Solutions hinges on environmental permits, maritime consents and community sign-offs; EIAs commonly take 6–24 months, and lengthy approvals can shift execution windows and resource allocation. Early stakeholder engagement and robust impact assessments reduce denial/delay risk, while streamlined permitting for renewables and CCS is creating competitive openings.
- Permitting timelines: EIAs 6–24 months
- Risk: approvals drive major schedule variance
- Mitigation: early engagement + impact studies
- Opportunity: streamlined renewables/CCS permitting
Public procurement and state clients
State-backed operators and agencies are key clients for offshore and low-carbon projects, with national oil companies holding roughly 80% of global proved oil reserves, shaping demand and contract size. Tender rules, transparency requirements and political cycles drive award cadence and timing. Budget reallocations can re-sequence exploration, retrofit and decarbonization programs. Strong compliance and government relations materially boost tender success.
- State clients drive large-ticket offshore awards
- Tender transparency and political cycles affect timing
- Budget shifts reorder project sequencing
- Compliance/government relations raise win rates
Political risk reshapes offshore energy awards: net-zero targets, IRA, sanctions, local content
Political risk shapes Aker Solutions: national net‑zero targets (Norway 50–55% by 2030; EU −55% by 2030; UK/US net‑zero by 2050) and support (US IRA ~USD 369bn) drive CCS/hydrogen/offshore awards; sanctions since 2022 and state‑owned operators (≈80% of proved reserves) affect bidding; local content (30–60%) and EIAs (6–24 months) determine eligibility and timing.
| Factor | Metric | Impact |
|---|---|---|
| Net‑zero targets | Norway 50–55%/2030; EU −55%/2030 | Market shift to low‑carbon |
| IRA | ~USD 369bn | Increases US awards |
| State reserves | ≈80% proved reserves | Large state tenders |
| Local content | 30–60% | Bid eligibility |
| EIAs | 6–24 months | Schedule variance |
| Sanctions | Since 2022 | Limits partners |
What is included in the product
Detailed Word Document
Explores how macro-environmental forces uniquely affect Aker Solutions across six dimensions—Political, Economic, Social, Technological, Environmental, and Legal—linking each to industry-specific data and regional dynamics. Designed for executives and investors, it offers actionable, forward-looking insights and detailed sub-points to support strategy, risk mitigation, and investor communication.
Customizable Excel Spreadsheet
Condensed PESTLE of Aker Solutions, visually segmented for quick interpretation and easily editable so teams can annotate region- or business-specific risks, share in slides or reports, and accelerate alignment on external threats and strategic positioning during planning sessions.
Economic factors
Hydrocarbon price and investment cycles
Brent crude averaged about 86 USD/barrel in 2024 and remained in the 80–90 USD range in H1 2025, driving a recovery in E&P capex—global upstream investment rose toward roughly 350 billion USD in 2024—supporting higher demand for brownfield optimization and long-cycle subsea/topside projects that benefit Aker Solutions. During downturns, spending pivots to maintenance, tie-backs and shorter-cycle projects, moderating revenue volatility. Aker Solutions’ diversified portfolio across lifecycle services and flexible capacity gives cushioning against cycle swings, while strict cost discipline sustains margins across price cycles.
Cost inflation and supply chain tightness
Cost inflation and supply-chain tightness have driven 20–30% swings in steel and specialty-alloy prices and vessel lead times, while skilled-labor shortages elevated dayrates; EPC margins, notably on lump-sum turnkey contracts, have been compressed by roughly 200–300 basis points. Strategic sourcing, framework agreements and index-linked clauses have shielded profitability, and early procurement with design standardization reduces exposure.
Currency and interest rate impacts
Aker Solutions earns revenues in USD, EUR, GBP, NOK and BRL while costs are multi-currency; FX swings in 2024–25 materially affected reported earnings and bid competitiveness. Rising policy rates in 2024–25 increased project financing costs and client WACC, delaying FIDs. Active hedging and currency-matched cost bases have helped stabilize outcomes.
Energy transition capital flows
Public and private capital targeting CCS, offshore wind and hydrogen is rising: global clean energy investment reached about $1.7 trillion in 2023 (IEA) and US IRA incentives are projected to mobilize up to $1 trillion over the next decade, improving project viability and pipeline visibility for Aker Solutions. Competitive auction dynamics can compress margins, so offering bankable, low-risk execution and performance guarantees secures awards.
- Capital rise: IEA $1.7T (2023)
- IRA mobilization: up to $1T
- Risk premium: auctions compress margins
- Mitigation: bankable execution/performance guarantees
Global growth and industrial demand
Global GDP growth slowed to about 3.0% in 2024 with IMF projecting ~3.1% in 2025, moderating power, petrochemical and LNG demand; IEA reports global LNG trade rose ~5% year-on-year to near 395 million tonnes in 2024, supporting throughput-driven orders for Aker Solutions. Strong industrial activity fuels brownfield debottlenecking and electrification projects, while downturns cut discretionary upgrades and delay capex-heavy expansions; Aker Solutions' regional and segment diversification smooths revenue volatility.
- IMF global growth 2024: ~3.0%
- IMF global growth 2025: ~3.1%
- IEA LNG trade 2024: ~395 mt (+5%)
- Implication: supports brownfield, electrification; slowdowns delay expansions
Political risk reshapes offshore energy awards: net-zero targets, IRA, sanctions, local content
Brent ~86 USD/bbl (2024) and 80–90 USD in H1 2025 lifted upstream capex (~350bn USD 2024), boosting demand for subsea and brownfield work. Cost inflation, steel swings (20–30%) and higher rates raised project costs and compressed EPC margins ~200–300bp; hedging and early procurement mitigate. Clean-energy capital (IEA 1.7T USD 2023; IRA up to 1T USD) expands CCS/offshore-wind pipeline but intensifies auction competition.
| Metric | Value |
|---|---|
| Brent (2024) | ~86 USD/bbl |
| Upstream capex (2024) | ~350 bn USD |
| Clean-energy invest (2023) | 1.7 T USD |
| IRA mobilization | up to 1 T USD |
| Global GDP (2024) | ~3.0% |
What You See Is What You Get
Aker Solutions PESTLE Analysis
The Aker Solutions PESTLE Analysis preview shown here is the exact document you’ll receive after purchase—fully formatted and ready to use. This is the real, finished file with complete political, economic, social, technological, legal and environmental insights. No placeholders or teasers—download immediately after payment and start applying the analysis to your decisions.











