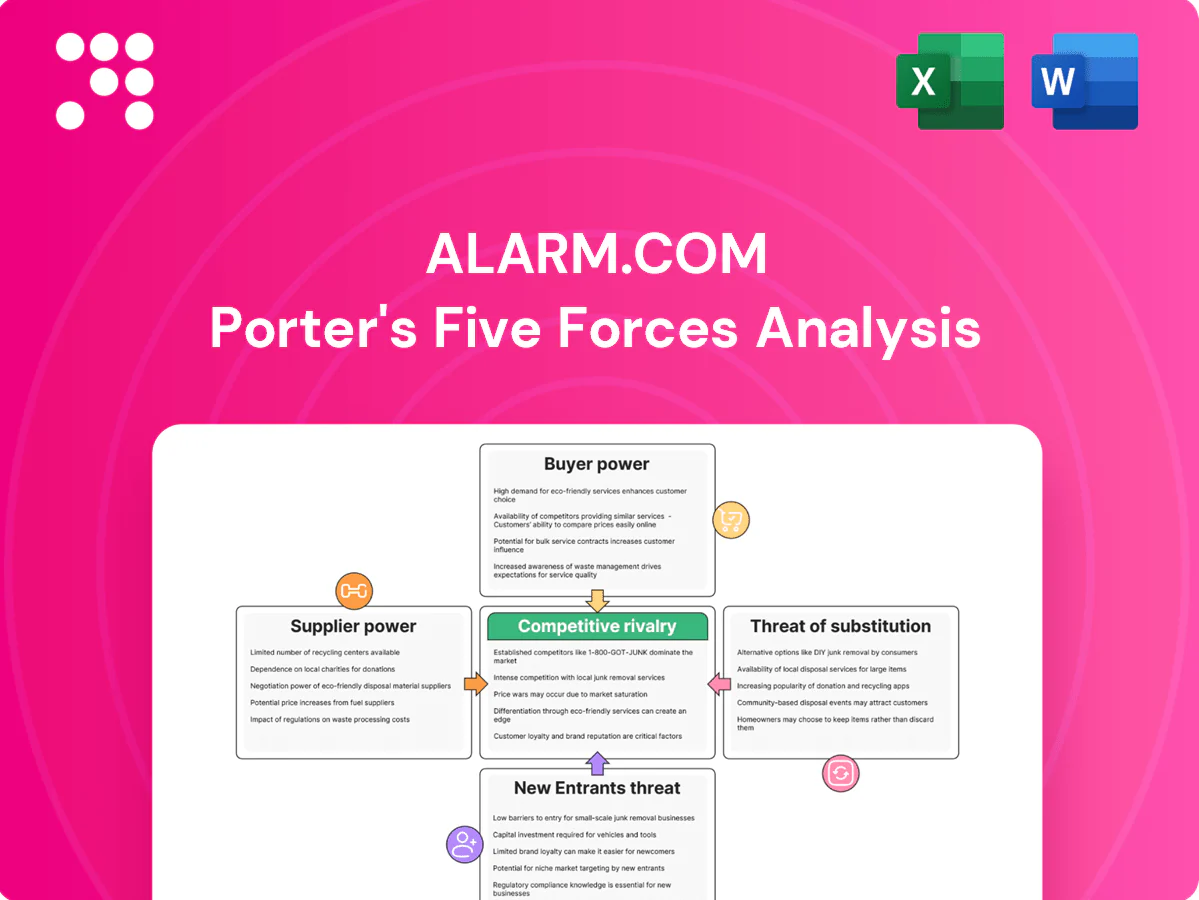
Alarm.com Porter's Five Forces Analysis

Go Beyond the Preview—Access the Full Strategic Report
This brief snapshot outlines key pressures on Alarm.com—from buyer power and supplier dynamics to competitive rivalry—highlighting strategic stress points and growth levers. The full Porter's Five Forces Analysis reveals force-by-force ratings, visualizations, and actionable implications for investors and strategists. Unlock the complete report to make informed, data-driven decisions.
Suppliers Bargaining Power

Concentrated hardware OEMs
Alarm.com depends on a limited set of certified panel, camera, and sensor OEMs, giving those suppliers meaningful negotiating leverage over price and contract terms. Dual-sourcing and proprietary integrations with select manufacturers partially mitigate concentration, but do not eliminate dependence. Industry-wide semiconductor lead times averaged about 22 weeks in 2024, and component shortages can therefore amplify supplier leverage on costs and delivery.
Cloud and connectivity dependencies
Third-party cloud platforms and cellular carriers (the big three cloud providers hold over 60% market share) underpin Alarm.com service reliability; major cloud outages have affected millions and can compress margins via remediation costs. Pricing shifts or carrier tariff changes can pressure margins, while multi-cloud, edge processing and diversified carrier partnerships reduce single-point exposure. SLAs and volume commitments temper supplier power.

Semiconductor and module suppliers
Chipsets, radios and vision SoCs are specialized with design-in cycles of 12–24 months and industry lead times often around 20–30 weeks in 2024, making availability cyclical. Certifications and long validation windows raise switching costs and bolster supplier leverage. Long-term forecasts and multi-month inventory buffers mitigate but cannot eliminate disruption risk. Reference designs and modular modules provide limited flexibility to reduce dependency.

Software stacks and standards
Dependencies on SDKs, codecs, and security standards shape Alarm.com interoperability, as licensing terms and compliance updates drive recurring costs and patch cycles; proprietary stacks increase supplier leverage while open standards reduce lock-in, and robust internal R&D lowers reliance on external vendors.
- SDKs/codecs: affect integration
- Licensing: ongoing cost/upgrade risk
- Proprietary: higher supplier power
- R&D: reduces external dependence
Installer channel tooling
Dealers demand integrated tools, firmware, and support from device partners, and when supplier tooling becomes entrenched bargaining power shifts to those vendors; Alarm.com reported roughly $1.0B revenue in FY2024, and its platform tooling helps counter external supplier influence while preserving dealer retention.
- Installer expectations: integrated tooling, firmware, support
- Entrenchment effect: raises supplier bargaining power
- Alarm.com offset: proprietary platform tooling maintains leverage
- Mitigation: co-marketing and joint roadmaps balance interests
Limited OEMs and long chip cycles boost supplier leverage despite $1.0B
Alarm.com relies on a limited set of certified OEMs, giving suppliers meaningful negotiating leverage on price and contract terms. Semiconductor lead times averaged 22 weeks in 2024 and chip/SoC design-in cycles of 12–24 months raise switching costs. Big three cloud providers hold over 60% market share, exposing Alarm.com to carrier/cloud pricing and outage risk despite multi-cloud and platform tooling. FY2024 revenue roughly $1.0B supports volume SLAs to temper supplier power.
| Metric | 2024 Value |
|---|---|
| Semiconductor lead time | 22 weeks |
| Chip design cycle | 12–24 months |
| Big 3 cloud share | >60% |
| FY2024 revenue | $1.0B |
What is included in the product
 Detailed Word Document
Tailored Porter’s Five Forces analysis for Alarm.com uncovering competitive drivers, buyer/supplier power, substitute threats, and entry barriers to inform strategy and investor materials.

 Customizable Excel Spreadsheet
A concise, one-sheet Porter's Five Forces for Alarm.com that instantly visualizes competitive pressures with a spider chart, lets you customize scores for changing market data, and plugs straight into decks or dashboards to remove analysis bottlenecks.
Customers Bargaining Power

Dealer-centric channel
Professional installers aggregate demand and, with Alarm.com working with over 6,000 dealer partners as of 2024, can strongly influence platform selection. High dealer concentration raises negotiating leverage on pricing, features and integrations, pressuring margins. Alarm.com mitigates this through dealer enablement programs, co-op marketing and lead-generation services. Churn risk remains linked to sustaining dealer economics and satisfaction.
End-user switching costs
Consumers face app familiarity, device compatibility, and contract hurdles; Alarm.com’s scale—about 7.0 million connected accounts in 2024—raises switching friction. Business clients face added integration and training costs, increasing stickiness and lowering price sensitivity. Higher switching costs blunt buyer power, though interoperability standards and Matter/Z-Wave support prompt multi-platform trials.

Price transparency and bundles
Competing providers in 2024 aggressively advertise monthly monitoring and equipment bundles, increasing price transparency and enabling side-by-side buyer comparisons that drive more discount requests. Clear pricing has raised churn sensitivity, but Alarm.com’s value-added services—video analytics, energy management, and access control—support tiered ARPU models. Bundled packages with financing options reduce pure-price competition by shifting focus to total cost of ownership and monthly affordability.

Service quality and uptime
Reliability, latency and false-alarm rates strongly drive retention; industry SLAs targeting 99.9% uptime and alarm-dispatch costs around $200–$250 per incident make outages costly, and buyers can demand credits or concessions after service incidents. Robust SLAs, rapid support and proactive monitoring reduce customer leverage, while clear performance differentiation shifts negotiations away from price alone.
- Reliability: SLA 99.9%
- Cost impact: dispatch ~$200–$250
- Buyer leverage: credits after incidents
- Mitigation: rapid support, proactive monitoring
Enterprise feature demands
Enterprise RFPs for Alarm.com are driven by multi-site management, API integration, and compliance requirements; larger customers push for custom terms, integration work, and volume discounts. Alarm.com’s broad platform lets it win on scope over price, but bespoke requirements raise buyer bargaining power; in 2024 Alarm.com reported about 6.1 million connected devices and roughly $1.15B revenue.
- Multi-site + APIs amplify RFP complexity
- Top accounts negotiate custom terms & discounts
- Platform breadth offsets price pressure but bespoke needs boost buyer leverage
Moderate buyer power: 6,000+ dealers & enterprise RFPs vs 7.0M accounts, 99.9% SLA limit churn
Buyers wield moderate power: 6,000+ dealers (2024) and enterprise RFPs drive negotiation on price, integrations and SLAs, but high switching costs from 7.0M connected accounts and platform breadth limit churn. Price transparency boosts discount requests; value-added services and 99.9% SLA reduce pure price pressure.
| Metric | 2024 |
|---|---|
| Dealer partners | 6,000+ |
| Connected accounts | 7.0M |
| Revenue | $1.15B |
| SLA | 99.9% |
| Dispatch cost | $200–$250 |
Same Document Delivered
Alarm.com Porter's Five Forces Analysis
This preview displays the exact Alarm.com Porter's Five Forces analysis you'll receive—no samples, no placeholders. The full, professionally formatted document covers competitive rivalry, supplier and buyer power, threat of entrants and substitutes, and is ready for immediate download after purchase. What you see is the deliverable you’ll get, instantly and unchanged.

Go Beyond the Preview—Access the Full Strategic Report
This brief snapshot outlines key pressures on Alarm.com—from buyer power and supplier dynamics to competitive rivalry—highlighting strategic stress points and growth levers. The full Porter's Five Forces Analysis reveals force-by-force ratings, visualizations, and actionable implications for investors and strategists. Unlock the complete report to make informed, data-driven decisions.
Suppliers Bargaining Power
Concentrated hardware OEMs
Alarm.com depends on a limited set of certified panel, camera, and sensor OEMs, giving those suppliers meaningful negotiating leverage over price and contract terms. Dual-sourcing and proprietary integrations with select manufacturers partially mitigate concentration, but do not eliminate dependence. Industry-wide semiconductor lead times averaged about 22 weeks in 2024, and component shortages can therefore amplify supplier leverage on costs and delivery.
Cloud and connectivity dependencies
Third-party cloud platforms and cellular carriers (the big three cloud providers hold over 60% market share) underpin Alarm.com service reliability; major cloud outages have affected millions and can compress margins via remediation costs. Pricing shifts or carrier tariff changes can pressure margins, while multi-cloud, edge processing and diversified carrier partnerships reduce single-point exposure. SLAs and volume commitments temper supplier power.
Semiconductor and module suppliers
Chipsets, radios and vision SoCs are specialized with design-in cycles of 12–24 months and industry lead times often around 20–30 weeks in 2024, making availability cyclical. Certifications and long validation windows raise switching costs and bolster supplier leverage. Long-term forecasts and multi-month inventory buffers mitigate but cannot eliminate disruption risk. Reference designs and modular modules provide limited flexibility to reduce dependency.
Software stacks and standards
Dependencies on SDKs, codecs, and security standards shape Alarm.com interoperability, as licensing terms and compliance updates drive recurring costs and patch cycles; proprietary stacks increase supplier leverage while open standards reduce lock-in, and robust internal R&D lowers reliance on external vendors.
- SDKs/codecs: affect integration
- Licensing: ongoing cost/upgrade risk
- Proprietary: higher supplier power
- R&D: reduces external dependence
Installer channel tooling
Dealers demand integrated tools, firmware, and support from device partners, and when supplier tooling becomes entrenched bargaining power shifts to those vendors; Alarm.com reported roughly $1.0B revenue in FY2024, and its platform tooling helps counter external supplier influence while preserving dealer retention.
- Installer expectations: integrated tooling, firmware, support
- Entrenchment effect: raises supplier bargaining power
- Alarm.com offset: proprietary platform tooling maintains leverage
- Mitigation: co-marketing and joint roadmaps balance interests
Limited OEMs and long chip cycles boost supplier leverage despite $1.0B
Alarm.com relies on a limited set of certified OEMs, giving suppliers meaningful negotiating leverage on price and contract terms. Semiconductor lead times averaged 22 weeks in 2024 and chip/SoC design-in cycles of 12–24 months raise switching costs. Big three cloud providers hold over 60% market share, exposing Alarm.com to carrier/cloud pricing and outage risk despite multi-cloud and platform tooling. FY2024 revenue roughly $1.0B supports volume SLAs to temper supplier power.
| Metric | 2024 Value |
|---|---|
| Semiconductor lead time | 22 weeks |
| Chip design cycle | 12–24 months |
| Big 3 cloud share | >60% |
| FY2024 revenue | $1.0B |
What is included in the product
Detailed Word Document
Tailored Porter’s Five Forces analysis for Alarm.com uncovering competitive drivers, buyer/supplier power, substitute threats, and entry barriers to inform strategy and investor materials.
Customizable Excel Spreadsheet
A concise, one-sheet Porter's Five Forces for Alarm.com that instantly visualizes competitive pressures with a spider chart, lets you customize scores for changing market data, and plugs straight into decks or dashboards to remove analysis bottlenecks.
Customers Bargaining Power
Dealer-centric channel
Professional installers aggregate demand and, with Alarm.com working with over 6,000 dealer partners as of 2024, can strongly influence platform selection. High dealer concentration raises negotiating leverage on pricing, features and integrations, pressuring margins. Alarm.com mitigates this through dealer enablement programs, co-op marketing and lead-generation services. Churn risk remains linked to sustaining dealer economics and satisfaction.
End-user switching costs
Consumers face app familiarity, device compatibility, and contract hurdles; Alarm.com’s scale—about 7.0 million connected accounts in 2024—raises switching friction. Business clients face added integration and training costs, increasing stickiness and lowering price sensitivity. Higher switching costs blunt buyer power, though interoperability standards and Matter/Z-Wave support prompt multi-platform trials.
Price transparency and bundles
Competing providers in 2024 aggressively advertise monthly monitoring and equipment bundles, increasing price transparency and enabling side-by-side buyer comparisons that drive more discount requests. Clear pricing has raised churn sensitivity, but Alarm.com’s value-added services—video analytics, energy management, and access control—support tiered ARPU models. Bundled packages with financing options reduce pure-price competition by shifting focus to total cost of ownership and monthly affordability.
Service quality and uptime
Reliability, latency and false-alarm rates strongly drive retention; industry SLAs targeting 99.9% uptime and alarm-dispatch costs around $200–$250 per incident make outages costly, and buyers can demand credits or concessions after service incidents. Robust SLAs, rapid support and proactive monitoring reduce customer leverage, while clear performance differentiation shifts negotiations away from price alone.
- Reliability: SLA 99.9%
- Cost impact: dispatch ~$200–$250
- Buyer leverage: credits after incidents
- Mitigation: rapid support, proactive monitoring
Enterprise feature demands
Enterprise RFPs for Alarm.com are driven by multi-site management, API integration, and compliance requirements; larger customers push for custom terms, integration work, and volume discounts. Alarm.com’s broad platform lets it win on scope over price, but bespoke requirements raise buyer bargaining power; in 2024 Alarm.com reported about 6.1 million connected devices and roughly $1.15B revenue.
- Multi-site + APIs amplify RFP complexity
- Top accounts negotiate custom terms & discounts
- Platform breadth offsets price pressure but bespoke needs boost buyer leverage
Moderate buyer power: 6,000+ dealers & enterprise RFPs vs 7.0M accounts, 99.9% SLA limit churn
Buyers wield moderate power: 6,000+ dealers (2024) and enterprise RFPs drive negotiation on price, integrations and SLAs, but high switching costs from 7.0M connected accounts and platform breadth limit churn. Price transparency boosts discount requests; value-added services and 99.9% SLA reduce pure price pressure.
| Metric | 2024 |
|---|---|
| Dealer partners | 6,000+ |
| Connected accounts | 7.0M |
| Revenue | $1.15B |
| SLA | 99.9% |
| Dispatch cost | $200–$250 |
Same Document Delivered
Alarm.com Porter's Five Forces Analysis
This preview displays the exact Alarm.com Porter's Five Forces analysis you'll receive—no samples, no placeholders. The full, professionally formatted document covers competitive rivalry, supplier and buyer power, threat of entrants and substitutes, and is ready for immediate download after purchase. What you see is the deliverable you’ll get, instantly and unchanged.
Original: $10.00
-65%$10.00
$3.50Description
Go Beyond the Preview—Access the Full Strategic Report
This brief snapshot outlines key pressures on Alarm.com—from buyer power and supplier dynamics to competitive rivalry—highlighting strategic stress points and growth levers. The full Porter's Five Forces Analysis reveals force-by-force ratings, visualizations, and actionable implications for investors and strategists. Unlock the complete report to make informed, data-driven decisions.
Suppliers Bargaining Power
Concentrated hardware OEMs
Alarm.com depends on a limited set of certified panel, camera, and sensor OEMs, giving those suppliers meaningful negotiating leverage over price and contract terms. Dual-sourcing and proprietary integrations with select manufacturers partially mitigate concentration, but do not eliminate dependence. Industry-wide semiconductor lead times averaged about 22 weeks in 2024, and component shortages can therefore amplify supplier leverage on costs and delivery.
Cloud and connectivity dependencies
Third-party cloud platforms and cellular carriers (the big three cloud providers hold over 60% market share) underpin Alarm.com service reliability; major cloud outages have affected millions and can compress margins via remediation costs. Pricing shifts or carrier tariff changes can pressure margins, while multi-cloud, edge processing and diversified carrier partnerships reduce single-point exposure. SLAs and volume commitments temper supplier power.
Semiconductor and module suppliers
Chipsets, radios and vision SoCs are specialized with design-in cycles of 12–24 months and industry lead times often around 20–30 weeks in 2024, making availability cyclical. Certifications and long validation windows raise switching costs and bolster supplier leverage. Long-term forecasts and multi-month inventory buffers mitigate but cannot eliminate disruption risk. Reference designs and modular modules provide limited flexibility to reduce dependency.
Software stacks and standards
Dependencies on SDKs, codecs, and security standards shape Alarm.com interoperability, as licensing terms and compliance updates drive recurring costs and patch cycles; proprietary stacks increase supplier leverage while open standards reduce lock-in, and robust internal R&D lowers reliance on external vendors.
- SDKs/codecs: affect integration
- Licensing: ongoing cost/upgrade risk
- Proprietary: higher supplier power
- R&D: reduces external dependence
Installer channel tooling
Dealers demand integrated tools, firmware, and support from device partners, and when supplier tooling becomes entrenched bargaining power shifts to those vendors; Alarm.com reported roughly $1.0B revenue in FY2024, and its platform tooling helps counter external supplier influence while preserving dealer retention.
- Installer expectations: integrated tooling, firmware, support
- Entrenchment effect: raises supplier bargaining power
- Alarm.com offset: proprietary platform tooling maintains leverage
- Mitigation: co-marketing and joint roadmaps balance interests
Limited OEMs and long chip cycles boost supplier leverage despite $1.0B
Alarm.com relies on a limited set of certified OEMs, giving suppliers meaningful negotiating leverage on price and contract terms. Semiconductor lead times averaged 22 weeks in 2024 and chip/SoC design-in cycles of 12–24 months raise switching costs. Big three cloud providers hold over 60% market share, exposing Alarm.com to carrier/cloud pricing and outage risk despite multi-cloud and platform tooling. FY2024 revenue roughly $1.0B supports volume SLAs to temper supplier power.
| Metric | 2024 Value |
|---|---|
| Semiconductor lead time | 22 weeks |
| Chip design cycle | 12–24 months |
| Big 3 cloud share | >60% |
| FY2024 revenue | $1.0B |
What is included in the product
Detailed Word Document
Tailored Porter’s Five Forces analysis for Alarm.com uncovering competitive drivers, buyer/supplier power, substitute threats, and entry barriers to inform strategy and investor materials.
Customizable Excel Spreadsheet
A concise, one-sheet Porter's Five Forces for Alarm.com that instantly visualizes competitive pressures with a spider chart, lets you customize scores for changing market data, and plugs straight into decks or dashboards to remove analysis bottlenecks.
Customers Bargaining Power
Dealer-centric channel
Professional installers aggregate demand and, with Alarm.com working with over 6,000 dealer partners as of 2024, can strongly influence platform selection. High dealer concentration raises negotiating leverage on pricing, features and integrations, pressuring margins. Alarm.com mitigates this through dealer enablement programs, co-op marketing and lead-generation services. Churn risk remains linked to sustaining dealer economics and satisfaction.
End-user switching costs
Consumers face app familiarity, device compatibility, and contract hurdles; Alarm.com’s scale—about 7.0 million connected accounts in 2024—raises switching friction. Business clients face added integration and training costs, increasing stickiness and lowering price sensitivity. Higher switching costs blunt buyer power, though interoperability standards and Matter/Z-Wave support prompt multi-platform trials.
Price transparency and bundles
Competing providers in 2024 aggressively advertise monthly monitoring and equipment bundles, increasing price transparency and enabling side-by-side buyer comparisons that drive more discount requests. Clear pricing has raised churn sensitivity, but Alarm.com’s value-added services—video analytics, energy management, and access control—support tiered ARPU models. Bundled packages with financing options reduce pure-price competition by shifting focus to total cost of ownership and monthly affordability.
Service quality and uptime
Reliability, latency and false-alarm rates strongly drive retention; industry SLAs targeting 99.9% uptime and alarm-dispatch costs around $200–$250 per incident make outages costly, and buyers can demand credits or concessions after service incidents. Robust SLAs, rapid support and proactive monitoring reduce customer leverage, while clear performance differentiation shifts negotiations away from price alone.
- Reliability: SLA 99.9%
- Cost impact: dispatch ~$200–$250
- Buyer leverage: credits after incidents
- Mitigation: rapid support, proactive monitoring
Enterprise feature demands
Enterprise RFPs for Alarm.com are driven by multi-site management, API integration, and compliance requirements; larger customers push for custom terms, integration work, and volume discounts. Alarm.com’s broad platform lets it win on scope over price, but bespoke requirements raise buyer bargaining power; in 2024 Alarm.com reported about 6.1 million connected devices and roughly $1.15B revenue.
- Multi-site + APIs amplify RFP complexity
- Top accounts negotiate custom terms & discounts
- Platform breadth offsets price pressure but bespoke needs boost buyer leverage
Moderate buyer power: 6,000+ dealers & enterprise RFPs vs 7.0M accounts, 99.9% SLA limit churn
Buyers wield moderate power: 6,000+ dealers (2024) and enterprise RFPs drive negotiation on price, integrations and SLAs, but high switching costs from 7.0M connected accounts and platform breadth limit churn. Price transparency boosts discount requests; value-added services and 99.9% SLA reduce pure price pressure.
| Metric | 2024 |
|---|---|
| Dealer partners | 6,000+ |
| Connected accounts | 7.0M |
| Revenue | $1.15B |
| SLA | 99.9% |
| Dispatch cost | $200–$250 |
Same Document Delivered
Alarm.com Porter's Five Forces Analysis
This preview displays the exact Alarm.com Porter's Five Forces analysis you'll receive—no samples, no placeholders. The full, professionally formatted document covers competitive rivalry, supplier and buyer power, threat of entrants and substitutes, and is ready for immediate download after purchase. What you see is the deliverable you’ll get, instantly and unchanged.











