Albertsons Boston Consulting Group Matrix

Visual. Strategic. Downloadable.
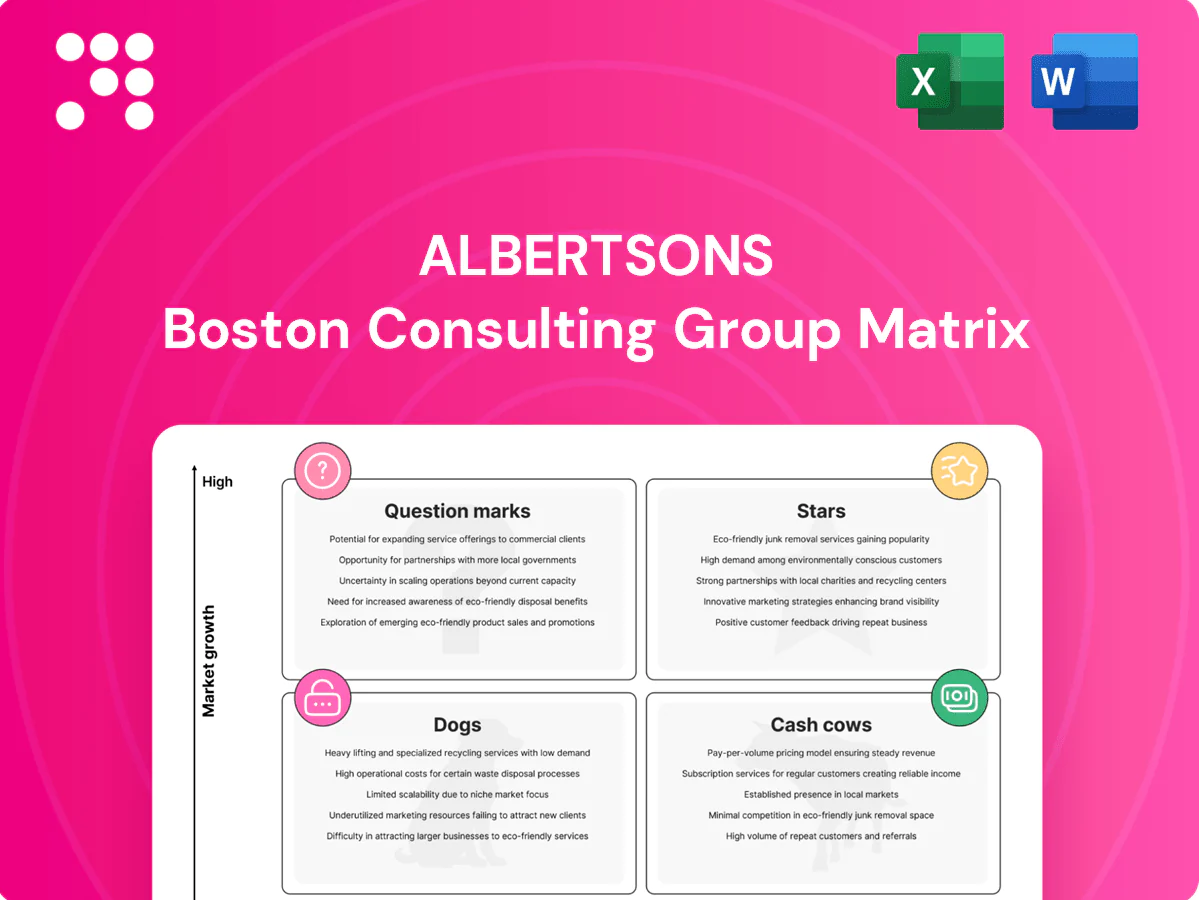
Curious where Albertsons’ brands sit—Stars, Cash Cows, Dogs, or Question Marks? This snapshot teases the shape of its portfolio; the full BCG Matrix gives you quadrant-by-quadrant placements, data-backed recommendations, and a clear capital-allocation playbook. Purchase the complete report for a ready-to-use Word report plus an Excel summary and start making smarter product and investment decisions today.
Stars

Online grocery & pickup
Digital orders and curbside are scaling fast and with a 2,200+ store footprint Albertsons is positioned to win local share. High demand and high customer expectation drive elevated capex for pickup slots, labor and last‑mile fulfillment. Keep feeding app experience and fulfillment speed to hold the lead; executed well this channel moves toward Cash Cow status.
Pharmacy & immunizations
Healthcare demand is rising — US retail pharmacies filled about 4.5 billion prescriptions (IQVIA, 2023) and Albertsons’ ~1,800 in-store pharmacies anchor foot traffic and repeat trips. Immunizations, therapeutics and clinical services increase basket size and loyalty, often lifting non-pharmacy sales by roughly 15–25%. Maintaining this requires ongoing staffing, compliance and payer management, raising operating costs, but integrated convenience accelerates the growth flywheel versus standalone pharmacies.

Retail media network
Brand dollars are shifting to grocers’ first‑party audiences as US retail media ad spend is projected at about $61 billion in 2024 (Insider Intelligence); Albertsons, with roughly 2,200 stores and ~300,000 employees, combines scale and proprietary shopper data. This channel is high‑growth, high‑margin and still in the early innings. Success requires robust measurement and self‑serve tools to keep CPGs spending; proven performance turns it into a cash engine.

Loyalty & digital coupons
Stars: Loyalty & digital coupons — Albertsons leverages a >30 million active loyalty base (2024) to drive unit growth via personalized digital offers that avoid blanket markdowns; every clipped coupon enriches first-party data, deepening the competitive moat. Success requires constant relevance, a clean UX and precision targeting; preserving share compounds lifetime value and margin expansion.
- Member scale: >30M active (2024)
- Offer model: personalization drives units without broad markdowns
- Moat: clipped offers = richer first-party data
- Risks: UX, relevance, targeting
Premium private brands
Shoppers are trading up to premium private brands at Albertsons to beat inflation without feeling cheap; these SKUs show high growth, strong repeat purchase and historically deliver roughly 300 basis points higher gross margin than national labels in 2024, with private brands comprising about 25% of sales. Maintaining momentum requires upgraded packaging, tighter sourcing and proactive shelf advocacy to stay top‑of‑mind; sustained pace makes them long‑term anchors.
- 2024 private brands ≈25% of sales
- Premium PL growth >10% YoY (2024)
- ~300 bps higher gross margin vs nationals
- Key investments: packaging, sourcing, shelf advocacy
Loyalty, private brands & retail media — >30M, ~25%, $61B
Albertsons Stars: loyalty, private brands and retail media are high‑growth drivers—>30M active members (2024), private brands ~25% of sales (2024) and US retail media ~$61B projected (2024). Scaling digital fulfillment and pharmacy services boosts share but requires capex and staffing to convert to Cash Cows.
| Metric | 2024 Value | Implication |
|---|---|---|
| Active Loyalty | >30M | Data/margin lift |
| Private Brands | ~25% sales | +300bps GM |
| Retail Media | $61B US | High margin growth |
What is included in the product
 Detailed Word Document
BCG Matrix review of Albertsons' portfolio, showing Stars, Cash Cows, Question Marks, Dogs with investment and divestment guidance.

 Customizable Excel Spreadsheet
One-page BCG matrix for Albertsons highlighting growth vs market share to spot investment needs and cut weak units.
Cash Cows

Core supermarket banners
Core supermarket banners operate at regional scale with over 2,200 stores (2024), delivering routine trips and predictable baskets that generate steady cash flow. Mature markets provide stable share and operational know‑how, underpinning margin reliability. Continue investing in store standards and labor productivity to protect per‑store economics. Milk the cash—avoid overbuilding and redeploy excess to digital and efficiency gains.
Center‑store staples
Center‑store staples drive pantry fill and deliver volume with minimal promo lift when priced right; industry data in 2024 shows staples represent roughly 35–40% of household grocery spend. Slotting fees, vendor funds and tight assortments protect margin and limit promotional leakage. Growth is flat but dependable, contributing stable cash flow and category share. Optimize shelf space, reduce out‑of‑stocks and keep supply humming to sustain returns.

Value private label
Everyday essentials under Albertsons house brands deliver steady velocity and stronger margins; NielsenIQ reports U.S. private-label share at about 17% in 2023 and Albertsons lists private brands as key gross-margin contributors in its 2023 Form 10-K. Low growth, high-repeat SKUs mean shoppers already know them; minimal marketing yields high ROI. Continue cost engineering and tighter quality control to widen the margin spread.

Fuel rewards link
Fuel rewards link
Loyalty fuel tie‑ins keep trips sticky and increase basket size by encouraging fill‑and‑shop behavior; Albertsons leverages this across its 2,200+ stores (2024). The program is mature and quietly effective, requiring limited incremental spend to maintain. Use it to defend share and avoid heavy category discounting while preserving margins.- Sticky trips: link fuels to grocery visits
- Low cost: mature program, minimal incremental spend
- Defensive: protects share without deep discounts
- Scale: deployed across 2,200+ stores (2024)
Distribution network
Albertsons distribution network is a cash cow: full trucks and optimized DCs drove daily margin recovery in 2024, supporting operating leverage across ~2,200 stores. Incremental automation pilots increased throughput with limited risk, preserving EBITDA while reducing manual handling. Continued asset sweating and aggressive freight negotiation remain low-risk, high-cash levers.
- Operational scale: ~2,200 stores (2024)
- Daily cash flow from fills/DC optimization
- Automation: throughput up, modest capex risk
- Focus: asset utilization + freight savings
2,200+ stores, 35-40% staples spend and private-label ~17% drive steady high-ROI cash
Core supermarkets (2,200+ stores, 2024) and center‑store staples (35–40% household grocery spend, 2024) generate steady, high‑ROI cash flow; private‑label (~17% share, 2023) boosts margins. Fuel rewards, DC optimization and slotting funds sustain low‑risk cash generation and redeployable capital.
| Metric | 2024 | Impact |
|---|---|---|
| Stores | 2,200+ | Scale cash flow |
| Staples spend | 35–40% | Stable volume |
| Private label | ~17% (2023) | Higher margin |
What You’re Viewing Is Included
Albertsons BCG Matrix
The file you're previewing on this page is the exact BCG Matrix document you'll receive after purchase—no watermarks, no demo text, just a fully formatted, ready-to-use report. Built with market-backed analysis and clear visuals, it's presentation-ready and editable. After purchase you'll get immediate download access and the same file in your inbox, primed for strategy sessions or investor decks.

Visual. Strategic. Downloadable.
Curious where Albertsons’ brands sit—Stars, Cash Cows, Dogs, or Question Marks? This snapshot teases the shape of its portfolio; the full BCG Matrix gives you quadrant-by-quadrant placements, data-backed recommendations, and a clear capital-allocation playbook. Purchase the complete report for a ready-to-use Word report plus an Excel summary and start making smarter product and investment decisions today.
Stars
Online grocery & pickup
Digital orders and curbside are scaling fast and with a 2,200+ store footprint Albertsons is positioned to win local share. High demand and high customer expectation drive elevated capex for pickup slots, labor and last‑mile fulfillment. Keep feeding app experience and fulfillment speed to hold the lead; executed well this channel moves toward Cash Cow status.
Pharmacy & immunizations
Healthcare demand is rising — US retail pharmacies filled about 4.5 billion prescriptions (IQVIA, 2023) and Albertsons’ ~1,800 in-store pharmacies anchor foot traffic and repeat trips. Immunizations, therapeutics and clinical services increase basket size and loyalty, often lifting non-pharmacy sales by roughly 15–25%. Maintaining this requires ongoing staffing, compliance and payer management, raising operating costs, but integrated convenience accelerates the growth flywheel versus standalone pharmacies.
Retail media network
Brand dollars are shifting to grocers’ first‑party audiences as US retail media ad spend is projected at about $61 billion in 2024 (Insider Intelligence); Albertsons, with roughly 2,200 stores and ~300,000 employees, combines scale and proprietary shopper data. This channel is high‑growth, high‑margin and still in the early innings. Success requires robust measurement and self‑serve tools to keep CPGs spending; proven performance turns it into a cash engine.
Loyalty & digital coupons
Stars: Loyalty & digital coupons — Albertsons leverages a >30 million active loyalty base (2024) to drive unit growth via personalized digital offers that avoid blanket markdowns; every clipped coupon enriches first-party data, deepening the competitive moat. Success requires constant relevance, a clean UX and precision targeting; preserving share compounds lifetime value and margin expansion.
- Member scale: >30M active (2024)
- Offer model: personalization drives units without broad markdowns
- Moat: clipped offers = richer first-party data
- Risks: UX, relevance, targeting
Premium private brands
Shoppers are trading up to premium private brands at Albertsons to beat inflation without feeling cheap; these SKUs show high growth, strong repeat purchase and historically deliver roughly 300 basis points higher gross margin than national labels in 2024, with private brands comprising about 25% of sales. Maintaining momentum requires upgraded packaging, tighter sourcing and proactive shelf advocacy to stay top‑of‑mind; sustained pace makes them long‑term anchors.
- 2024 private brands ≈25% of sales
- Premium PL growth >10% YoY (2024)
- ~300 bps higher gross margin vs nationals
- Key investments: packaging, sourcing, shelf advocacy
Loyalty, private brands & retail media — >30M, ~25%, $61B
Albertsons Stars: loyalty, private brands and retail media are high‑growth drivers—>30M active members (2024), private brands ~25% of sales (2024) and US retail media ~$61B projected (2024). Scaling digital fulfillment and pharmacy services boosts share but requires capex and staffing to convert to Cash Cows.
| Metric | 2024 Value | Implication |
|---|---|---|
| Active Loyalty | >30M | Data/margin lift |
| Private Brands | ~25% sales | +300bps GM |
| Retail Media | $61B US | High margin growth |
What is included in the product
Detailed Word Document
BCG Matrix review of Albertsons' portfolio, showing Stars, Cash Cows, Question Marks, Dogs with investment and divestment guidance.
Customizable Excel Spreadsheet
One-page BCG matrix for Albertsons highlighting growth vs market share to spot investment needs and cut weak units.
Cash Cows
Core supermarket banners
Core supermarket banners operate at regional scale with over 2,200 stores (2024), delivering routine trips and predictable baskets that generate steady cash flow. Mature markets provide stable share and operational know‑how, underpinning margin reliability. Continue investing in store standards and labor productivity to protect per‑store economics. Milk the cash—avoid overbuilding and redeploy excess to digital and efficiency gains.
Center‑store staples
Center‑store staples drive pantry fill and deliver volume with minimal promo lift when priced right; industry data in 2024 shows staples represent roughly 35–40% of household grocery spend. Slotting fees, vendor funds and tight assortments protect margin and limit promotional leakage. Growth is flat but dependable, contributing stable cash flow and category share. Optimize shelf space, reduce out‑of‑stocks and keep supply humming to sustain returns.
Value private label
Everyday essentials under Albertsons house brands deliver steady velocity and stronger margins; NielsenIQ reports U.S. private-label share at about 17% in 2023 and Albertsons lists private brands as key gross-margin contributors in its 2023 Form 10-K. Low growth, high-repeat SKUs mean shoppers already know them; minimal marketing yields high ROI. Continue cost engineering and tighter quality control to widen the margin spread.
Fuel rewards link
Fuel rewards link
Loyalty fuel tie‑ins keep trips sticky and increase basket size by encouraging fill‑and‑shop behavior; Albertsons leverages this across its 2,200+ stores (2024). The program is mature and quietly effective, requiring limited incremental spend to maintain. Use it to defend share and avoid heavy category discounting while preserving margins.- Sticky trips: link fuels to grocery visits
- Low cost: mature program, minimal incremental spend
- Defensive: protects share without deep discounts
- Scale: deployed across 2,200+ stores (2024)
Distribution network
Albertsons distribution network is a cash cow: full trucks and optimized DCs drove daily margin recovery in 2024, supporting operating leverage across ~2,200 stores. Incremental automation pilots increased throughput with limited risk, preserving EBITDA while reducing manual handling. Continued asset sweating and aggressive freight negotiation remain low-risk, high-cash levers.
- Operational scale: ~2,200 stores (2024)
- Daily cash flow from fills/DC optimization
- Automation: throughput up, modest capex risk
- Focus: asset utilization + freight savings
2,200+ stores, 35-40% staples spend and private-label ~17% drive steady high-ROI cash
Core supermarkets (2,200+ stores, 2024) and center‑store staples (35–40% household grocery spend, 2024) generate steady, high‑ROI cash flow; private‑label (~17% share, 2023) boosts margins. Fuel rewards, DC optimization and slotting funds sustain low‑risk cash generation and redeployable capital.
| Metric | 2024 | Impact |
|---|---|---|
| Stores | 2,200+ | Scale cash flow |
| Staples spend | 35–40% | Stable volume |
| Private label | ~17% (2023) | Higher margin |
What You’re Viewing Is Included
Albertsons BCG Matrix
The file you're previewing on this page is the exact BCG Matrix document you'll receive after purchase—no watermarks, no demo text, just a fully formatted, ready-to-use report. Built with market-backed analysis and clear visuals, it's presentation-ready and editable. After purchase you'll get immediate download access and the same file in your inbox, primed for strategy sessions or investor decks.
Original: $10.00
-65%$10.00
$3.50Description
Visual. Strategic. Downloadable.
Curious where Albertsons’ brands sit—Stars, Cash Cows, Dogs, or Question Marks? This snapshot teases the shape of its portfolio; the full BCG Matrix gives you quadrant-by-quadrant placements, data-backed recommendations, and a clear capital-allocation playbook. Purchase the complete report for a ready-to-use Word report plus an Excel summary and start making smarter product and investment decisions today.
Stars
Online grocery & pickup
Digital orders and curbside are scaling fast and with a 2,200+ store footprint Albertsons is positioned to win local share. High demand and high customer expectation drive elevated capex for pickup slots, labor and last‑mile fulfillment. Keep feeding app experience and fulfillment speed to hold the lead; executed well this channel moves toward Cash Cow status.
Pharmacy & immunizations
Healthcare demand is rising — US retail pharmacies filled about 4.5 billion prescriptions (IQVIA, 2023) and Albertsons’ ~1,800 in-store pharmacies anchor foot traffic and repeat trips. Immunizations, therapeutics and clinical services increase basket size and loyalty, often lifting non-pharmacy sales by roughly 15–25%. Maintaining this requires ongoing staffing, compliance and payer management, raising operating costs, but integrated convenience accelerates the growth flywheel versus standalone pharmacies.
Retail media network
Brand dollars are shifting to grocers’ first‑party audiences as US retail media ad spend is projected at about $61 billion in 2024 (Insider Intelligence); Albertsons, with roughly 2,200 stores and ~300,000 employees, combines scale and proprietary shopper data. This channel is high‑growth, high‑margin and still in the early innings. Success requires robust measurement and self‑serve tools to keep CPGs spending; proven performance turns it into a cash engine.
Loyalty & digital coupons
Stars: Loyalty & digital coupons — Albertsons leverages a >30 million active loyalty base (2024) to drive unit growth via personalized digital offers that avoid blanket markdowns; every clipped coupon enriches first-party data, deepening the competitive moat. Success requires constant relevance, a clean UX and precision targeting; preserving share compounds lifetime value and margin expansion.
- Member scale: >30M active (2024)
- Offer model: personalization drives units without broad markdowns
- Moat: clipped offers = richer first-party data
- Risks: UX, relevance, targeting
Premium private brands
Shoppers are trading up to premium private brands at Albertsons to beat inflation without feeling cheap; these SKUs show high growth, strong repeat purchase and historically deliver roughly 300 basis points higher gross margin than national labels in 2024, with private brands comprising about 25% of sales. Maintaining momentum requires upgraded packaging, tighter sourcing and proactive shelf advocacy to stay top‑of‑mind; sustained pace makes them long‑term anchors.
- 2024 private brands ≈25% of sales
- Premium PL growth >10% YoY (2024)
- ~300 bps higher gross margin vs nationals
- Key investments: packaging, sourcing, shelf advocacy
Loyalty, private brands & retail media — >30M, ~25%, $61B
Albertsons Stars: loyalty, private brands and retail media are high‑growth drivers—>30M active members (2024), private brands ~25% of sales (2024) and US retail media ~$61B projected (2024). Scaling digital fulfillment and pharmacy services boosts share but requires capex and staffing to convert to Cash Cows.
| Metric | 2024 Value | Implication |
|---|---|---|
| Active Loyalty | >30M | Data/margin lift |
| Private Brands | ~25% sales | +300bps GM |
| Retail Media | $61B US | High margin growth |
What is included in the product
Detailed Word Document
BCG Matrix review of Albertsons' portfolio, showing Stars, Cash Cows, Question Marks, Dogs with investment and divestment guidance.
Customizable Excel Spreadsheet
One-page BCG matrix for Albertsons highlighting growth vs market share to spot investment needs and cut weak units.
Cash Cows
Core supermarket banners
Core supermarket banners operate at regional scale with over 2,200 stores (2024), delivering routine trips and predictable baskets that generate steady cash flow. Mature markets provide stable share and operational know‑how, underpinning margin reliability. Continue investing in store standards and labor productivity to protect per‑store economics. Milk the cash—avoid overbuilding and redeploy excess to digital and efficiency gains.
Center‑store staples
Center‑store staples drive pantry fill and deliver volume with minimal promo lift when priced right; industry data in 2024 shows staples represent roughly 35–40% of household grocery spend. Slotting fees, vendor funds and tight assortments protect margin and limit promotional leakage. Growth is flat but dependable, contributing stable cash flow and category share. Optimize shelf space, reduce out‑of‑stocks and keep supply humming to sustain returns.
Value private label
Everyday essentials under Albertsons house brands deliver steady velocity and stronger margins; NielsenIQ reports U.S. private-label share at about 17% in 2023 and Albertsons lists private brands as key gross-margin contributors in its 2023 Form 10-K. Low growth, high-repeat SKUs mean shoppers already know them; minimal marketing yields high ROI. Continue cost engineering and tighter quality control to widen the margin spread.
Fuel rewards link
Fuel rewards link
Loyalty fuel tie‑ins keep trips sticky and increase basket size by encouraging fill‑and‑shop behavior; Albertsons leverages this across its 2,200+ stores (2024). The program is mature and quietly effective, requiring limited incremental spend to maintain. Use it to defend share and avoid heavy category discounting while preserving margins.- Sticky trips: link fuels to grocery visits
- Low cost: mature program, minimal incremental spend
- Defensive: protects share without deep discounts
- Scale: deployed across 2,200+ stores (2024)
Distribution network
Albertsons distribution network is a cash cow: full trucks and optimized DCs drove daily margin recovery in 2024, supporting operating leverage across ~2,200 stores. Incremental automation pilots increased throughput with limited risk, preserving EBITDA while reducing manual handling. Continued asset sweating and aggressive freight negotiation remain low-risk, high-cash levers.
- Operational scale: ~2,200 stores (2024)
- Daily cash flow from fills/DC optimization
- Automation: throughput up, modest capex risk
- Focus: asset utilization + freight savings
2,200+ stores, 35-40% staples spend and private-label ~17% drive steady high-ROI cash
Core supermarkets (2,200+ stores, 2024) and center‑store staples (35–40% household grocery spend, 2024) generate steady, high‑ROI cash flow; private‑label (~17% share, 2023) boosts margins. Fuel rewards, DC optimization and slotting funds sustain low‑risk cash generation and redeployable capital.
| Metric | 2024 | Impact |
|---|---|---|
| Stores | 2,200+ | Scale cash flow |
| Staples spend | 35–40% | Stable volume |
| Private label | ~17% (2023) | Higher margin |
What You’re Viewing Is Included
Albertsons BCG Matrix
The file you're previewing on this page is the exact BCG Matrix document you'll receive after purchase—no watermarks, no demo text, just a fully formatted, ready-to-use report. Built with market-backed analysis and clear visuals, it's presentation-ready and editable. After purchase you'll get immediate download access and the same file in your inbox, primed for strategy sessions or investor decks.











