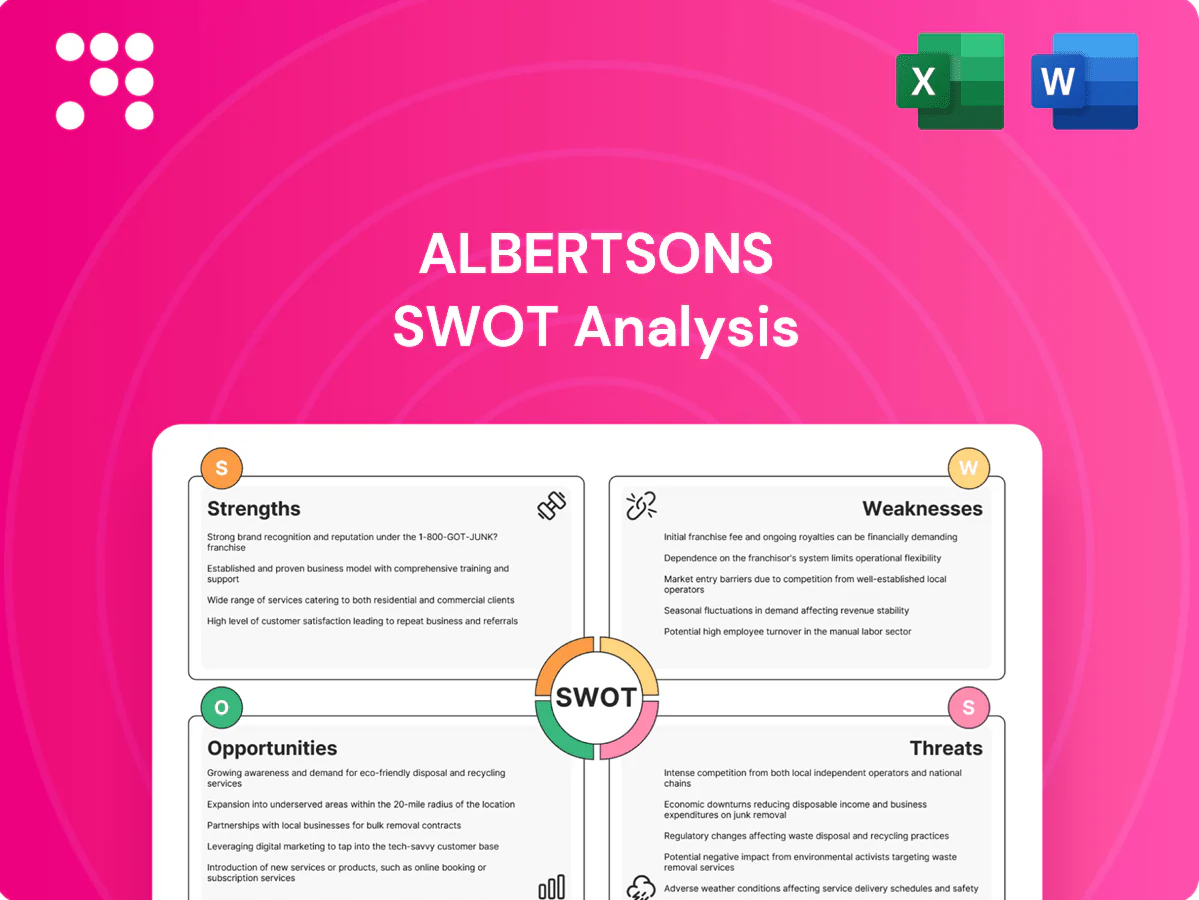
Albertsons SWOT Analysis

Your Strategic Toolkit Starts Here
Albertsons faces scale advantages, strong regional loyalty, and an expanding omnichannel footprint, but margin pressures, heavy debt, and intense competition threaten growth; regulatory and supply-chain risks add complexity. Want the full picture with strategic actions and editable tools? Purchase the complete SWOT analysis for a professional, research-backed report and Excel deliverables.
Strengths

Nationwide scale
Albertsons operates about 2,200 stores across 34 states and D.C., giving it one of the largest U.S. grocery footprints. This scale supports stronger vendor terms and larger promotional funds, helping lower COGS and fund marketing. Broad geography diversifies demand and reduces single‑market risk, while enabling national campaigns tailored through local execution.
Multi-banner portfolio
Multi-banner portfolio leverages approximately 2,200 stores across 34 states under 20+ regional banners, building local trust and loyalty. Tailored assortments and localized pricing align with neighborhood demographics to boost basket lift and retention. Brand flexibility helps defend share against regional competitors and eases market-entry and remodeling by enabling rapid rebranding and resource reallocation.

Strong private labels
Albertsons’ owned brands like Signature SELECT, O Organics and Open Nature differentiate assortment and support higher margins while offering value during inflation; private-label penetration in U.S. grocery reached about 19% in 2024 (NielsenIQ), deepening loyalty through exclusive SKUs and giving Albertsons leverage when negotiating with national suppliers.

Integrated pharmacy
Albertsons' integrated pharmacy network—over 2,200 in-store pharmacies as of 2024—drives regular foot traffic and raises basket size as prescription fill visits convert to additional grocery and OTC purchases. In-store clinics and pharmacy services boost recurring visits and customer stickiness, while aggregated prescription insights enable compliant, targeted promotions and loyalty-program personalization. Cross-sell into wellness, vitamins and OTC categories increases average transaction value.
- Pharmacies: over 2,200 locations (2024)
- Repeat visits: higher visit frequency vs non-pharmacy shoppers
- Cross-sell: increased basket size via wellness/OTC conversions
Efficient distribution
- 41 DCs
- ~2,200 stores
- Higher on-shelf availability, lower shrink
- Stronger curbside/e‑commerce fulfillment
2,200-store, 34-state grocer leverages scale, private brands and pharmacy network to boost margins
Albertsons’ ~2,200-store, 34-state footprint and 20+ regional banners deliver scale for stronger vendor terms and localized assortment. Owned brands (Signature SELECT, O Organics, Open Nature) and ~19% private-label penetration (2024, NielsenIQ) support margins. Integrated pharmacy network (~2,200 locations, 2024) and ~41 DCs boost frequency, cross-sell and fresh availability.
| Metric | Value (2024) |
|---|---|
| Stores | ~2,200 |
| Distribution centers | 41 |
| Pharmacies | ~2,200 |
| Private-label share | ~19% |
What is included in the product
 Detailed Word Document
Delivers a strategic overview of Albertsons’s internal and external business factors, outlining its strengths, weaknesses, opportunities and threats to assess competitive position and future risks.

 Customizable Excel Spreadsheet
Provides a concise Albertsons SWOT matrix for rapid identification of strengths, weaknesses, opportunities and threats, enabling executives to align strategy quickly and relieve decision-making bottlenecks.
Weaknesses

Thin margins
Grocery retail is structurally low-margin — industry operating margins typically run about 1–3%, constraining Albertsons’ strategic flexibility and capital allocation. Price investments to stay competitive (promotions, loyalty discounts) compress margins further and can turn a small market share fight into a profit hit. Small operational missteps (shrink, logistics) can rapidly erode earnings, and food-at-home inflation volatility (roughly mid-single digits in 2023–24) is hard to pass through instantly.
Debt and leverage
Historically elevated leverage constrains Albertsons’ capital allocation; as of Q2 2024 the company carried roughly $11.3 billion of total debt with a net leverage near 5.9x, limiting buybacks and reinvestment. Rising interest rates have increased financing costs and pressured net income, reducing cash available for M&A or large-scale remodels. High debt also magnifies downside risk in sales deleverage during economic slowdowns.

Digital lag vs leaders
Albertsons' e-commerce share lags giants like Walmart and Amazon, with digital sales remaining a low single-digit percentage of company sales as of 2024. App performance, delivery capacity and last-mile economics continue to strain margins and raise fulfillment costs. Customer experience must match best-in-class to retain omnichannel shoppers across Albertsons' roughly 2,200 US stores. Ongoing investments are capital intensive and required to close the gap.

Unionized labor rigidity
Unionized labor at Albertsons can constrain scheduling and operational flexibility, while contract wage and benefit escalators increase operating costs and margin pressure; negotiations carry disruption or strike risk. Albertsons reported about 270,000 employees in its 2022 Form 10-K, intensifying potential scale of labor rigidity.
- Scheduling constraints
- Escalating wage/benefit costs
- Strike/negotiation risk
- Competitors more flexible
Patchy market density
Despite operating more than 2,200 stores across 34 states as of 2024, Albertsons shows patchy market density in several regions, weakening advertising reach and increasing last-mile logistics complexity; lower density raises per-unit operating and distribution costs and allows competitors with tighter clusters to out-execute locally.
- Stores: over 2,200 (2024)
- States: 34
- Impact: higher per-unit logistics & marketing costs
- Risk: clustered competitors gain local execution advantage
Thin margins, high leverage — $11.3B, ~5.9x
Low industry margins (1–3%) and promo-led pricing compress profits; food-at-home inflation mid-single digits (2023–24) hurts pass-through. Elevated leverage (~$11.3B debt, net leverage ~5.9x Q2 2024) raises financing risk. Digital sales remain low single-digit share; ~2,200 stores across 34 states increase per-unit logistics and marketing costs.
| Metric | Value |
|---|---|
| Total debt | $11.3B (Q2 2024) |
| Net leverage | ~5.9x |
| Stores / States | ~2,200 / 34 |
| Employees | ~270,000 (2022) |
What You See Is What You Get
Albertsons SWOT Analysis
This is a real excerpt from the complete Albertsons SWOT analysis document you’ll receive upon purchase—no surprises, just professional quality. The preview below is taken directly from the full report and reflects the same structured, editable content included in your download. Buy now to unlock the entire, detailed version immediately after checkout.

Your Strategic Toolkit Starts Here
Albertsons faces scale advantages, strong regional loyalty, and an expanding omnichannel footprint, but margin pressures, heavy debt, and intense competition threaten growth; regulatory and supply-chain risks add complexity. Want the full picture with strategic actions and editable tools? Purchase the complete SWOT analysis for a professional, research-backed report and Excel deliverables.
Strengths
Nationwide scale
Albertsons operates about 2,200 stores across 34 states and D.C., giving it one of the largest U.S. grocery footprints. This scale supports stronger vendor terms and larger promotional funds, helping lower COGS and fund marketing. Broad geography diversifies demand and reduces single‑market risk, while enabling national campaigns tailored through local execution.
Multi-banner portfolio
Multi-banner portfolio leverages approximately 2,200 stores across 34 states under 20+ regional banners, building local trust and loyalty. Tailored assortments and localized pricing align with neighborhood demographics to boost basket lift and retention. Brand flexibility helps defend share against regional competitors and eases market-entry and remodeling by enabling rapid rebranding and resource reallocation.
Strong private labels
Albertsons’ owned brands like Signature SELECT, O Organics and Open Nature differentiate assortment and support higher margins while offering value during inflation; private-label penetration in U.S. grocery reached about 19% in 2024 (NielsenIQ), deepening loyalty through exclusive SKUs and giving Albertsons leverage when negotiating with national suppliers.
Integrated pharmacy
Albertsons' integrated pharmacy network—over 2,200 in-store pharmacies as of 2024—drives regular foot traffic and raises basket size as prescription fill visits convert to additional grocery and OTC purchases. In-store clinics and pharmacy services boost recurring visits and customer stickiness, while aggregated prescription insights enable compliant, targeted promotions and loyalty-program personalization. Cross-sell into wellness, vitamins and OTC categories increases average transaction value.
- Pharmacies: over 2,200 locations (2024)
- Repeat visits: higher visit frequency vs non-pharmacy shoppers
- Cross-sell: increased basket size via wellness/OTC conversions
Efficient distribution
- 41 DCs
- ~2,200 stores
- Higher on-shelf availability, lower shrink
- Stronger curbside/e‑commerce fulfillment
2,200-store, 34-state grocer leverages scale, private brands and pharmacy network to boost margins
Albertsons’ ~2,200-store, 34-state footprint and 20+ regional banners deliver scale for stronger vendor terms and localized assortment. Owned brands (Signature SELECT, O Organics, Open Nature) and ~19% private-label penetration (2024, NielsenIQ) support margins. Integrated pharmacy network (~2,200 locations, 2024) and ~41 DCs boost frequency, cross-sell and fresh availability.
| Metric | Value (2024) |
|---|---|
| Stores | ~2,200 |
| Distribution centers | 41 |
| Pharmacies | ~2,200 |
| Private-label share | ~19% |
What is included in the product
Detailed Word Document
Delivers a strategic overview of Albertsons’s internal and external business factors, outlining its strengths, weaknesses, opportunities and threats to assess competitive position and future risks.
Customizable Excel Spreadsheet
Provides a concise Albertsons SWOT matrix for rapid identification of strengths, weaknesses, opportunities and threats, enabling executives to align strategy quickly and relieve decision-making bottlenecks.
Weaknesses
Thin margins
Grocery retail is structurally low-margin — industry operating margins typically run about 1–3%, constraining Albertsons’ strategic flexibility and capital allocation. Price investments to stay competitive (promotions, loyalty discounts) compress margins further and can turn a small market share fight into a profit hit. Small operational missteps (shrink, logistics) can rapidly erode earnings, and food-at-home inflation volatility (roughly mid-single digits in 2023–24) is hard to pass through instantly.
Debt and leverage
Historically elevated leverage constrains Albertsons’ capital allocation; as of Q2 2024 the company carried roughly $11.3 billion of total debt with a net leverage near 5.9x, limiting buybacks and reinvestment. Rising interest rates have increased financing costs and pressured net income, reducing cash available for M&A or large-scale remodels. High debt also magnifies downside risk in sales deleverage during economic slowdowns.
Digital lag vs leaders
Albertsons' e-commerce share lags giants like Walmart and Amazon, with digital sales remaining a low single-digit percentage of company sales as of 2024. App performance, delivery capacity and last-mile economics continue to strain margins and raise fulfillment costs. Customer experience must match best-in-class to retain omnichannel shoppers across Albertsons' roughly 2,200 US stores. Ongoing investments are capital intensive and required to close the gap.
Unionized labor rigidity
Unionized labor at Albertsons can constrain scheduling and operational flexibility, while contract wage and benefit escalators increase operating costs and margin pressure; negotiations carry disruption or strike risk. Albertsons reported about 270,000 employees in its 2022 Form 10-K, intensifying potential scale of labor rigidity.
- Scheduling constraints
- Escalating wage/benefit costs
- Strike/negotiation risk
- Competitors more flexible
Patchy market density
Despite operating more than 2,200 stores across 34 states as of 2024, Albertsons shows patchy market density in several regions, weakening advertising reach and increasing last-mile logistics complexity; lower density raises per-unit operating and distribution costs and allows competitors with tighter clusters to out-execute locally.
- Stores: over 2,200 (2024)
- States: 34
- Impact: higher per-unit logistics & marketing costs
- Risk: clustered competitors gain local execution advantage
Thin margins, high leverage — $11.3B, ~5.9x
Low industry margins (1–3%) and promo-led pricing compress profits; food-at-home inflation mid-single digits (2023–24) hurts pass-through. Elevated leverage (~$11.3B debt, net leverage ~5.9x Q2 2024) raises financing risk. Digital sales remain low single-digit share; ~2,200 stores across 34 states increase per-unit logistics and marketing costs.
| Metric | Value |
|---|---|
| Total debt | $11.3B (Q2 2024) |
| Net leverage | ~5.9x |
| Stores / States | ~2,200 / 34 |
| Employees | ~270,000 (2022) |
What You See Is What You Get
Albertsons SWOT Analysis
This is a real excerpt from the complete Albertsons SWOT analysis document you’ll receive upon purchase—no surprises, just professional quality. The preview below is taken directly from the full report and reflects the same structured, editable content included in your download. Buy now to unlock the entire, detailed version immediately after checkout.
Original: $10.00
-65%$10.00
$3.50Description
Your Strategic Toolkit Starts Here
Albertsons faces scale advantages, strong regional loyalty, and an expanding omnichannel footprint, but margin pressures, heavy debt, and intense competition threaten growth; regulatory and supply-chain risks add complexity. Want the full picture with strategic actions and editable tools? Purchase the complete SWOT analysis for a professional, research-backed report and Excel deliverables.
Strengths
Nationwide scale
Albertsons operates about 2,200 stores across 34 states and D.C., giving it one of the largest U.S. grocery footprints. This scale supports stronger vendor terms and larger promotional funds, helping lower COGS and fund marketing. Broad geography diversifies demand and reduces single‑market risk, while enabling national campaigns tailored through local execution.
Multi-banner portfolio
Multi-banner portfolio leverages approximately 2,200 stores across 34 states under 20+ regional banners, building local trust and loyalty. Tailored assortments and localized pricing align with neighborhood demographics to boost basket lift and retention. Brand flexibility helps defend share against regional competitors and eases market-entry and remodeling by enabling rapid rebranding and resource reallocation.
Strong private labels
Albertsons’ owned brands like Signature SELECT, O Organics and Open Nature differentiate assortment and support higher margins while offering value during inflation; private-label penetration in U.S. grocery reached about 19% in 2024 (NielsenIQ), deepening loyalty through exclusive SKUs and giving Albertsons leverage when negotiating with national suppliers.
Integrated pharmacy
Albertsons' integrated pharmacy network—over 2,200 in-store pharmacies as of 2024—drives regular foot traffic and raises basket size as prescription fill visits convert to additional grocery and OTC purchases. In-store clinics and pharmacy services boost recurring visits and customer stickiness, while aggregated prescription insights enable compliant, targeted promotions and loyalty-program personalization. Cross-sell into wellness, vitamins and OTC categories increases average transaction value.
- Pharmacies: over 2,200 locations (2024)
- Repeat visits: higher visit frequency vs non-pharmacy shoppers
- Cross-sell: increased basket size via wellness/OTC conversions
Efficient distribution
- 41 DCs
- ~2,200 stores
- Higher on-shelf availability, lower shrink
- Stronger curbside/e‑commerce fulfillment
2,200-store, 34-state grocer leverages scale, private brands and pharmacy network to boost margins
Albertsons’ ~2,200-store, 34-state footprint and 20+ regional banners deliver scale for stronger vendor terms and localized assortment. Owned brands (Signature SELECT, O Organics, Open Nature) and ~19% private-label penetration (2024, NielsenIQ) support margins. Integrated pharmacy network (~2,200 locations, 2024) and ~41 DCs boost frequency, cross-sell and fresh availability.
| Metric | Value (2024) |
|---|---|
| Stores | ~2,200 |
| Distribution centers | 41 |
| Pharmacies | ~2,200 |
| Private-label share | ~19% |
What is included in the product
Detailed Word Document
Delivers a strategic overview of Albertsons’s internal and external business factors, outlining its strengths, weaknesses, opportunities and threats to assess competitive position and future risks.
Customizable Excel Spreadsheet
Provides a concise Albertsons SWOT matrix for rapid identification of strengths, weaknesses, opportunities and threats, enabling executives to align strategy quickly and relieve decision-making bottlenecks.
Weaknesses
Thin margins
Grocery retail is structurally low-margin — industry operating margins typically run about 1–3%, constraining Albertsons’ strategic flexibility and capital allocation. Price investments to stay competitive (promotions, loyalty discounts) compress margins further and can turn a small market share fight into a profit hit. Small operational missteps (shrink, logistics) can rapidly erode earnings, and food-at-home inflation volatility (roughly mid-single digits in 2023–24) is hard to pass through instantly.
Debt and leverage
Historically elevated leverage constrains Albertsons’ capital allocation; as of Q2 2024 the company carried roughly $11.3 billion of total debt with a net leverage near 5.9x, limiting buybacks and reinvestment. Rising interest rates have increased financing costs and pressured net income, reducing cash available for M&A or large-scale remodels. High debt also magnifies downside risk in sales deleverage during economic slowdowns.
Digital lag vs leaders
Albertsons' e-commerce share lags giants like Walmart and Amazon, with digital sales remaining a low single-digit percentage of company sales as of 2024. App performance, delivery capacity and last-mile economics continue to strain margins and raise fulfillment costs. Customer experience must match best-in-class to retain omnichannel shoppers across Albertsons' roughly 2,200 US stores. Ongoing investments are capital intensive and required to close the gap.
Unionized labor rigidity
Unionized labor at Albertsons can constrain scheduling and operational flexibility, while contract wage and benefit escalators increase operating costs and margin pressure; negotiations carry disruption or strike risk. Albertsons reported about 270,000 employees in its 2022 Form 10-K, intensifying potential scale of labor rigidity.
- Scheduling constraints
- Escalating wage/benefit costs
- Strike/negotiation risk
- Competitors more flexible
Patchy market density
Despite operating more than 2,200 stores across 34 states as of 2024, Albertsons shows patchy market density in several regions, weakening advertising reach and increasing last-mile logistics complexity; lower density raises per-unit operating and distribution costs and allows competitors with tighter clusters to out-execute locally.
- Stores: over 2,200 (2024)
- States: 34
- Impact: higher per-unit logistics & marketing costs
- Risk: clustered competitors gain local execution advantage
Thin margins, high leverage — $11.3B, ~5.9x
Low industry margins (1–3%) and promo-led pricing compress profits; food-at-home inflation mid-single digits (2023–24) hurts pass-through. Elevated leverage (~$11.3B debt, net leverage ~5.9x Q2 2024) raises financing risk. Digital sales remain low single-digit share; ~2,200 stores across 34 states increase per-unit logistics and marketing costs.
| Metric | Value |
|---|---|
| Total debt | $11.3B (Q2 2024) |
| Net leverage | ~5.9x |
| Stores / States | ~2,200 / 34 |
| Employees | ~270,000 (2022) |
What You See Is What You Get
Albertsons SWOT Analysis
This is a real excerpt from the complete Albertsons SWOT analysis document you’ll receive upon purchase—no surprises, just professional quality. The preview below is taken directly from the full report and reflects the same structured, editable content included in your download. Buy now to unlock the entire, detailed version immediately after checkout.











