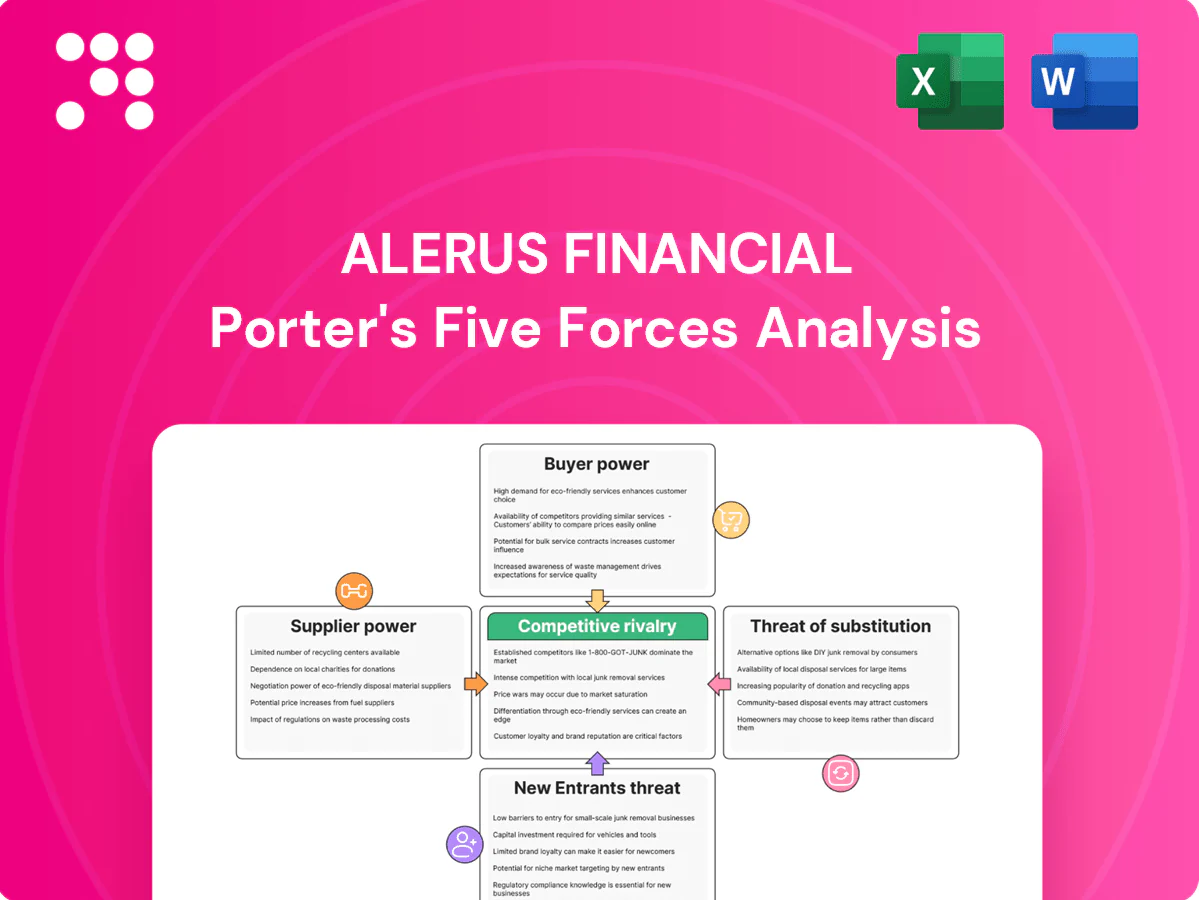
Alerus Financial Porter's Five Forces Analysis

Elevate Your Analysis with the Complete Porter's Five Forces Analysis
Alerus Financial faces moderate buyer power, regional competitive rivalry, and regulatory pressures that shape margin and growth opportunities. Our snapshot highlights key threats and strategic levers but stops short of force-by-force depth. This preview is just the beginning—unlock the full Porter's Five Forces Analysis for a complete, consultant-grade breakdown.
Suppliers Bargaining Power

Concentrated core tech vendors
Alerus relies on a handful of core banking and recordkeeping platforms, giving vendors leverage on pricing and contract terms; Alerus reported about $6.8 billion in assets in 2024, concentrating its vendor exposure. Switching cores is costly, risky, and time-consuming, often taking 12–36 months and millions in one-off costs. Vendor consolidation (top providers control >60% of US core processing in 2024) fuels take-it-or-leave-it dynamics and multi-year contracts with escalators and integration fees.
Wholesale and secured funding sources
In 2024 Alerus showed increased reliance on wholesale FHLB advances and brokered deposits when organic deposit growth lagged, exposing the bank to rapid repricing in volatile rate cycles; covenants and collateral requirements from these sources tightened funding flexibility and amplified funding-cost pass-through, putting downward pressure on net interest margins.

Payment networks and custodians
Card networks and ACH rails impose largely non‑negotiable pricing: Nilson Report 2024 shows U.S. average credit‑card interchange around 1.81% and network assessments typically $0.01–$0.30 per transaction, while Cerulli 2024 cites median retirement custody fees near 0.03%–0.08% AUM.
Interchange, network assessments and custody fees offer limited flexibility for Alerus, making participation essential to deliver complete payments and retirement products.
Volume rebates and routing optimization can shave margins, but industry data show they rarely reset unit economics materially for regional providers.

Data, credit bureaus, and regtech
Data from credit bureaus, KYC/AML vendors, and fraud-solution providers are critical inputs for Alerus; the top three US credit bureaus control roughly 90% of consumer credit files, while KYC vendor costs rose about 12% in 2024. High compliance stakes and regulatory penalties blunt supplier bargaining power, but vendor switching risks create 18–24 month implementation windows and potential regulatory gaps. Price increases are often absorbed to preserve controls and avoid compliance breaches.
- Credit bureaus ~90% market share
- KYC vendor spend +12% (2024)
- Switching timelines 18–24 months
- Price increases absorbed to maintain compliance
Specialized talent and advisors
Seasoned bankers, mortgage officers, wealth advisors and ERISA specialists command premium pay—top wealth advisors averaged roughly $200,000 total compensation in 2024—driving higher personnel expense for Alerus.
Tight 2024 labor markets produced ~4–5% wage inflation in financial services and a reported 20% rise in retention bonuses, elevating supplier leverage.
Client relationships tied to individuals increase switching costs; recruiting, onboarding and replacement costs (often 100–150% of annual salary for senior hires) reinforce supplier power.
- Premium pay: top advisors ≈ $200k (2024)
- Wage pressure: ≈ 4–5% industry wage growth (2024)
- Retention costs: bonuses +20% (2024)
- Replacement cost: 100–150% of salary
Vendor concentration >60%, 12–36 month switching, repricing risk for $6.8B
Alerus faces high supplier leverage: concentrated core vendors (>60% US core in 2024) and switching costs of 12–36 months; reported assets $6.8B (2024) concentrate exposure. Funding via FHLB/brokered deposits raises repricing risk. Payment and custody fees are largely non‑negotiable (interchange 1.81%, custody 0.03–0.08% AUM) while credit bureaus ~90% share and KYC costs +12% (2024).
| Metric | 2024 |
|---|---|
| Assets | $6.8B |
| Core vendor share | >60% |
| Switching time | 12–36 months |
| Interchange | 1.81% |
| Credit bureaus | ~90% |
| KYC cost change | +12% |
What is included in the product
 Detailed Word Document
Concise Porter's Five Forces analysis for Alerus Financial identifying competitive rivalry, buyer and supplier leverage, threat of new entrants and substitutes, and emerging disruptive trends impacting margins and growth. Actionable insights highlight defensive moats and strategic opportunities to strengthen market position.

 Customizable Excel Spreadsheet
A one-sheet Porter's Five Forces for Alerus Financial that clarifies competitive pressures and lets you tweak force levels, export clean radar charts for decks, and plug in your own data—no macros required, perfect for fast strategic decisions and boardroom-ready summaries.
Customers Bargaining Power

Rate-sensitive depositors
Rate-sensitive depositors pressure Alerus as consumers and businesses compare rates instantly and shift funds digitally, with top online banks offering up to about 4.5% APY on savings in 2024. High-yield entrants increase price transparency, forcing regional players to match offers or lose deposits. Deposit betas rose toward roughly 30–40% in 2023–24 as competitors bid up costs. Loyalty programs mitigate but do not eliminate churn.
Mortgage borrowers with refinance options
Mortgage borrowers with refinance options exert high bargaining power for Alerus as origination customers shop banks, IMBs and brokers; in 2024, with 30-year rates around 7% small pricing spreads of a few tenths of a percent meaningfully sway volume. Digital pre-approval and e-closing adoption accelerated in 2024, lowering switching friction and shortening decision cycles. Cyclical demand means lenders make larger concessions in slow markets to retain share.

Plan sponsors running RFPs
Retirement plan sponsors running structured RFPs focus sharply on fees, service and technology, with median total plan costs around 0.50% of assets (industry 2023–24 data). Benchmarking databases make offerings highly comparable, increasing negotiation leverage. Heightened fiduciary scrutiny drives price pressure, while bundled services only win when tied to measurable outcomes and documented value.

Wealth clients demanding tailored value
Wealth clients increasingly negotiate advisory fees, often pushing rates toward 0.5%–1.0% for high-touch relationships. Low-cost ETFs (expense ratios as low as 0.03%) and robo platforms (~0.25% fees) anchor fee expectations. Performance and tax efficiency drive retention, while multi-custody access and open-architecture custodians increase portability and switching.
- Fee pressure: negotiated 0.5%–1.0%
- Cost anchors: ETFs ~0.03%, robos ~0.25%
- Retention: after-tax performance focus
- Portability: multi-custody increases switching
SMB and middle-market treasurers
SMB and middle-market treasurers exert strong bargaining power by dual-banking and unbundling services across providers; API-enabled cash management has materially lowered switching friction, though implementation effort still constrains rapid migration. Volume pricing and SLA negotiations are standard, pressuring margins and pushing Alerus to emphasize integration ease and bespoke pricing.
- dual-banking common
- APIs lower switching friction
- implementation effort shrinking
- volume pricing & SLAs negotiated
Customers drive pricing: rate-sensitive deposits, mortgage churn and fee pressure
Customers hold strong bargaining power across deposits, lending, retirement and wealth: rate-sensitive depositors compare up to 4.5% APY, deposit betas ~30–40% (2023–24). Mortgage shoppers react to ~7% 30-yr rates, switching on few-tenths pricing moves. Plan sponsors benchmark fees ~0.50%; wealth clients push advisory fees to 0.5–1.0% vs ETFs 0.03 and robos ~0.25.
| Metric | 2023–24 Value |
|---|---|
| Top savings APY | ~4.5% |
| Deposit beta | 30–40% |
| 30-yr mortgage | ~7% |
| Median plan cost | ~0.50% |
| ETF / robo fees | 0.03 / 0.25% |
| Advisory fees | 0.5–1.0% |
What You See Is What You Get
Alerus Financial Porter's Five Forces Analysis
This preview shows the exact Alerus Financial Porter's Five Forces analysis you'll receive immediately after purchase—no surprises, no placeholders. It is the same professionally written, fully formatted document ready for download and immediate use. You're viewing the final version and will get instant access to this exact file upon payment.

Elevate Your Analysis with the Complete Porter's Five Forces Analysis
Alerus Financial faces moderate buyer power, regional competitive rivalry, and regulatory pressures that shape margin and growth opportunities. Our snapshot highlights key threats and strategic levers but stops short of force-by-force depth. This preview is just the beginning—unlock the full Porter's Five Forces Analysis for a complete, consultant-grade breakdown.
Suppliers Bargaining Power
Concentrated core tech vendors
Alerus relies on a handful of core banking and recordkeeping platforms, giving vendors leverage on pricing and contract terms; Alerus reported about $6.8 billion in assets in 2024, concentrating its vendor exposure. Switching cores is costly, risky, and time-consuming, often taking 12–36 months and millions in one-off costs. Vendor consolidation (top providers control >60% of US core processing in 2024) fuels take-it-or-leave-it dynamics and multi-year contracts with escalators and integration fees.
Wholesale and secured funding sources
In 2024 Alerus showed increased reliance on wholesale FHLB advances and brokered deposits when organic deposit growth lagged, exposing the bank to rapid repricing in volatile rate cycles; covenants and collateral requirements from these sources tightened funding flexibility and amplified funding-cost pass-through, putting downward pressure on net interest margins.
Payment networks and custodians
Card networks and ACH rails impose largely non‑negotiable pricing: Nilson Report 2024 shows U.S. average credit‑card interchange around 1.81% and network assessments typically $0.01–$0.30 per transaction, while Cerulli 2024 cites median retirement custody fees near 0.03%–0.08% AUM.
Interchange, network assessments and custody fees offer limited flexibility for Alerus, making participation essential to deliver complete payments and retirement products.
Volume rebates and routing optimization can shave margins, but industry data show they rarely reset unit economics materially for regional providers.
Data, credit bureaus, and regtech
Data from credit bureaus, KYC/AML vendors, and fraud-solution providers are critical inputs for Alerus; the top three US credit bureaus control roughly 90% of consumer credit files, while KYC vendor costs rose about 12% in 2024. High compliance stakes and regulatory penalties blunt supplier bargaining power, but vendor switching risks create 18–24 month implementation windows and potential regulatory gaps. Price increases are often absorbed to preserve controls and avoid compliance breaches.
- Credit bureaus ~90% market share
- KYC vendor spend +12% (2024)
- Switching timelines 18–24 months
- Price increases absorbed to maintain compliance
Specialized talent and advisors
Seasoned bankers, mortgage officers, wealth advisors and ERISA specialists command premium pay—top wealth advisors averaged roughly $200,000 total compensation in 2024—driving higher personnel expense for Alerus.
Tight 2024 labor markets produced ~4–5% wage inflation in financial services and a reported 20% rise in retention bonuses, elevating supplier leverage.
Client relationships tied to individuals increase switching costs; recruiting, onboarding and replacement costs (often 100–150% of annual salary for senior hires) reinforce supplier power.
- Premium pay: top advisors ≈ $200k (2024)
- Wage pressure: ≈ 4–5% industry wage growth (2024)
- Retention costs: bonuses +20% (2024)
- Replacement cost: 100–150% of salary
Vendor concentration >60%, 12–36 month switching, repricing risk for $6.8B
Alerus faces high supplier leverage: concentrated core vendors (>60% US core in 2024) and switching costs of 12–36 months; reported assets $6.8B (2024) concentrate exposure. Funding via FHLB/brokered deposits raises repricing risk. Payment and custody fees are largely non‑negotiable (interchange 1.81%, custody 0.03–0.08% AUM) while credit bureaus ~90% share and KYC costs +12% (2024).
| Metric | 2024 |
|---|---|
| Assets | $6.8B |
| Core vendor share | >60% |
| Switching time | 12–36 months |
| Interchange | 1.81% |
| Credit bureaus | ~90% |
| KYC cost change | +12% |
What is included in the product
Detailed Word Document
Concise Porter's Five Forces analysis for Alerus Financial identifying competitive rivalry, buyer and supplier leverage, threat of new entrants and substitutes, and emerging disruptive trends impacting margins and growth. Actionable insights highlight defensive moats and strategic opportunities to strengthen market position.
Customizable Excel Spreadsheet
A one-sheet Porter's Five Forces for Alerus Financial that clarifies competitive pressures and lets you tweak force levels, export clean radar charts for decks, and plug in your own data—no macros required, perfect for fast strategic decisions and boardroom-ready summaries.
Customers Bargaining Power
Rate-sensitive depositors
Rate-sensitive depositors pressure Alerus as consumers and businesses compare rates instantly and shift funds digitally, with top online banks offering up to about 4.5% APY on savings in 2024. High-yield entrants increase price transparency, forcing regional players to match offers or lose deposits. Deposit betas rose toward roughly 30–40% in 2023–24 as competitors bid up costs. Loyalty programs mitigate but do not eliminate churn.
Mortgage borrowers with refinance options
Mortgage borrowers with refinance options exert high bargaining power for Alerus as origination customers shop banks, IMBs and brokers; in 2024, with 30-year rates around 7% small pricing spreads of a few tenths of a percent meaningfully sway volume. Digital pre-approval and e-closing adoption accelerated in 2024, lowering switching friction and shortening decision cycles. Cyclical demand means lenders make larger concessions in slow markets to retain share.
Plan sponsors running RFPs
Retirement plan sponsors running structured RFPs focus sharply on fees, service and technology, with median total plan costs around 0.50% of assets (industry 2023–24 data). Benchmarking databases make offerings highly comparable, increasing negotiation leverage. Heightened fiduciary scrutiny drives price pressure, while bundled services only win when tied to measurable outcomes and documented value.
Wealth clients demanding tailored value
Wealth clients increasingly negotiate advisory fees, often pushing rates toward 0.5%–1.0% for high-touch relationships. Low-cost ETFs (expense ratios as low as 0.03%) and robo platforms (~0.25% fees) anchor fee expectations. Performance and tax efficiency drive retention, while multi-custody access and open-architecture custodians increase portability and switching.
- Fee pressure: negotiated 0.5%–1.0%
- Cost anchors: ETFs ~0.03%, robos ~0.25%
- Retention: after-tax performance focus
- Portability: multi-custody increases switching
SMB and middle-market treasurers
SMB and middle-market treasurers exert strong bargaining power by dual-banking and unbundling services across providers; API-enabled cash management has materially lowered switching friction, though implementation effort still constrains rapid migration. Volume pricing and SLA negotiations are standard, pressuring margins and pushing Alerus to emphasize integration ease and bespoke pricing.
- dual-banking common
- APIs lower switching friction
- implementation effort shrinking
- volume pricing & SLAs negotiated
Customers drive pricing: rate-sensitive deposits, mortgage churn and fee pressure
Customers hold strong bargaining power across deposits, lending, retirement and wealth: rate-sensitive depositors compare up to 4.5% APY, deposit betas ~30–40% (2023–24). Mortgage shoppers react to ~7% 30-yr rates, switching on few-tenths pricing moves. Plan sponsors benchmark fees ~0.50%; wealth clients push advisory fees to 0.5–1.0% vs ETFs 0.03 and robos ~0.25.
| Metric | 2023–24 Value |
|---|---|
| Top savings APY | ~4.5% |
| Deposit beta | 30–40% |
| 30-yr mortgage | ~7% |
| Median plan cost | ~0.50% |
| ETF / robo fees | 0.03 / 0.25% |
| Advisory fees | 0.5–1.0% |
What You See Is What You Get
Alerus Financial Porter's Five Forces Analysis
This preview shows the exact Alerus Financial Porter's Five Forces analysis you'll receive immediately after purchase—no surprises, no placeholders. It is the same professionally written, fully formatted document ready for download and immediate use. You're viewing the final version and will get instant access to this exact file upon payment.
Original: $10.00
-65%$10.00
$3.50Description
Elevate Your Analysis with the Complete Porter's Five Forces Analysis
Alerus Financial faces moderate buyer power, regional competitive rivalry, and regulatory pressures that shape margin and growth opportunities. Our snapshot highlights key threats and strategic levers but stops short of force-by-force depth. This preview is just the beginning—unlock the full Porter's Five Forces Analysis for a complete, consultant-grade breakdown.
Suppliers Bargaining Power
Concentrated core tech vendors
Alerus relies on a handful of core banking and recordkeeping platforms, giving vendors leverage on pricing and contract terms; Alerus reported about $6.8 billion in assets in 2024, concentrating its vendor exposure. Switching cores is costly, risky, and time-consuming, often taking 12–36 months and millions in one-off costs. Vendor consolidation (top providers control >60% of US core processing in 2024) fuels take-it-or-leave-it dynamics and multi-year contracts with escalators and integration fees.
Wholesale and secured funding sources
In 2024 Alerus showed increased reliance on wholesale FHLB advances and brokered deposits when organic deposit growth lagged, exposing the bank to rapid repricing in volatile rate cycles; covenants and collateral requirements from these sources tightened funding flexibility and amplified funding-cost pass-through, putting downward pressure on net interest margins.
Payment networks and custodians
Card networks and ACH rails impose largely non‑negotiable pricing: Nilson Report 2024 shows U.S. average credit‑card interchange around 1.81% and network assessments typically $0.01–$0.30 per transaction, while Cerulli 2024 cites median retirement custody fees near 0.03%–0.08% AUM.
Interchange, network assessments and custody fees offer limited flexibility for Alerus, making participation essential to deliver complete payments and retirement products.
Volume rebates and routing optimization can shave margins, but industry data show they rarely reset unit economics materially for regional providers.
Data, credit bureaus, and regtech
Data from credit bureaus, KYC/AML vendors, and fraud-solution providers are critical inputs for Alerus; the top three US credit bureaus control roughly 90% of consumer credit files, while KYC vendor costs rose about 12% in 2024. High compliance stakes and regulatory penalties blunt supplier bargaining power, but vendor switching risks create 18–24 month implementation windows and potential regulatory gaps. Price increases are often absorbed to preserve controls and avoid compliance breaches.
- Credit bureaus ~90% market share
- KYC vendor spend +12% (2024)
- Switching timelines 18–24 months
- Price increases absorbed to maintain compliance
Specialized talent and advisors
Seasoned bankers, mortgage officers, wealth advisors and ERISA specialists command premium pay—top wealth advisors averaged roughly $200,000 total compensation in 2024—driving higher personnel expense for Alerus.
Tight 2024 labor markets produced ~4–5% wage inflation in financial services and a reported 20% rise in retention bonuses, elevating supplier leverage.
Client relationships tied to individuals increase switching costs; recruiting, onboarding and replacement costs (often 100–150% of annual salary for senior hires) reinforce supplier power.
- Premium pay: top advisors ≈ $200k (2024)
- Wage pressure: ≈ 4–5% industry wage growth (2024)
- Retention costs: bonuses +20% (2024)
- Replacement cost: 100–150% of salary
Vendor concentration >60%, 12–36 month switching, repricing risk for $6.8B
Alerus faces high supplier leverage: concentrated core vendors (>60% US core in 2024) and switching costs of 12–36 months; reported assets $6.8B (2024) concentrate exposure. Funding via FHLB/brokered deposits raises repricing risk. Payment and custody fees are largely non‑negotiable (interchange 1.81%, custody 0.03–0.08% AUM) while credit bureaus ~90% share and KYC costs +12% (2024).
| Metric | 2024 |
|---|---|
| Assets | $6.8B |
| Core vendor share | >60% |
| Switching time | 12–36 months |
| Interchange | 1.81% |
| Credit bureaus | ~90% |
| KYC cost change | +12% |
What is included in the product
Detailed Word Document
Concise Porter's Five Forces analysis for Alerus Financial identifying competitive rivalry, buyer and supplier leverage, threat of new entrants and substitutes, and emerging disruptive trends impacting margins and growth. Actionable insights highlight defensive moats and strategic opportunities to strengthen market position.
Customizable Excel Spreadsheet
A one-sheet Porter's Five Forces for Alerus Financial that clarifies competitive pressures and lets you tweak force levels, export clean radar charts for decks, and plug in your own data—no macros required, perfect for fast strategic decisions and boardroom-ready summaries.
Customers Bargaining Power
Rate-sensitive depositors
Rate-sensitive depositors pressure Alerus as consumers and businesses compare rates instantly and shift funds digitally, with top online banks offering up to about 4.5% APY on savings in 2024. High-yield entrants increase price transparency, forcing regional players to match offers or lose deposits. Deposit betas rose toward roughly 30–40% in 2023–24 as competitors bid up costs. Loyalty programs mitigate but do not eliminate churn.
Mortgage borrowers with refinance options
Mortgage borrowers with refinance options exert high bargaining power for Alerus as origination customers shop banks, IMBs and brokers; in 2024, with 30-year rates around 7% small pricing spreads of a few tenths of a percent meaningfully sway volume. Digital pre-approval and e-closing adoption accelerated in 2024, lowering switching friction and shortening decision cycles. Cyclical demand means lenders make larger concessions in slow markets to retain share.
Plan sponsors running RFPs
Retirement plan sponsors running structured RFPs focus sharply on fees, service and technology, with median total plan costs around 0.50% of assets (industry 2023–24 data). Benchmarking databases make offerings highly comparable, increasing negotiation leverage. Heightened fiduciary scrutiny drives price pressure, while bundled services only win when tied to measurable outcomes and documented value.
Wealth clients demanding tailored value
Wealth clients increasingly negotiate advisory fees, often pushing rates toward 0.5%–1.0% for high-touch relationships. Low-cost ETFs (expense ratios as low as 0.03%) and robo platforms (~0.25% fees) anchor fee expectations. Performance and tax efficiency drive retention, while multi-custody access and open-architecture custodians increase portability and switching.
- Fee pressure: negotiated 0.5%–1.0%
- Cost anchors: ETFs ~0.03%, robos ~0.25%
- Retention: after-tax performance focus
- Portability: multi-custody increases switching
SMB and middle-market treasurers
SMB and middle-market treasurers exert strong bargaining power by dual-banking and unbundling services across providers; API-enabled cash management has materially lowered switching friction, though implementation effort still constrains rapid migration. Volume pricing and SLA negotiations are standard, pressuring margins and pushing Alerus to emphasize integration ease and bespoke pricing.
- dual-banking common
- APIs lower switching friction
- implementation effort shrinking
- volume pricing & SLAs negotiated
Customers drive pricing: rate-sensitive deposits, mortgage churn and fee pressure
Customers hold strong bargaining power across deposits, lending, retirement and wealth: rate-sensitive depositors compare up to 4.5% APY, deposit betas ~30–40% (2023–24). Mortgage shoppers react to ~7% 30-yr rates, switching on few-tenths pricing moves. Plan sponsors benchmark fees ~0.50%; wealth clients push advisory fees to 0.5–1.0% vs ETFs 0.03 and robos ~0.25.
| Metric | 2023–24 Value |
|---|---|
| Top savings APY | ~4.5% |
| Deposit beta | 30–40% |
| 30-yr mortgage | ~7% |
| Median plan cost | ~0.50% |
| ETF / robo fees | 0.03 / 0.25% |
| Advisory fees | 0.5–1.0% |
What You See Is What You Get
Alerus Financial Porter's Five Forces Analysis
This preview shows the exact Alerus Financial Porter's Five Forces analysis you'll receive immediately after purchase—no surprises, no placeholders. It is the same professionally written, fully formatted document ready for download and immediate use. You're viewing the final version and will get instant access to this exact file upon payment.











