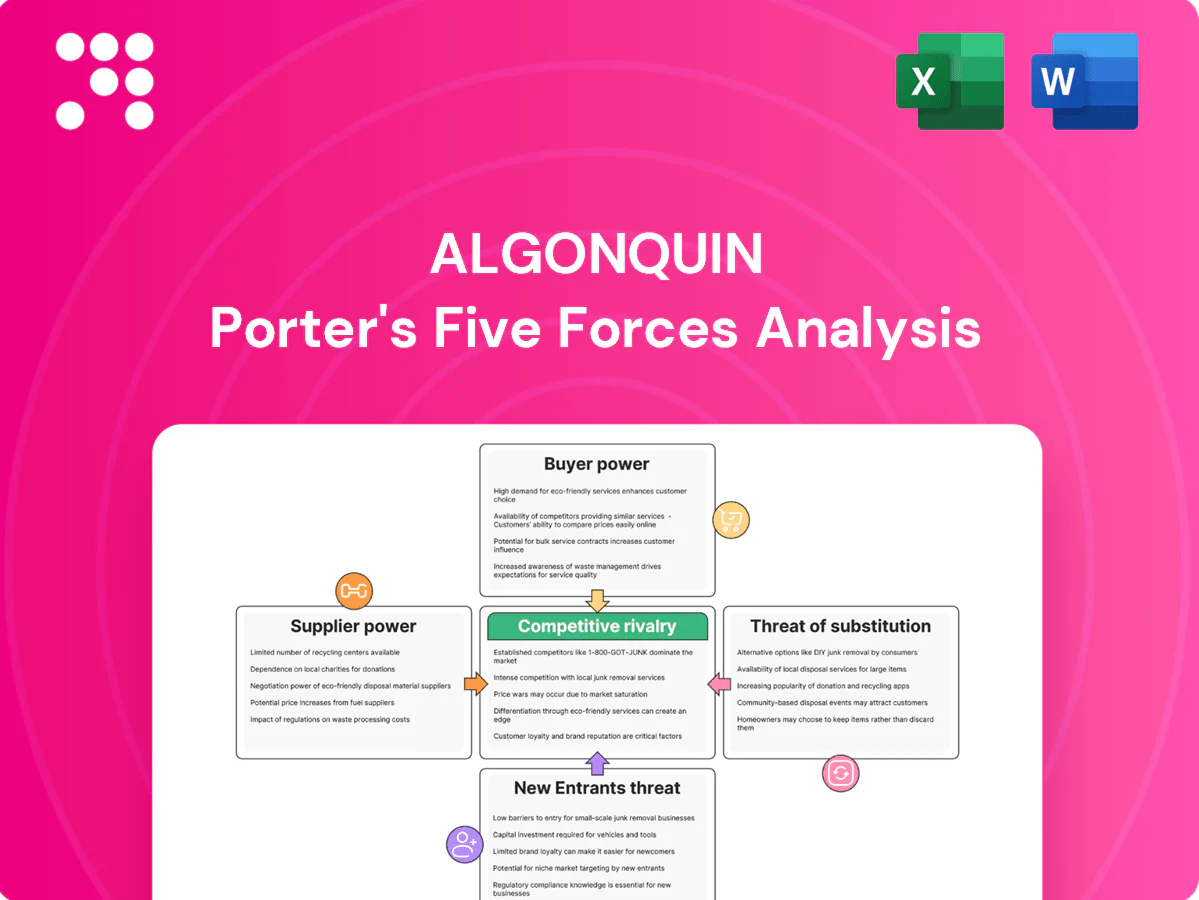
Algonquin Porter's Five Forces Analysis

Don't Miss the Bigger Picture
Algonquin's Porter's Five Forces snapshot highlights competitive rivalry, supplier and buyer leverage, threat of entrants and substitutes, and regulatory pressures in concise terms. This summary points to where risks and advantages cluster. Want the full, data-driven force-by-force ratings and visuals? Unlock the complete analysis for actionable strategy and investment insights.
Suppliers Bargaining Power

Concentrated renewable OEMs
Wind, solar and hydro equipment are concentrated: the top three wind OEMs account for about 60% of global turbine shipments and leading inverter suppliers similarly dominate ~60% of the market (2023–24), boosting switching costs and delivery risk. Turbine and inverter backlogs in 2023–24 tightened terms and pushed pricing; turbine lead times commonly range 12–24 months, inverters 3–9 months, giving OEMs leverage on warranties and service. APUC mitigates risk through multi-vendor procurement frameworks and component standardization to lower dependency and compress delivery risk.
Fuel and EPC contract leverage
Gas suppliers and EPC partners can push on price and schedule, with long-term fuel and turnkey contracts through 2024 reducing spot volatility but embedding escalation clauses that shift cost risk over time. Market shocks, notably the 2022–23 gas basis volatility, have historically passed through to owners and strained working capital. Diversified counterparties and active hedging programs temper exposure and cash-flow variability.

Grid interconnection bottlenecks
Transmission operators and ISOs act as gatekeepers, controlling queue positions and studies; US interconnection queues exceeded 1,200 GW in 2024, concentrating leverage with operators. Interconnection upgrades and multi-year timelines can materially increase project costs and delay COD by several years. Queue congestion raises uncertainty and strengthens supplier leverage; early-stage diligence and paying for upgrades can improve position, but bargaining power remains limited.

Specialized labor and unions
Utility operations and renewable O&M depend on skilled, often unionized labor; US union membership was 10.1% in 2023 (BLS), and a 3.5% 2023 unemployment rate tightened labor supply, increasing wage pressure and overtime costs while safety/reliability rules restrict outsourcing flexibility.
- Skilled labor dependence
- 10.1% US union rate (2023)
- Tight labor market: 3.5% unemployment (2023)
- Safety limits outsourcing
- Workforce development and multi-year agreements stabilize costs
Chemicals, parts, and spares
- Lead times: 6–12 months (2024)
- Inventory buffer: 60–90 days
- Mitigation: framework agreements, strategic stocking
- Risk: bespoke legacy parts keep supplier leverage
Supplier concentration tightens wind project pricing and warranties; long lead times squeeze margins
Suppliers hold elevated leverage: top-3 wind OEMs ~60% and leading inverter suppliers ~60% (2023–24), with turbine lead times 12–24m and inverters 3–9m, tightening pricing and warranty terms. Transformer lead times 6–12m (2024) and specialized spares sustain supplier power; multi-vendor frameworks and 60–90d inventory buffers partially mitigate risk.
| Supplier | Concentration | Lead time | Impact |
|---|---|---|---|
| Wind OEMs | ~60% | 12–24m | High |
| Inverters | ~60% | 3–9m | High |
| Transformers | — | 6–12m | Medium |
What is included in the product
 Detailed Word Document
Tailored Porter's Five Forces analysis for Algonquin that uncovers competitive dynamics, supplier and buyer power, threat of substitutes and new entrants, and strategic pressures shaping pricing, profitability and market positioning.

 Customizable Excel Spreadsheet
Quickly diagnose and relieve strategic pain by mapping Algonquin’s Porter's Five Forces on a clean, one-sheet template—customize pressure levels, swap in your data, and export straight to pitch decks without macros or coding.
Customers Bargaining Power

Regulators as proxy buyers
Regulators act as proxy buyers, setting allowed returns, tariffs and service quality, shaping Algonquin's economics more than end-users. Rate cases and prudency reviews (2024 filings) constrain pricing power and recovery timelines, with allowed ROEs typically 8–10% in many US jurisdictions in 2024. Stable frameworks reduce volatility but cap upside; constructive jurisdictions balance utility recovery with customer affordability.
Captive residential customers
Captive residential customers face near-zero switching under franchise monopolies, so volume risk is limited; short-run residential price elasticity is around -0.1, constraining demand response to price. Affordability programs and revenue decoupling mechanisms can smooth margins and separate sales from recovery. Customer satisfaction and reliability metrics are increasingly tied to regulatory incentive mechanisms, affecting allowed returns and riders.

Large C&I and municipal accounts
Large C&I and municipal accounts can negotiate demand charges, interruptible rates, or distributed-energy solutions, raising churn and self-generation risk as their concentrated load can represent a material portion of local portfolios; 2024 company disclosures show aggressive custom contracting pressures margins but often secure multi‑year relationships, while behind‑the‑meter offers in 2024 aligned incentives to reduce outage risk and retain load.

PPA offtakers in renewables
Corporate and utility offtakers run competitive tenders that have driven median US corporate/utility solar PPA levels to roughly $25–35/MWh in 2024 (LevelTen), compressing margins. Standardized contracts and deep bidder pools increase buyer leverage, while creditworthy offtakers lower financing costs and insist on strict performance and credit terms. Algonquin mitigates counterparty concentration via portfolio diversification across geographies and offtaker types.
- Competitive tenders: lower PPA prices (median $25–35/MWh, 2024)
- Standardization + bidders: stronger buyer bargaining power
- Creditworthy buyers: cheaper financing, tighter contract terms
- Diversification: reduces single-counterparty exposure
Community choice and aggregation
Aggregators and community programs materially influence supply mix and price, with US community solar capacity surpassing 5 GW in 2024, giving aggregators leverage to shift economics away from default service.
They can shift load off incumbent supply, reducing volumes and increasing margin pressure; procurement cycles (typically 1–5 years) introduce repricing risk for utilities.
Offering green tariffs and community solar options has proven effective at retaining load by matching aggregation offers and renewable demand.
ROE 8-10%, PPAs $25-35/MWh, > 5 GW hit
Regulators drive pricing (allowed ROE ~8–10% in many US jurisdictions, 2024), limiting upside; captive residential demand has near-zero switching with short‑run elasticity ≈ -0.1. Corporate/utility PPAs compressed margins (median $25–35/MWh, 2024). Community solar >5 GW (2024) and 1–5 year procurement cycles raise repricing and load‑migration risk.
| Item | 2024 Metric | Impact |
|---|---|---|
| Allowed ROE | 8–10% | Capped returns |
| PPA price | $25–35/MWh | Margin compression |
| Community solar | >5 GW | Customer churn |
| Elasticity | -0.1 | Low price response |
Same Document Delivered
Algonquin Porter's Five Forces Analysis
This preview shows the exact Algonquin Porter's Five Forces analysis you'll receive immediately after purchase—no mockups, no placeholders. The file is the full, professionally formatted document ready for download and use the moment you buy, containing the complete competitive assessment, supporting rationale, and concise implications. What you see is what you'll get, instantly accessible with no further setup required.

Don't Miss the Bigger Picture
Algonquin's Porter's Five Forces snapshot highlights competitive rivalry, supplier and buyer leverage, threat of entrants and substitutes, and regulatory pressures in concise terms. This summary points to where risks and advantages cluster. Want the full, data-driven force-by-force ratings and visuals? Unlock the complete analysis for actionable strategy and investment insights.
Suppliers Bargaining Power
Concentrated renewable OEMs
Wind, solar and hydro equipment are concentrated: the top three wind OEMs account for about 60% of global turbine shipments and leading inverter suppliers similarly dominate ~60% of the market (2023–24), boosting switching costs and delivery risk. Turbine and inverter backlogs in 2023–24 tightened terms and pushed pricing; turbine lead times commonly range 12–24 months, inverters 3–9 months, giving OEMs leverage on warranties and service. APUC mitigates risk through multi-vendor procurement frameworks and component standardization to lower dependency and compress delivery risk.
Fuel and EPC contract leverage
Gas suppliers and EPC partners can push on price and schedule, with long-term fuel and turnkey contracts through 2024 reducing spot volatility but embedding escalation clauses that shift cost risk over time. Market shocks, notably the 2022–23 gas basis volatility, have historically passed through to owners and strained working capital. Diversified counterparties and active hedging programs temper exposure and cash-flow variability.
Grid interconnection bottlenecks
Transmission operators and ISOs act as gatekeepers, controlling queue positions and studies; US interconnection queues exceeded 1,200 GW in 2024, concentrating leverage with operators. Interconnection upgrades and multi-year timelines can materially increase project costs and delay COD by several years. Queue congestion raises uncertainty and strengthens supplier leverage; early-stage diligence and paying for upgrades can improve position, but bargaining power remains limited.
Specialized labor and unions
Utility operations and renewable O&M depend on skilled, often unionized labor; US union membership was 10.1% in 2023 (BLS), and a 3.5% 2023 unemployment rate tightened labor supply, increasing wage pressure and overtime costs while safety/reliability rules restrict outsourcing flexibility.
- Skilled labor dependence
- 10.1% US union rate (2023)
- Tight labor market: 3.5% unemployment (2023)
- Safety limits outsourcing
- Workforce development and multi-year agreements stabilize costs
Chemicals, parts, and spares
- Lead times: 6–12 months (2024)
- Inventory buffer: 60–90 days
- Mitigation: framework agreements, strategic stocking
- Risk: bespoke legacy parts keep supplier leverage
Supplier concentration tightens wind project pricing and warranties; long lead times squeeze margins
Suppliers hold elevated leverage: top-3 wind OEMs ~60% and leading inverter suppliers ~60% (2023–24), with turbine lead times 12–24m and inverters 3–9m, tightening pricing and warranty terms. Transformer lead times 6–12m (2024) and specialized spares sustain supplier power; multi-vendor frameworks and 60–90d inventory buffers partially mitigate risk.
| Supplier | Concentration | Lead time | Impact |
|---|---|---|---|
| Wind OEMs | ~60% | 12–24m | High |
| Inverters | ~60% | 3–9m | High |
| Transformers | — | 6–12m | Medium |
What is included in the product
Detailed Word Document
Tailored Porter's Five Forces analysis for Algonquin that uncovers competitive dynamics, supplier and buyer power, threat of substitutes and new entrants, and strategic pressures shaping pricing, profitability and market positioning.
Customizable Excel Spreadsheet
Quickly diagnose and relieve strategic pain by mapping Algonquin’s Porter's Five Forces on a clean, one-sheet template—customize pressure levels, swap in your data, and export straight to pitch decks without macros or coding.
Customers Bargaining Power
Regulators as proxy buyers
Regulators act as proxy buyers, setting allowed returns, tariffs and service quality, shaping Algonquin's economics more than end-users. Rate cases and prudency reviews (2024 filings) constrain pricing power and recovery timelines, with allowed ROEs typically 8–10% in many US jurisdictions in 2024. Stable frameworks reduce volatility but cap upside; constructive jurisdictions balance utility recovery with customer affordability.
Captive residential customers
Captive residential customers face near-zero switching under franchise monopolies, so volume risk is limited; short-run residential price elasticity is around -0.1, constraining demand response to price. Affordability programs and revenue decoupling mechanisms can smooth margins and separate sales from recovery. Customer satisfaction and reliability metrics are increasingly tied to regulatory incentive mechanisms, affecting allowed returns and riders.
Large C&I and municipal accounts
Large C&I and municipal accounts can negotiate demand charges, interruptible rates, or distributed-energy solutions, raising churn and self-generation risk as their concentrated load can represent a material portion of local portfolios; 2024 company disclosures show aggressive custom contracting pressures margins but often secure multi‑year relationships, while behind‑the‑meter offers in 2024 aligned incentives to reduce outage risk and retain load.
PPA offtakers in renewables
Corporate and utility offtakers run competitive tenders that have driven median US corporate/utility solar PPA levels to roughly $25–35/MWh in 2024 (LevelTen), compressing margins. Standardized contracts and deep bidder pools increase buyer leverage, while creditworthy offtakers lower financing costs and insist on strict performance and credit terms. Algonquin mitigates counterparty concentration via portfolio diversification across geographies and offtaker types.
- Competitive tenders: lower PPA prices (median $25–35/MWh, 2024)
- Standardization + bidders: stronger buyer bargaining power
- Creditworthy buyers: cheaper financing, tighter contract terms
- Diversification: reduces single-counterparty exposure
Community choice and aggregation
Aggregators and community programs materially influence supply mix and price, with US community solar capacity surpassing 5 GW in 2024, giving aggregators leverage to shift economics away from default service.
They can shift load off incumbent supply, reducing volumes and increasing margin pressure; procurement cycles (typically 1–5 years) introduce repricing risk for utilities.
Offering green tariffs and community solar options has proven effective at retaining load by matching aggregation offers and renewable demand.
ROE 8-10%, PPAs $25-35/MWh, > 5 GW hit
Regulators drive pricing (allowed ROE ~8–10% in many US jurisdictions, 2024), limiting upside; captive residential demand has near-zero switching with short‑run elasticity ≈ -0.1. Corporate/utility PPAs compressed margins (median $25–35/MWh, 2024). Community solar >5 GW (2024) and 1–5 year procurement cycles raise repricing and load‑migration risk.
| Item | 2024 Metric | Impact |
|---|---|---|
| Allowed ROE | 8–10% | Capped returns |
| PPA price | $25–35/MWh | Margin compression |
| Community solar | >5 GW | Customer churn |
| Elasticity | -0.1 | Low price response |
Same Document Delivered
Algonquin Porter's Five Forces Analysis
This preview shows the exact Algonquin Porter's Five Forces analysis you'll receive immediately after purchase—no mockups, no placeholders. The file is the full, professionally formatted document ready for download and use the moment you buy, containing the complete competitive assessment, supporting rationale, and concise implications. What you see is what you'll get, instantly accessible with no further setup required.
Original: $10.00
-65%$10.00
$3.50Description
Don't Miss the Bigger Picture
Algonquin's Porter's Five Forces snapshot highlights competitive rivalry, supplier and buyer leverage, threat of entrants and substitutes, and regulatory pressures in concise terms. This summary points to where risks and advantages cluster. Want the full, data-driven force-by-force ratings and visuals? Unlock the complete analysis for actionable strategy and investment insights.
Suppliers Bargaining Power
Concentrated renewable OEMs
Wind, solar and hydro equipment are concentrated: the top three wind OEMs account for about 60% of global turbine shipments and leading inverter suppliers similarly dominate ~60% of the market (2023–24), boosting switching costs and delivery risk. Turbine and inverter backlogs in 2023–24 tightened terms and pushed pricing; turbine lead times commonly range 12–24 months, inverters 3–9 months, giving OEMs leverage on warranties and service. APUC mitigates risk through multi-vendor procurement frameworks and component standardization to lower dependency and compress delivery risk.
Fuel and EPC contract leverage
Gas suppliers and EPC partners can push on price and schedule, with long-term fuel and turnkey contracts through 2024 reducing spot volatility but embedding escalation clauses that shift cost risk over time. Market shocks, notably the 2022–23 gas basis volatility, have historically passed through to owners and strained working capital. Diversified counterparties and active hedging programs temper exposure and cash-flow variability.
Grid interconnection bottlenecks
Transmission operators and ISOs act as gatekeepers, controlling queue positions and studies; US interconnection queues exceeded 1,200 GW in 2024, concentrating leverage with operators. Interconnection upgrades and multi-year timelines can materially increase project costs and delay COD by several years. Queue congestion raises uncertainty and strengthens supplier leverage; early-stage diligence and paying for upgrades can improve position, but bargaining power remains limited.
Specialized labor and unions
Utility operations and renewable O&M depend on skilled, often unionized labor; US union membership was 10.1% in 2023 (BLS), and a 3.5% 2023 unemployment rate tightened labor supply, increasing wage pressure and overtime costs while safety/reliability rules restrict outsourcing flexibility.
- Skilled labor dependence
- 10.1% US union rate (2023)
- Tight labor market: 3.5% unemployment (2023)
- Safety limits outsourcing
- Workforce development and multi-year agreements stabilize costs
Chemicals, parts, and spares
- Lead times: 6–12 months (2024)
- Inventory buffer: 60–90 days
- Mitigation: framework agreements, strategic stocking
- Risk: bespoke legacy parts keep supplier leverage
Supplier concentration tightens wind project pricing and warranties; long lead times squeeze margins
Suppliers hold elevated leverage: top-3 wind OEMs ~60% and leading inverter suppliers ~60% (2023–24), with turbine lead times 12–24m and inverters 3–9m, tightening pricing and warranty terms. Transformer lead times 6–12m (2024) and specialized spares sustain supplier power; multi-vendor frameworks and 60–90d inventory buffers partially mitigate risk.
| Supplier | Concentration | Lead time | Impact |
|---|---|---|---|
| Wind OEMs | ~60% | 12–24m | High |
| Inverters | ~60% | 3–9m | High |
| Transformers | — | 6–12m | Medium |
What is included in the product
Detailed Word Document
Tailored Porter's Five Forces analysis for Algonquin that uncovers competitive dynamics, supplier and buyer power, threat of substitutes and new entrants, and strategic pressures shaping pricing, profitability and market positioning.
Customizable Excel Spreadsheet
Quickly diagnose and relieve strategic pain by mapping Algonquin’s Porter's Five Forces on a clean, one-sheet template—customize pressure levels, swap in your data, and export straight to pitch decks without macros or coding.
Customers Bargaining Power
Regulators as proxy buyers
Regulators act as proxy buyers, setting allowed returns, tariffs and service quality, shaping Algonquin's economics more than end-users. Rate cases and prudency reviews (2024 filings) constrain pricing power and recovery timelines, with allowed ROEs typically 8–10% in many US jurisdictions in 2024. Stable frameworks reduce volatility but cap upside; constructive jurisdictions balance utility recovery with customer affordability.
Captive residential customers
Captive residential customers face near-zero switching under franchise monopolies, so volume risk is limited; short-run residential price elasticity is around -0.1, constraining demand response to price. Affordability programs and revenue decoupling mechanisms can smooth margins and separate sales from recovery. Customer satisfaction and reliability metrics are increasingly tied to regulatory incentive mechanisms, affecting allowed returns and riders.
Large C&I and municipal accounts
Large C&I and municipal accounts can negotiate demand charges, interruptible rates, or distributed-energy solutions, raising churn and self-generation risk as their concentrated load can represent a material portion of local portfolios; 2024 company disclosures show aggressive custom contracting pressures margins but often secure multi‑year relationships, while behind‑the‑meter offers in 2024 aligned incentives to reduce outage risk and retain load.
PPA offtakers in renewables
Corporate and utility offtakers run competitive tenders that have driven median US corporate/utility solar PPA levels to roughly $25–35/MWh in 2024 (LevelTen), compressing margins. Standardized contracts and deep bidder pools increase buyer leverage, while creditworthy offtakers lower financing costs and insist on strict performance and credit terms. Algonquin mitigates counterparty concentration via portfolio diversification across geographies and offtaker types.
- Competitive tenders: lower PPA prices (median $25–35/MWh, 2024)
- Standardization + bidders: stronger buyer bargaining power
- Creditworthy buyers: cheaper financing, tighter contract terms
- Diversification: reduces single-counterparty exposure
Community choice and aggregation
Aggregators and community programs materially influence supply mix and price, with US community solar capacity surpassing 5 GW in 2024, giving aggregators leverage to shift economics away from default service.
They can shift load off incumbent supply, reducing volumes and increasing margin pressure; procurement cycles (typically 1–5 years) introduce repricing risk for utilities.
Offering green tariffs and community solar options has proven effective at retaining load by matching aggregation offers and renewable demand.
ROE 8-10%, PPAs $25-35/MWh, > 5 GW hit
Regulators drive pricing (allowed ROE ~8–10% in many US jurisdictions, 2024), limiting upside; captive residential demand has near-zero switching with short‑run elasticity ≈ -0.1. Corporate/utility PPAs compressed margins (median $25–35/MWh, 2024). Community solar >5 GW (2024) and 1–5 year procurement cycles raise repricing and load‑migration risk.
| Item | 2024 Metric | Impact |
|---|---|---|
| Allowed ROE | 8–10% | Capped returns |
| PPA price | $25–35/MWh | Margin compression |
| Community solar | >5 GW | Customer churn |
| Elasticity | -0.1 | Low price response |
Same Document Delivered
Algonquin Porter's Five Forces Analysis
This preview shows the exact Algonquin Porter's Five Forces analysis you'll receive immediately after purchase—no mockups, no placeholders. The file is the full, professionally formatted document ready for download and use the moment you buy, containing the complete competitive assessment, supporting rationale, and concise implications. What you see is what you'll get, instantly accessible with no further setup required.











