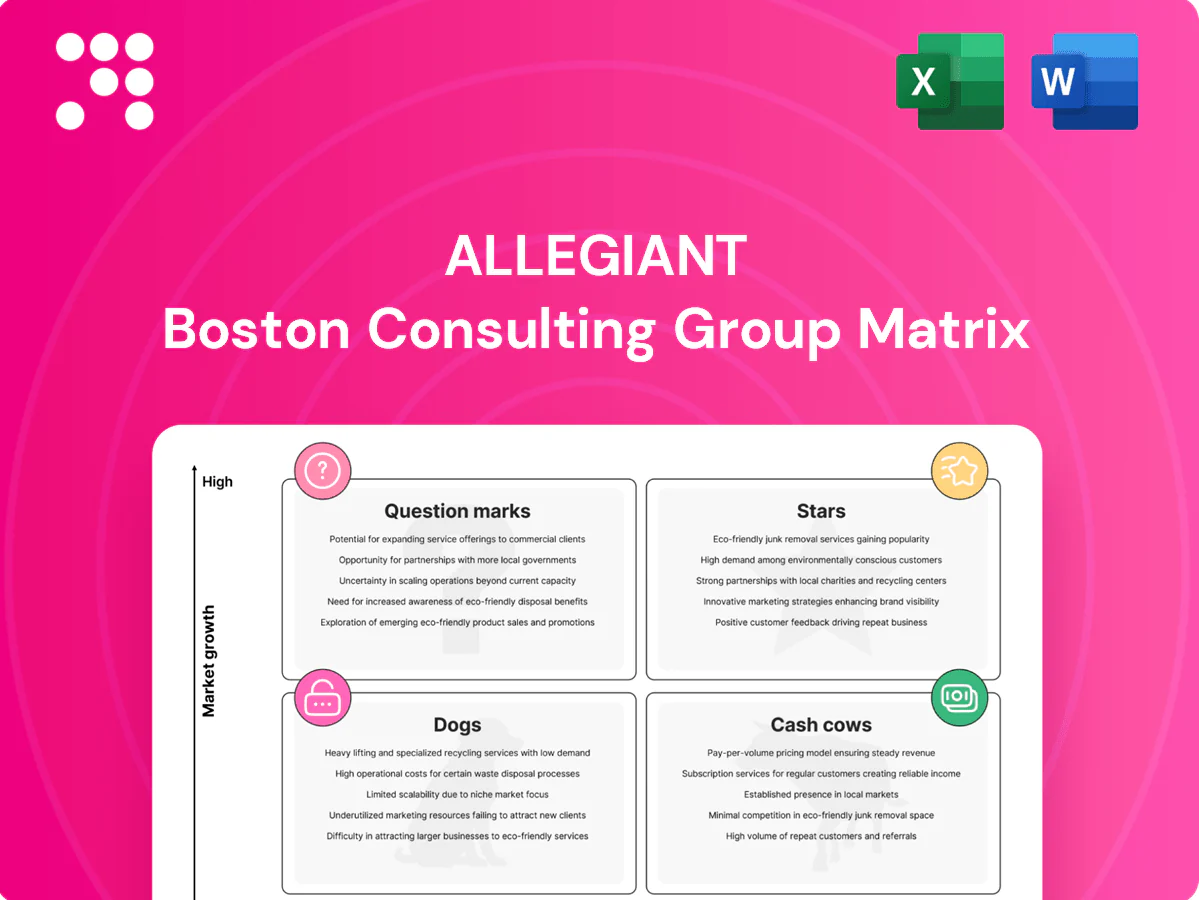
Allegiant Boston Consulting Group Matrix

Download Your Competitive Advantage
Want to know which Allegiant products are true Stars vs. which are quietly bleeding cash? This preview teases the shape of the business—grab the full BCG Matrix for quadrant-by-quadrant placements, crisp data-backed recommendations, and a ready-to-use Word report plus an Excel summary. Save hours of guesswork and get a strategic roadmap that tells you where to invest, divest, or double down—purchase now for instant access.
Stars

Core ULCC leisure routes (underserved city pairs)
Allegiant often owns nonstop leisure lanes on underserved city pairs, frequently acting as the sole carrier and linking roughly 126 cities in its point-to-point network (2024). Rising demand for sun-and-value travel has driven real growth and margin strength on these routes. They still require promo and schedule muscle to defend share as competitors sniff around. Continue feeding capacity where load factors remain robust and unit costs stay lean.
Ancillary revenue engine (bags, seats, priority)
Ancillary revenue (bags, seats, priority) is a star for Allegiant: high attach rates and contribution margins, with ancillaries accounting for over 40% of revenue mix in 2023, classic star behavior. Incremental growth in take-rates and smart bundling keeps the flywheel spinning. It needs marketing and tech spend, but each pricing tweak drops real cash. Keep testing, iterating, and keeping the cart full.

Bundled vacations (flight + hotel + car)
Packaging turns a cheap fare into a full trip—Allegiant controls the shelf and can lift trip value materially; Allegiant Travel Company reported roughly $2.9 billion revenue in 2023. The market is growing as one-click vacations rose in demand across 2023–2024, with OTAs reporting double-digit increases in package searches. Success needs partner marketing and broad inventory, but unit economics can be outsized; focus on supply, UX and scalable cross-sell.

Monopoly-like small-city leadership
In many origin markets Allegiant is the leisure brand residents know first, converting local dominance into repeat traffic and strong word-of-mouth; as of 2024 the carrier emphasizes frequency and community presence to sustain that advantage. Defending the moat requires consistent schedule reliability, targeted marketing, and route density as small-city populations and demand grow.
- local brand leadership
- repeat traffic & WOM
- frequency + reliability
- community engagement
Newer fleet additions enabling better unit economics
Newer fleet additions lower CASM materially—A320neo-family engines typically cut fuel burn ~15% versus older types, enabling longer stage lengths and opening new growth lanes where Allegiant can lead on price and capture share. That edge supports price leadership while competitors manage legacy costs, though it requires near-term capex and training investment; payoff accrues as scale amplifies the cost gap.
P2P leisure edge: 126 cities, ancillaries >40%, $2.9B packages, neo ~15% fuel gain
Allegiant stars: point-to-point leisure dominance (126 cities, 2024), high-margin ancillaries (>40% revenue, 2023) and packaged trips ($2.9B revenue, 2023) drive growth; neo fleet (~15% fuel burn savings) cuts CASM supporting price leadership. Defend with targeted marketing, schedule density and continued tech/product investment to raise attach rates and package conversion.
| Metric | 2023/24 |
|---|---|
| Network cities | 126 (2024) |
| Revenue | $2.9B (2023) |
| Ancillary share | >40% (2023) |
| Neo fuel gain | ~15% |
What is included in the product
 Detailed Word Document
In-depth Allegiant BCG Matrix review offering clear strategies for Stars, Cash Cows, Question Marks and Dogs to guide invest, hold or divest choices.

 Customizable Excel Spreadsheet
One-page Allegiant BCG Matrix that instantly maps units to quadrants, export-ready for PowerPoint and presentation-ready for the C-suite.
Cash Cows

Mature high-occupancy routes to major vacation hubs
Mature high-occupancy routes to Vegas, Florida and other desert-sun hubs deliver steady, predictable weekly demand; Allegiant serves 125+ leisure destinations, so share on these trunk leisure lanes is strong while growth is modest. Promotions can be light because yields hold; these flights reliably generate free cash flow. Keep schedules tight and operations crisp to milk margins.
Checked baggage and seat assignment fees
Checked baggage and seat assignment fees are low‑opex, highly predictable cash cows that make outsized contributions to Allegiant’s liquidity and debt service; modest price moves in 2024 required no splashy campaigns, only clear communication. Keeping fees transparent and reducing friction preserves booking volume and ancillary yield, helping keep the lights on and maintain credit metrics.

In-path add‑ons (priority boarding, carry-on, early check-in)
In-path add-ons (priority boarding, carry-on, early check-in) are classic cash cows for Allegiant: simple, repeatable upsells with near-zero fulfillment surprises and persistently high margin contribution. Growth is slowing in 2024 versus the post‑pandemic boom but yields remain attractive. Small UX tweaks (one‑click offers, pretrip reminders) deliver steady conversion lifts. Maintain pricing discipline to protect goodwill rather than push frequency.

Hotel and car partnerships in established destinations
Hotel and car partnerships sit in the cash-cow quadrant: predictable, well-trodden demand with long-standing partner contracts and steady commissions (Allegiant ancillaries were roughly 40% of revenue in 2023, about $840M of ~$2.1B). Not hyper-growth but highly bankable; occasional inventory tuning and pricing optimization can lift take-rate without extra marketing spend. Keep partners honest and packaging clean to protect margins.
Base operations with optimized turn times
Allegiant’s base operations run on a known, repeatable rhythm—fleet ~132 aircraft in 2024—so tighter turn times translate directly to cash flow uplift; consistent gate-to-gate efficiency drove margin resilience in 2024. Incremental investments in ground processes historically deliver rapid payback, so hold the standard and avoid complexity creep to preserve unit economics.
- operational rhythm: repeatable schedules
- fleet 2024: ~132 aircraft
- efficiency → cash flow: direct conversion
- investments: fast payback
- strategy: maintain standard, avoid complexity
Leisure routes + ancillaries drive steady cash: $840M (40%) in 2023
Mature leisure trunk routes and ancillaries deliver steady, high-margin cash flow for Allegiant; routes show strong share to Vegas/Florida with modest growth. Ancillary streams (checked bags, seat fees, add-ons, hotels/cars) fueled ~40% of 2023 revenue (~$840M of ~$2.1B). Fleet ~132 aircraft in 2024 keeps operations tight; efficiency gains convert directly to cash flow.
| Metric | Value | Role |
|---|---|---|
| Ancillary rev 2023 | $840M (40% of $2.1B) | Primary cash cow |
| Fleet 2024 | ~132 aircraft | Operational leverage |
What You See Is What You Get
Allegiant BCG Matrix
The file you're previewing is the exact BCG Matrix report you'll get after purchase—no watermarks, no placeholders, just the finished, fully formatted document. It’s crafted for strategic clarity by experienced analysts and ready to drop straight into your decks. After buying, the same file is yours to download, edit, print, or share—no surprises, no extra steps.

Download Your Competitive Advantage
Want to know which Allegiant products are true Stars vs. which are quietly bleeding cash? This preview teases the shape of the business—grab the full BCG Matrix for quadrant-by-quadrant placements, crisp data-backed recommendations, and a ready-to-use Word report plus an Excel summary. Save hours of guesswork and get a strategic roadmap that tells you where to invest, divest, or double down—purchase now for instant access.
Stars
Core ULCC leisure routes (underserved city pairs)
Allegiant often owns nonstop leisure lanes on underserved city pairs, frequently acting as the sole carrier and linking roughly 126 cities in its point-to-point network (2024). Rising demand for sun-and-value travel has driven real growth and margin strength on these routes. They still require promo and schedule muscle to defend share as competitors sniff around. Continue feeding capacity where load factors remain robust and unit costs stay lean.
Ancillary revenue engine (bags, seats, priority)
Ancillary revenue (bags, seats, priority) is a star for Allegiant: high attach rates and contribution margins, with ancillaries accounting for over 40% of revenue mix in 2023, classic star behavior. Incremental growth in take-rates and smart bundling keeps the flywheel spinning. It needs marketing and tech spend, but each pricing tweak drops real cash. Keep testing, iterating, and keeping the cart full.
Bundled vacations (flight + hotel + car)
Packaging turns a cheap fare into a full trip—Allegiant controls the shelf and can lift trip value materially; Allegiant Travel Company reported roughly $2.9 billion revenue in 2023. The market is growing as one-click vacations rose in demand across 2023–2024, with OTAs reporting double-digit increases in package searches. Success needs partner marketing and broad inventory, but unit economics can be outsized; focus on supply, UX and scalable cross-sell.
Monopoly-like small-city leadership
In many origin markets Allegiant is the leisure brand residents know first, converting local dominance into repeat traffic and strong word-of-mouth; as of 2024 the carrier emphasizes frequency and community presence to sustain that advantage. Defending the moat requires consistent schedule reliability, targeted marketing, and route density as small-city populations and demand grow.
- local brand leadership
- repeat traffic & WOM
- frequency + reliability
- community engagement
Newer fleet additions enabling better unit economics
Newer fleet additions lower CASM materially—A320neo-family engines typically cut fuel burn ~15% versus older types, enabling longer stage lengths and opening new growth lanes where Allegiant can lead on price and capture share. That edge supports price leadership while competitors manage legacy costs, though it requires near-term capex and training investment; payoff accrues as scale amplifies the cost gap.
P2P leisure edge: 126 cities, ancillaries >40%, $2.9B packages, neo ~15% fuel gain
Allegiant stars: point-to-point leisure dominance (126 cities, 2024), high-margin ancillaries (>40% revenue, 2023) and packaged trips ($2.9B revenue, 2023) drive growth; neo fleet (~15% fuel burn savings) cuts CASM supporting price leadership. Defend with targeted marketing, schedule density and continued tech/product investment to raise attach rates and package conversion.
| Metric | 2023/24 |
|---|---|
| Network cities | 126 (2024) |
| Revenue | $2.9B (2023) |
| Ancillary share | >40% (2023) |
| Neo fuel gain | ~15% |
What is included in the product
Detailed Word Document
In-depth Allegiant BCG Matrix review offering clear strategies for Stars, Cash Cows, Question Marks and Dogs to guide invest, hold or divest choices.
Customizable Excel Spreadsheet
One-page Allegiant BCG Matrix that instantly maps units to quadrants, export-ready for PowerPoint and presentation-ready for the C-suite.
Cash Cows
Mature high-occupancy routes to major vacation hubs
Mature high-occupancy routes to Vegas, Florida and other desert-sun hubs deliver steady, predictable weekly demand; Allegiant serves 125+ leisure destinations, so share on these trunk leisure lanes is strong while growth is modest. Promotions can be light because yields hold; these flights reliably generate free cash flow. Keep schedules tight and operations crisp to milk margins.
Checked baggage and seat assignment fees
Checked baggage and seat assignment fees are low‑opex, highly predictable cash cows that make outsized contributions to Allegiant’s liquidity and debt service; modest price moves in 2024 required no splashy campaigns, only clear communication. Keeping fees transparent and reducing friction preserves booking volume and ancillary yield, helping keep the lights on and maintain credit metrics.
In-path add‑ons (priority boarding, carry-on, early check-in)
In-path add-ons (priority boarding, carry-on, early check-in) are classic cash cows for Allegiant: simple, repeatable upsells with near-zero fulfillment surprises and persistently high margin contribution. Growth is slowing in 2024 versus the post‑pandemic boom but yields remain attractive. Small UX tweaks (one‑click offers, pretrip reminders) deliver steady conversion lifts. Maintain pricing discipline to protect goodwill rather than push frequency.
Hotel and car partnerships in established destinations
Hotel and car partnerships sit in the cash-cow quadrant: predictable, well-trodden demand with long-standing partner contracts and steady commissions (Allegiant ancillaries were roughly 40% of revenue in 2023, about $840M of ~$2.1B). Not hyper-growth but highly bankable; occasional inventory tuning and pricing optimization can lift take-rate without extra marketing spend. Keep partners honest and packaging clean to protect margins.
Base operations with optimized turn times
Allegiant’s base operations run on a known, repeatable rhythm—fleet ~132 aircraft in 2024—so tighter turn times translate directly to cash flow uplift; consistent gate-to-gate efficiency drove margin resilience in 2024. Incremental investments in ground processes historically deliver rapid payback, so hold the standard and avoid complexity creep to preserve unit economics.
- operational rhythm: repeatable schedules
- fleet 2024: ~132 aircraft
- efficiency → cash flow: direct conversion
- investments: fast payback
- strategy: maintain standard, avoid complexity
Leisure routes + ancillaries drive steady cash: $840M (40%) in 2023
Mature leisure trunk routes and ancillaries deliver steady, high-margin cash flow for Allegiant; routes show strong share to Vegas/Florida with modest growth. Ancillary streams (checked bags, seat fees, add-ons, hotels/cars) fueled ~40% of 2023 revenue (~$840M of ~$2.1B). Fleet ~132 aircraft in 2024 keeps operations tight; efficiency gains convert directly to cash flow.
| Metric | Value | Role |
|---|---|---|
| Ancillary rev 2023 | $840M (40% of $2.1B) | Primary cash cow |
| Fleet 2024 | ~132 aircraft | Operational leverage |
What You See Is What You Get
Allegiant BCG Matrix
The file you're previewing is the exact BCG Matrix report you'll get after purchase—no watermarks, no placeholders, just the finished, fully formatted document. It’s crafted for strategic clarity by experienced analysts and ready to drop straight into your decks. After buying, the same file is yours to download, edit, print, or share—no surprises, no extra steps.
Original: $10.00
-65%$10.00
$3.50Description
Download Your Competitive Advantage
Want to know which Allegiant products are true Stars vs. which are quietly bleeding cash? This preview teases the shape of the business—grab the full BCG Matrix for quadrant-by-quadrant placements, crisp data-backed recommendations, and a ready-to-use Word report plus an Excel summary. Save hours of guesswork and get a strategic roadmap that tells you where to invest, divest, or double down—purchase now for instant access.
Stars
Core ULCC leisure routes (underserved city pairs)
Allegiant often owns nonstop leisure lanes on underserved city pairs, frequently acting as the sole carrier and linking roughly 126 cities in its point-to-point network (2024). Rising demand for sun-and-value travel has driven real growth and margin strength on these routes. They still require promo and schedule muscle to defend share as competitors sniff around. Continue feeding capacity where load factors remain robust and unit costs stay lean.
Ancillary revenue engine (bags, seats, priority)
Ancillary revenue (bags, seats, priority) is a star for Allegiant: high attach rates and contribution margins, with ancillaries accounting for over 40% of revenue mix in 2023, classic star behavior. Incremental growth in take-rates and smart bundling keeps the flywheel spinning. It needs marketing and tech spend, but each pricing tweak drops real cash. Keep testing, iterating, and keeping the cart full.
Bundled vacations (flight + hotel + car)
Packaging turns a cheap fare into a full trip—Allegiant controls the shelf and can lift trip value materially; Allegiant Travel Company reported roughly $2.9 billion revenue in 2023. The market is growing as one-click vacations rose in demand across 2023–2024, with OTAs reporting double-digit increases in package searches. Success needs partner marketing and broad inventory, but unit economics can be outsized; focus on supply, UX and scalable cross-sell.
Monopoly-like small-city leadership
In many origin markets Allegiant is the leisure brand residents know first, converting local dominance into repeat traffic and strong word-of-mouth; as of 2024 the carrier emphasizes frequency and community presence to sustain that advantage. Defending the moat requires consistent schedule reliability, targeted marketing, and route density as small-city populations and demand grow.
- local brand leadership
- repeat traffic & WOM
- frequency + reliability
- community engagement
Newer fleet additions enabling better unit economics
Newer fleet additions lower CASM materially—A320neo-family engines typically cut fuel burn ~15% versus older types, enabling longer stage lengths and opening new growth lanes where Allegiant can lead on price and capture share. That edge supports price leadership while competitors manage legacy costs, though it requires near-term capex and training investment; payoff accrues as scale amplifies the cost gap.
P2P leisure edge: 126 cities, ancillaries >40%, $2.9B packages, neo ~15% fuel gain
Allegiant stars: point-to-point leisure dominance (126 cities, 2024), high-margin ancillaries (>40% revenue, 2023) and packaged trips ($2.9B revenue, 2023) drive growth; neo fleet (~15% fuel burn savings) cuts CASM supporting price leadership. Defend with targeted marketing, schedule density and continued tech/product investment to raise attach rates and package conversion.
| Metric | 2023/24 |
|---|---|
| Network cities | 126 (2024) |
| Revenue | $2.9B (2023) |
| Ancillary share | >40% (2023) |
| Neo fuel gain | ~15% |
What is included in the product
Detailed Word Document
In-depth Allegiant BCG Matrix review offering clear strategies for Stars, Cash Cows, Question Marks and Dogs to guide invest, hold or divest choices.
Customizable Excel Spreadsheet
One-page Allegiant BCG Matrix that instantly maps units to quadrants, export-ready for PowerPoint and presentation-ready for the C-suite.
Cash Cows
Mature high-occupancy routes to major vacation hubs
Mature high-occupancy routes to Vegas, Florida and other desert-sun hubs deliver steady, predictable weekly demand; Allegiant serves 125+ leisure destinations, so share on these trunk leisure lanes is strong while growth is modest. Promotions can be light because yields hold; these flights reliably generate free cash flow. Keep schedules tight and operations crisp to milk margins.
Checked baggage and seat assignment fees
Checked baggage and seat assignment fees are low‑opex, highly predictable cash cows that make outsized contributions to Allegiant’s liquidity and debt service; modest price moves in 2024 required no splashy campaigns, only clear communication. Keeping fees transparent and reducing friction preserves booking volume and ancillary yield, helping keep the lights on and maintain credit metrics.
In-path add‑ons (priority boarding, carry-on, early check-in)
In-path add-ons (priority boarding, carry-on, early check-in) are classic cash cows for Allegiant: simple, repeatable upsells with near-zero fulfillment surprises and persistently high margin contribution. Growth is slowing in 2024 versus the post‑pandemic boom but yields remain attractive. Small UX tweaks (one‑click offers, pretrip reminders) deliver steady conversion lifts. Maintain pricing discipline to protect goodwill rather than push frequency.
Hotel and car partnerships in established destinations
Hotel and car partnerships sit in the cash-cow quadrant: predictable, well-trodden demand with long-standing partner contracts and steady commissions (Allegiant ancillaries were roughly 40% of revenue in 2023, about $840M of ~$2.1B). Not hyper-growth but highly bankable; occasional inventory tuning and pricing optimization can lift take-rate without extra marketing spend. Keep partners honest and packaging clean to protect margins.
Base operations with optimized turn times
Allegiant’s base operations run on a known, repeatable rhythm—fleet ~132 aircraft in 2024—so tighter turn times translate directly to cash flow uplift; consistent gate-to-gate efficiency drove margin resilience in 2024. Incremental investments in ground processes historically deliver rapid payback, so hold the standard and avoid complexity creep to preserve unit economics.
- operational rhythm: repeatable schedules
- fleet 2024: ~132 aircraft
- efficiency → cash flow: direct conversion
- investments: fast payback
- strategy: maintain standard, avoid complexity
Leisure routes + ancillaries drive steady cash: $840M (40%) in 2023
Mature leisure trunk routes and ancillaries deliver steady, high-margin cash flow for Allegiant; routes show strong share to Vegas/Florida with modest growth. Ancillary streams (checked bags, seat fees, add-ons, hotels/cars) fueled ~40% of 2023 revenue (~$840M of ~$2.1B). Fleet ~132 aircraft in 2024 keeps operations tight; efficiency gains convert directly to cash flow.
| Metric | Value | Role |
|---|---|---|
| Ancillary rev 2023 | $840M (40% of $2.1B) | Primary cash cow |
| Fleet 2024 | ~132 aircraft | Operational leverage |
What You See Is What You Get
Allegiant BCG Matrix
The file you're previewing is the exact BCG Matrix report you'll get after purchase—no watermarks, no placeholders, just the finished, fully formatted document. It’s crafted for strategic clarity by experienced analysts and ready to drop straight into your decks. After buying, the same file is yours to download, edit, print, or share—no surprises, no extra steps.











