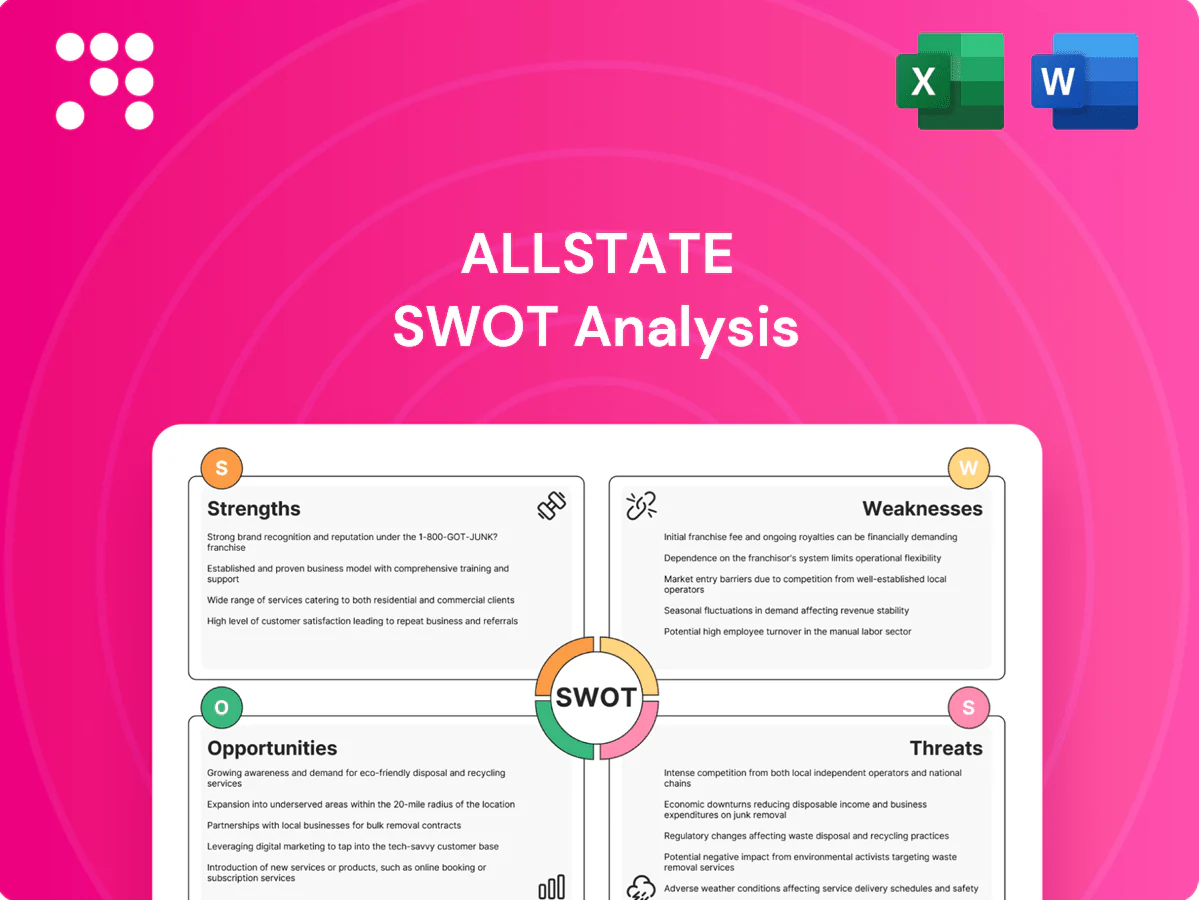
Allstate SWOT Analysis

Elevate Your Analysis with the Complete SWOT Report
Allstate’s strong brand, broad agent network, and diversified product mix underpin steady cash flows, while rising claims costs, regulatory shifts, and intense competition pose notable risks. Growth hinges on digital transformation and tailored pricing. Want the full picture with editable Word & Excel deliverables? Purchase the complete SWOT analysis for strategic, investor-ready insights.
Strengths

Powerful brand and scale
Allstate is one of the most recognized U.S. insurers, serving roughly 16 million households and ranking among the top 5 U.S. personal-lines insurers by direct premiums written, which supports customer acquisition and retention. Its scale yields purchasing power and data breadth across underwriting and claims, enabling operating leverage. Strong brand equity permits premium pricing in targeted segments, while a national footprint across all 50 states diversifies geographic and risk pools.
Diverse distribution channels
Allstate sells via exclusive agents, independent agents and direct/online channels, reducing reliance on any single route and serving roughly 16 million households (2024). This omni-channel reach expands access and improves unit economics by aligning customer segments to optimal channels. It boosts cross-sell across auto, home, life and ancillary products and gives flexibility for faster go-to-market shifts.

Data, telematics, and analytics
Allstate leverages usage-based programs like Drivewise and Milewise to refine risk selection and pricing, with telematics enrollments exceeding 7 million drivers by 2024, improving per-driver loss predictability. Advanced analytics power fraud detection and loss forecasting, contributing to targeted underwriting and reserve accuracy. Enhanced risk segmentation has helped drive improvements in combined ratios over recent years. Scale and continuous feedback loops strengthen data moats over time.

Underwriting expertise and product breadth
Decades of underwriting experience since Allstate’s founding in 1931 deliver actuarial rigor and disciplined product management across personal lines.
A broad portfolio spanning auto, home, life and select commercial lines diversifies revenue and earnings and enables cross-sell opportunities.
Bundling raises customer lifetime value while specialized endorsements and coverages deepen wallet share and retention.
- Underwriting tenure: since 1931
- Product mix: auto, home, life, select commercial
- Benefits: bundling, cross-sell, higher CLV
- Strategy: specialized endorsements to boost wallet share
Capital strength and investment portfolio
Allstate's strong capital and liquidity support claims-paying ability and investment-grade ratings; the company reported roughly $105 billion of invested assets and maintained robust statutory capital ratios through 2024, underpinning customer and regulator confidence. Its sizable investment portfolio generates recurring income that funds growth, dividends, and opportunistic buybacks or selective M&A when market conditions allow.
- Invested assets ≈ $105B (2024)
- Supports buybacks, dividends, selective M&A
- Enhances regulator and customer confidence
Top personal‑lines: ~16M, >7M telematics, $105B
Allstate serves ~16M households, ranks top‑5 in U.S. personal‑lines by direct premiums, and leverages scale, national footprint and brand to support pricing and retention. Telematics enrollments exceed 7M drivers (2024), enhancing underwriting granularity. Invested assets ≈ $105B (2024) bolster ratings and capital flexibility.
| Metric | Value |
|---|---|
| Households | ~16M (2024) |
| Telematics enrollments | >7M drivers (2024) |
| Invested assets | ≈ $105B (2024) |
| Market rank | Top‑5 U.S. personal‑lines |
What is included in the product
 Detailed Word Document
Provides a clear SWOT framework for analyzing Allstate’s strengths in brand, distribution, and underwriting, weaknesses in legacy systems and catastrophe exposure, opportunities from digital transformation, usage-based products and M&A, and threats from climate risk, regulatory shifts, and intensified competition.

 Customizable Excel Spreadsheet
Provides a concise Allstate-focused SWOT matrix for rapid identification of strengths, weaknesses, opportunities, and threats to ease strategic decision-making; editable layout lets teams update priorities and integrate findings into reports and presentations.
Weaknesses

Auto loss cost sensitivity
Allstate remains exposed to auto frequency/severity trends—parts, labor, medical and litigation inflation drive loss pressure; CCC Intelligent Solutions reports repair severity up ~24% since 2019. Rate filings typically lag real-time inflation, creating multi-quarter earnings compression during cost spikes. Repair network constraints raise cycle times and costs, and sensitivity is amplified in highly competitive rate environments.
Catastrophe exposure in homeowners
Concentration in U.S. homeowners lines ties Allstate to hurricanes, wildfires, convective storms and hail; NOAA recorded 18 separate billion‑dollar weather disasters in 2023 totaling about $57.3B, underscoring cat volatility. Reinsurance mitigates but cannot fully smooth loss swings, climate-driven secondary perils widen loss distribution uncertainty, and geographic repricing or withdrawal can constrain top-line growth.

Earnings volatility and combined ratio swings
Allstate's results show earnings volatility tied to social inflation, adverse prior-year reserve development and CAT load, with combined ratios historically swinging from the mid-90s into the low-100s in loss years. Timing gaps between emerging loss trends and regulator-approved rate actions create periodic variability in underwriting margins. Shifts in mix toward nonstandard or high-severity risks compress profitability versus preferred-book returns. Market response often prices a volatility discount, contributing to valuation multiples trailing many peers.

High expense ratio versus ultra-lean peers
Allstate's agent-heavy distribution and legacy IT maintain higher operating expenses, constraining margins compared with ultra-lean, direct-first competitors that benefit from lower customer acquisition costs and more aggressive pricing.
Ongoing modernization programs demand substantial capital and change management, creating short-term expense drag that limits underwriting flexibility and price competitiveness.
- Agent and legacy systems raise operating costs
- Direct peers have lower acquisition costs, enabling aggressive pricing
- Modernization requires heavy upfront spend and organizational change
- Expense burden reduces pricing flexibility
U.S.-centric concentration
Allstate remains heavily U.S.-centric, with over 90% of property-casualty premiums written in the United States and personal lines (auto/home) accounting for the bulk of revenue in 2024, concentrating regulatory, economic and CAT exposure domestically. Growth is tied to U.S. personal-lines dynamics, so state-level downturns or regulatory headwinds—e.g., rate restrictions in key states—can sharply impair results, while geographic diversification would demand time and capital.
- Concentration: >90% premiums U.S.-based (Allstate 2024)
- Revenue mix: personal lines dominate
- Risk: state regulatory/cat vulnerability
- Mitigation: diversification costly and slow
U.S.-focused insurer exposed to rising CAT/severity, lagging rate relief and expense pressure
Allstate faces U.S.-centric CAT and regulatory concentration, auto/home severity inflation and lagging rate realizations, earnings volatility from social inflation/prior-year reserve hits, and higher expense base from agent-led distribution and legacy IT that limits pricing flexibility.
| Metric | Value (latest) |
|---|---|
| US premium concentration | >90% (2024) |
| Repair severity | +24% vs 2019 (CCC) |
| 2023 billion‑$ disasters | 18; $57.3B (NOAA) |
| Combined ratio range | mid‑90s to low‑100s |
Full Version Awaits
Allstate SWOT Analysis
This is the actual SWOT analysis document you’ll receive upon purchase—no surprises, just professional quality. The preview below is taken directly from the full SWOT report you'll get; purchasing unlocks the entire in-depth version. The content is structured, editable, and ready for immediate download after payment.

Elevate Your Analysis with the Complete SWOT Report
Allstate’s strong brand, broad agent network, and diversified product mix underpin steady cash flows, while rising claims costs, regulatory shifts, and intense competition pose notable risks. Growth hinges on digital transformation and tailored pricing. Want the full picture with editable Word & Excel deliverables? Purchase the complete SWOT analysis for strategic, investor-ready insights.
Strengths
Powerful brand and scale
Allstate is one of the most recognized U.S. insurers, serving roughly 16 million households and ranking among the top 5 U.S. personal-lines insurers by direct premiums written, which supports customer acquisition and retention. Its scale yields purchasing power and data breadth across underwriting and claims, enabling operating leverage. Strong brand equity permits premium pricing in targeted segments, while a national footprint across all 50 states diversifies geographic and risk pools.
Diverse distribution channels
Allstate sells via exclusive agents, independent agents and direct/online channels, reducing reliance on any single route and serving roughly 16 million households (2024). This omni-channel reach expands access and improves unit economics by aligning customer segments to optimal channels. It boosts cross-sell across auto, home, life and ancillary products and gives flexibility for faster go-to-market shifts.
Data, telematics, and analytics
Allstate leverages usage-based programs like Drivewise and Milewise to refine risk selection and pricing, with telematics enrollments exceeding 7 million drivers by 2024, improving per-driver loss predictability. Advanced analytics power fraud detection and loss forecasting, contributing to targeted underwriting and reserve accuracy. Enhanced risk segmentation has helped drive improvements in combined ratios over recent years. Scale and continuous feedback loops strengthen data moats over time.
Underwriting expertise and product breadth
Decades of underwriting experience since Allstate’s founding in 1931 deliver actuarial rigor and disciplined product management across personal lines.
A broad portfolio spanning auto, home, life and select commercial lines diversifies revenue and earnings and enables cross-sell opportunities.
Bundling raises customer lifetime value while specialized endorsements and coverages deepen wallet share and retention.
- Underwriting tenure: since 1931
- Product mix: auto, home, life, select commercial
- Benefits: bundling, cross-sell, higher CLV
- Strategy: specialized endorsements to boost wallet share
Capital strength and investment portfolio
Allstate's strong capital and liquidity support claims-paying ability and investment-grade ratings; the company reported roughly $105 billion of invested assets and maintained robust statutory capital ratios through 2024, underpinning customer and regulator confidence. Its sizable investment portfolio generates recurring income that funds growth, dividends, and opportunistic buybacks or selective M&A when market conditions allow.
- Invested assets ≈ $105B (2024)
- Supports buybacks, dividends, selective M&A
- Enhances regulator and customer confidence
Top personal‑lines: ~16M, >7M telematics, $105B
Allstate serves ~16M households, ranks top‑5 in U.S. personal‑lines by direct premiums, and leverages scale, national footprint and brand to support pricing and retention. Telematics enrollments exceed 7M drivers (2024), enhancing underwriting granularity. Invested assets ≈ $105B (2024) bolster ratings and capital flexibility.
| Metric | Value |
|---|---|
| Households | ~16M (2024) |
| Telematics enrollments | >7M drivers (2024) |
| Invested assets | ≈ $105B (2024) |
| Market rank | Top‑5 U.S. personal‑lines |
What is included in the product
Detailed Word Document
Provides a clear SWOT framework for analyzing Allstate’s strengths in brand, distribution, and underwriting, weaknesses in legacy systems and catastrophe exposure, opportunities from digital transformation, usage-based products and M&A, and threats from climate risk, regulatory shifts, and intensified competition.
Customizable Excel Spreadsheet
Provides a concise Allstate-focused SWOT matrix for rapid identification of strengths, weaknesses, opportunities, and threats to ease strategic decision-making; editable layout lets teams update priorities and integrate findings into reports and presentations.
Weaknesses
Auto loss cost sensitivity
Allstate remains exposed to auto frequency/severity trends—parts, labor, medical and litigation inflation drive loss pressure; CCC Intelligent Solutions reports repair severity up ~24% since 2019. Rate filings typically lag real-time inflation, creating multi-quarter earnings compression during cost spikes. Repair network constraints raise cycle times and costs, and sensitivity is amplified in highly competitive rate environments.
Catastrophe exposure in homeowners
Concentration in U.S. homeowners lines ties Allstate to hurricanes, wildfires, convective storms and hail; NOAA recorded 18 separate billion‑dollar weather disasters in 2023 totaling about $57.3B, underscoring cat volatility. Reinsurance mitigates but cannot fully smooth loss swings, climate-driven secondary perils widen loss distribution uncertainty, and geographic repricing or withdrawal can constrain top-line growth.
Earnings volatility and combined ratio swings
Allstate's results show earnings volatility tied to social inflation, adverse prior-year reserve development and CAT load, with combined ratios historically swinging from the mid-90s into the low-100s in loss years. Timing gaps between emerging loss trends and regulator-approved rate actions create periodic variability in underwriting margins. Shifts in mix toward nonstandard or high-severity risks compress profitability versus preferred-book returns. Market response often prices a volatility discount, contributing to valuation multiples trailing many peers.
High expense ratio versus ultra-lean peers
Allstate's agent-heavy distribution and legacy IT maintain higher operating expenses, constraining margins compared with ultra-lean, direct-first competitors that benefit from lower customer acquisition costs and more aggressive pricing.
Ongoing modernization programs demand substantial capital and change management, creating short-term expense drag that limits underwriting flexibility and price competitiveness.
- Agent and legacy systems raise operating costs
- Direct peers have lower acquisition costs, enabling aggressive pricing
- Modernization requires heavy upfront spend and organizational change
- Expense burden reduces pricing flexibility
U.S.-centric concentration
Allstate remains heavily U.S.-centric, with over 90% of property-casualty premiums written in the United States and personal lines (auto/home) accounting for the bulk of revenue in 2024, concentrating regulatory, economic and CAT exposure domestically. Growth is tied to U.S. personal-lines dynamics, so state-level downturns or regulatory headwinds—e.g., rate restrictions in key states—can sharply impair results, while geographic diversification would demand time and capital.
- Concentration: >90% premiums U.S.-based (Allstate 2024)
- Revenue mix: personal lines dominate
- Risk: state regulatory/cat vulnerability
- Mitigation: diversification costly and slow
U.S.-focused insurer exposed to rising CAT/severity, lagging rate relief and expense pressure
Allstate faces U.S.-centric CAT and regulatory concentration, auto/home severity inflation and lagging rate realizations, earnings volatility from social inflation/prior-year reserve hits, and higher expense base from agent-led distribution and legacy IT that limits pricing flexibility.
| Metric | Value (latest) |
|---|---|
| US premium concentration | >90% (2024) |
| Repair severity | +24% vs 2019 (CCC) |
| 2023 billion‑$ disasters | 18; $57.3B (NOAA) |
| Combined ratio range | mid‑90s to low‑100s |
Full Version Awaits
Allstate SWOT Analysis
This is the actual SWOT analysis document you’ll receive upon purchase—no surprises, just professional quality. The preview below is taken directly from the full SWOT report you'll get; purchasing unlocks the entire in-depth version. The content is structured, editable, and ready for immediate download after payment.
Description
Elevate Your Analysis with the Complete SWOT Report
Allstate’s strong brand, broad agent network, and diversified product mix underpin steady cash flows, while rising claims costs, regulatory shifts, and intense competition pose notable risks. Growth hinges on digital transformation and tailored pricing. Want the full picture with editable Word & Excel deliverables? Purchase the complete SWOT analysis for strategic, investor-ready insights.
Strengths
Powerful brand and scale
Allstate is one of the most recognized U.S. insurers, serving roughly 16 million households and ranking among the top 5 U.S. personal-lines insurers by direct premiums written, which supports customer acquisition and retention. Its scale yields purchasing power and data breadth across underwriting and claims, enabling operating leverage. Strong brand equity permits premium pricing in targeted segments, while a national footprint across all 50 states diversifies geographic and risk pools.
Diverse distribution channels
Allstate sells via exclusive agents, independent agents and direct/online channels, reducing reliance on any single route and serving roughly 16 million households (2024). This omni-channel reach expands access and improves unit economics by aligning customer segments to optimal channels. It boosts cross-sell across auto, home, life and ancillary products and gives flexibility for faster go-to-market shifts.
Data, telematics, and analytics
Allstate leverages usage-based programs like Drivewise and Milewise to refine risk selection and pricing, with telematics enrollments exceeding 7 million drivers by 2024, improving per-driver loss predictability. Advanced analytics power fraud detection and loss forecasting, contributing to targeted underwriting and reserve accuracy. Enhanced risk segmentation has helped drive improvements in combined ratios over recent years. Scale and continuous feedback loops strengthen data moats over time.
Underwriting expertise and product breadth
Decades of underwriting experience since Allstate’s founding in 1931 deliver actuarial rigor and disciplined product management across personal lines.
A broad portfolio spanning auto, home, life and select commercial lines diversifies revenue and earnings and enables cross-sell opportunities.
Bundling raises customer lifetime value while specialized endorsements and coverages deepen wallet share and retention.
- Underwriting tenure: since 1931
- Product mix: auto, home, life, select commercial
- Benefits: bundling, cross-sell, higher CLV
- Strategy: specialized endorsements to boost wallet share
Capital strength and investment portfolio
Allstate's strong capital and liquidity support claims-paying ability and investment-grade ratings; the company reported roughly $105 billion of invested assets and maintained robust statutory capital ratios through 2024, underpinning customer and regulator confidence. Its sizable investment portfolio generates recurring income that funds growth, dividends, and opportunistic buybacks or selective M&A when market conditions allow.
- Invested assets ≈ $105B (2024)
- Supports buybacks, dividends, selective M&A
- Enhances regulator and customer confidence
Top personal‑lines: ~16M, >7M telematics, $105B
Allstate serves ~16M households, ranks top‑5 in U.S. personal‑lines by direct premiums, and leverages scale, national footprint and brand to support pricing and retention. Telematics enrollments exceed 7M drivers (2024), enhancing underwriting granularity. Invested assets ≈ $105B (2024) bolster ratings and capital flexibility.
| Metric | Value |
|---|---|
| Households | ~16M (2024) |
| Telematics enrollments | >7M drivers (2024) |
| Invested assets | ≈ $105B (2024) |
| Market rank | Top‑5 U.S. personal‑lines |
What is included in the product
Detailed Word Document
Provides a clear SWOT framework for analyzing Allstate’s strengths in brand, distribution, and underwriting, weaknesses in legacy systems and catastrophe exposure, opportunities from digital transformation, usage-based products and M&A, and threats from climate risk, regulatory shifts, and intensified competition.
Customizable Excel Spreadsheet
Provides a concise Allstate-focused SWOT matrix for rapid identification of strengths, weaknesses, opportunities, and threats to ease strategic decision-making; editable layout lets teams update priorities and integrate findings into reports and presentations.
Weaknesses
Auto loss cost sensitivity
Allstate remains exposed to auto frequency/severity trends—parts, labor, medical and litigation inflation drive loss pressure; CCC Intelligent Solutions reports repair severity up ~24% since 2019. Rate filings typically lag real-time inflation, creating multi-quarter earnings compression during cost spikes. Repair network constraints raise cycle times and costs, and sensitivity is amplified in highly competitive rate environments.
Catastrophe exposure in homeowners
Concentration in U.S. homeowners lines ties Allstate to hurricanes, wildfires, convective storms and hail; NOAA recorded 18 separate billion‑dollar weather disasters in 2023 totaling about $57.3B, underscoring cat volatility. Reinsurance mitigates but cannot fully smooth loss swings, climate-driven secondary perils widen loss distribution uncertainty, and geographic repricing or withdrawal can constrain top-line growth.
Earnings volatility and combined ratio swings
Allstate's results show earnings volatility tied to social inflation, adverse prior-year reserve development and CAT load, with combined ratios historically swinging from the mid-90s into the low-100s in loss years. Timing gaps between emerging loss trends and regulator-approved rate actions create periodic variability in underwriting margins. Shifts in mix toward nonstandard or high-severity risks compress profitability versus preferred-book returns. Market response often prices a volatility discount, contributing to valuation multiples trailing many peers.
High expense ratio versus ultra-lean peers
Allstate's agent-heavy distribution and legacy IT maintain higher operating expenses, constraining margins compared with ultra-lean, direct-first competitors that benefit from lower customer acquisition costs and more aggressive pricing.
Ongoing modernization programs demand substantial capital and change management, creating short-term expense drag that limits underwriting flexibility and price competitiveness.
- Agent and legacy systems raise operating costs
- Direct peers have lower acquisition costs, enabling aggressive pricing
- Modernization requires heavy upfront spend and organizational change
- Expense burden reduces pricing flexibility
U.S.-centric concentration
Allstate remains heavily U.S.-centric, with over 90% of property-casualty premiums written in the United States and personal lines (auto/home) accounting for the bulk of revenue in 2024, concentrating regulatory, economic and CAT exposure domestically. Growth is tied to U.S. personal-lines dynamics, so state-level downturns or regulatory headwinds—e.g., rate restrictions in key states—can sharply impair results, while geographic diversification would demand time and capital.
- Concentration: >90% premiums U.S.-based (Allstate 2024)
- Revenue mix: personal lines dominate
- Risk: state regulatory/cat vulnerability
- Mitigation: diversification costly and slow
U.S.-focused insurer exposed to rising CAT/severity, lagging rate relief and expense pressure
Allstate faces U.S.-centric CAT and regulatory concentration, auto/home severity inflation and lagging rate realizations, earnings volatility from social inflation/prior-year reserve hits, and higher expense base from agent-led distribution and legacy IT that limits pricing flexibility.
| Metric | Value (latest) |
|---|---|
| US premium concentration | >90% (2024) |
| Repair severity | +24% vs 2019 (CCC) |
| 2023 billion‑$ disasters | 18; $57.3B (NOAA) |
| Combined ratio range | mid‑90s to low‑100s |
Full Version Awaits
Allstate SWOT Analysis
This is the actual SWOT analysis document you’ll receive upon purchase—no surprises, just professional quality. The preview below is taken directly from the full SWOT report you'll get; purchasing unlocks the entire in-depth version. The content is structured, editable, and ready for immediate download after payment.











