Alsea Porter's Five Forces Analysis

A Must-Have Tool for Decision-Makers
Alsea faces moderate supplier power, strong buyer expectations, intense rivalry among global brands and modest new-entrant threats due to scale and franchising. Digital channels and multi-brand scale are strategic advantages. This brief highlights key tensions. Unlock the full Porter's Five Forces Analysis to get force-by-force ratings, visuals and actionable strategy for Alsea.
Suppliers Bargaining Power

Franchisors control key terms
Global licensors like Starbucks (~36,000 stores in 2024), Domino’s (~20,000) and Burger King (~19,000) set standards, royalties and sourcing rules, concentrating IP and supply control; royalty and marketing fees commonly total 6–10% of sales. Contract renewals and territory limits can compress Alsea’s margins, while compliance costs and limited operational flexibility strengthen supplier leverage.
Concentrated beverage inputs
Coffee, syrups and branded beverages for Alsea largely come from approved or captive suppliers, creating high switching costs due to strict quality specifications and limited substitutes. Currency swings across LATAM and Europe amplify input-price volatility for imported concentrates and raw beans. Volume rebates reduce billed costs but do not fully offset supplier leverage. Net bargaining power remains skewed toward suppliers.

Food commodities volatility
Dairy, wheat, proteins and produce come from fragmented suppliers yet remain exposed to global price shocks; the FAO Food Price Index stayed elevated in 2024, keeping input volatility high. Hedging and multi-sourcing reduce risk but persistent inflation cycles have compressed store-level EBITDA for operators like Alsea. Stricter safety and traceability rules narrow eligible vendors, and cost pass-through is often infeasible in price-sensitive markets.

Equipment and tech dependencies
Brand-specific ovens, POS and loyalty systems for Alsea come from a short list of approved vendors, and 2024 integration and certification processes cement supplier lock-in across banners. Recurring spend on upgrades and maintenance raises operating costs and creates downtime risk that can depress store-level margins. Vendor lead-times and contractual terms directly affect rollout speed and unit economics.
- Approved-vendor concentration increases switching costs
- Certification ties tech to long-term spend
- Upgrades/maintenance = recurring cost and downtime risk
- Vendor terms influence rollout pace and margins
Real estate and delivery platforms
Prime landlords and delivery aggregators act as gatekeepers to Alsea's traffic: delivery platforms commonly charge 20–30% commissions and prime retail rents often represent a high single-digit to low-double-digit share of sales, compressing margins and elevating operating leverage; co-marketing and exclusivity deals boost reach but reduce flexibility, while dependence on footfall and delivery volumes gives these suppliers clear negotiation leverage.
- Platform commissions: 20–30%
- Rents: high single-digit to low-double-digit % of sales
- Co-marketing trades flexibility for reach
- Footfall/delivery dependence increases supplier leverage
Margin squeeze:6–10%/20–30%/≈8–12%
Global licensors (Starbucks 36,000 stores 2024; Domino’s 20,000; Burger King 19,000) set royalties/standards (6–10% of sales) that limit Alsea’s margin flexibility. Approved/captive suppliers create high switching costs amid input-price volatility across LATAM/Europe. Delivery platforms (20–30% commission) and rents (≈8–12% of sales) further compress store-level EBITDA and increase supplier leverage.
| Item | Metric | Impact |
|---|---|---|
| Royalties | 6–10% sales | Margin squeeze |
| Platform fees | 20–30% commission | Lower net sales |
| Rents | ≈8–12% sales | Higher fixed costs |
What is included in the product
 Detailed Word Document
Tailored Porter's Five Forces analysis of Alsea that uncovers key drivers of competition, buyer and supplier power, and the threat of substitutes and new entrants impacting pricing and profitability. Identifies disruptive forces, emerging threats, and strategic levers to defend market share and inform investor and management decisions.

 Customizable Excel Spreadsheet
Clear one-sheet Porter's Five Forces for Alsea—condenses competitive pressures into a single view for fast strategic and investment decisions. Customize force intensities or export the accompanying radar chart for pitch decks or boardroom discussions.
Customers Bargaining Power

Many alternatives, low switching
Alsea’s ~5,000 points of sale in 2024 face consumers who can easily switch among QSR, casual dining, street food and convenience stores, so minimal switching costs heighten price sensitivity; promotions and bundles (frequent in-store and digital offers) materially drive traffic, while loyalty programs—despite ~30% churn in typical QSR loyalty cohorts—reduce but do not eliminate switching risk.
Price transparency via apps
Delivery marketplaces display prices and ratings side-by-side, making Alsea customers compare options instantly; dynamic promotions on platforms condition customers to expect discounts and inflate price sensitivity. Real-time visibility into delivery fees and prep times increases switching and negotiation power. This transparency elevates buyer leverage over menu pricing and margin management.

Segment-specific loyalty
Starbucks (≈34 million US Rewards members by 2024) and Domino’s (digital sales ≈70% of sales) generate strong brand loyalty that dampens buyer power for Alsea, but loyalty varies widely across banners and markets. Program generosity and rewards economics materially affect retention and margin dilution. Weaker banners show more elastic demand and greater sensitivity to price and promotions.

Health and quality expectations
Rising demand for healthier, local and sustainable options forces Alsea into menu reformulations and third-party certifications that raise COGS and operational complexity; 2024 surveys show sustainability and health claims drive purchase decisions, and negative reviews or social media spikes can rapidly divert traffic, with inconsistent standards across markets punished by buyers.
Macroeconomic sensitivity
In LATAM, wide real-income swings and material FX pass-through in 2024 raise price elasticity: IMF WEO 2024 projects LAC growth ~2.4% while inflation remains elevated, squeezing real incomes. Consumers trade down or cook at home during downturns, so small price moves can drive 5–10% volume volatility across quick-service segments. Value menus were decisive for traffic in 2024, shifting share to discount offerings.
- IMF WEO 2024: LAC GDP ~2.4%
- Elevated inflation in 2024 tightened real incomes
- Value menus drove traffic and market share shifts
Low switching costs and promo-driven volatility; loyalty and digital mix shield premium banners
Alsea’s ~5,000 points of sale face low switching costs and high promotion-driven price sensitivity; delivery marketplaces and visible fees/ratings amplify buyer leverage. Loyalty effects vary—Starbucks ≈34m US Rewards and Domino’s ≈70% digital sales protect premium banners, while weaker banners see ~30% churn and 5–10% volume swings in downturns. Sustainability demands increase COGS and complexity.
| Metric | 2024 value | Impact |
|---|---|---|
| Points of sale | ~5,000 | Broad exposure to switching |
| Starbucks Rewards (US) | ≈34m | Loyalty buffer |
| Domino’s digital | ≈70% | Digital expectations |
| LAC GDP (IMF WEO) | ≈2.4% | Price elasticity |
| Volume volatility | 5–10% | Sensitivity to price |
| Loyalty churn | ≈30% | Retention risk |
Preview the Actual Deliverable
Alsea Porter's Five Forces Analysis
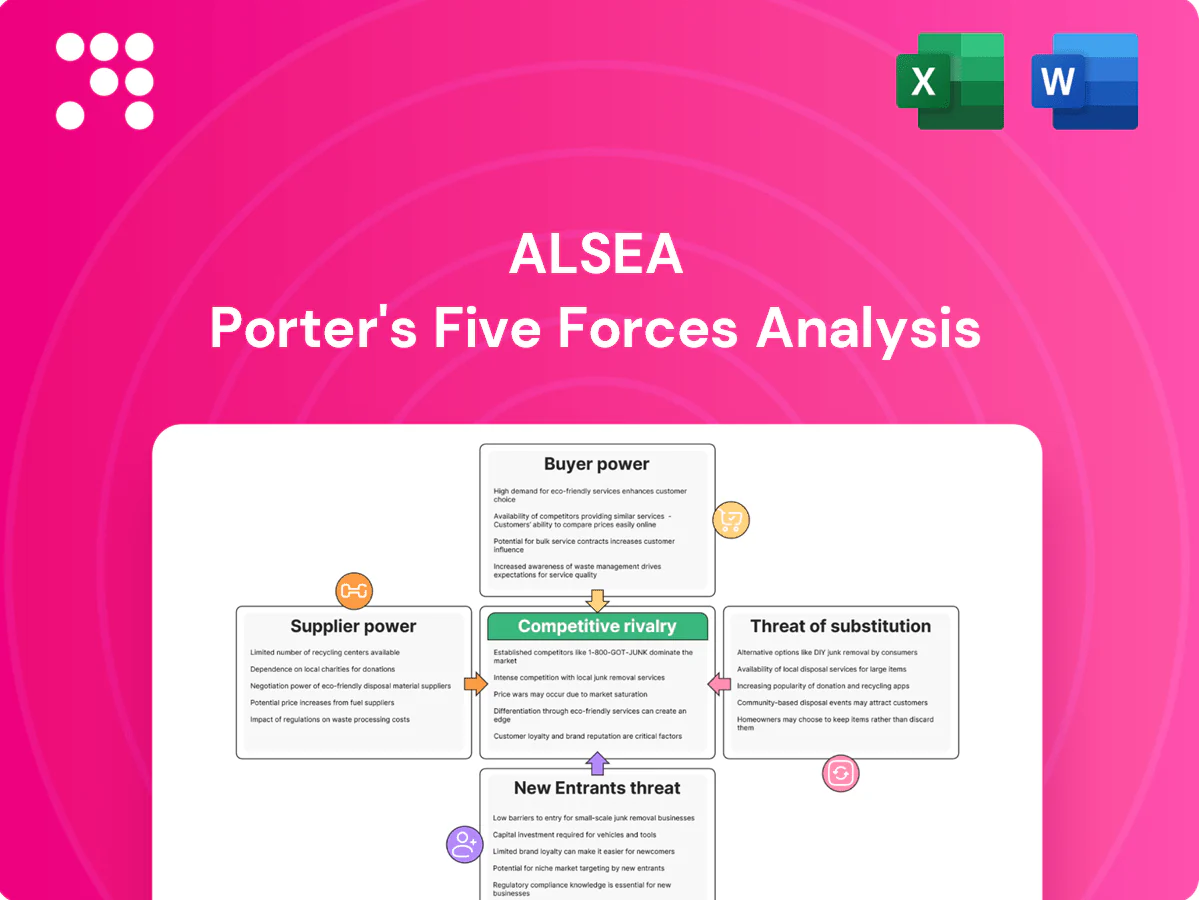
This preview shows the exact Alsea Porter's Five Forces Analysis you'll receive immediately after purchase—no surprises, no placeholders. The document is fully formatted, professional, and ready for download and use the moment you buy. You're viewing the final deliverable.

A Must-Have Tool for Decision-Makers
Alsea faces moderate supplier power, strong buyer expectations, intense rivalry among global brands and modest new-entrant threats due to scale and franchising. Digital channels and multi-brand scale are strategic advantages. This brief highlights key tensions. Unlock the full Porter's Five Forces Analysis to get force-by-force ratings, visuals and actionable strategy for Alsea.
Suppliers Bargaining Power
Franchisors control key terms
Global licensors like Starbucks (~36,000 stores in 2024), Domino’s (~20,000) and Burger King (~19,000) set standards, royalties and sourcing rules, concentrating IP and supply control; royalty and marketing fees commonly total 6–10% of sales. Contract renewals and territory limits can compress Alsea’s margins, while compliance costs and limited operational flexibility strengthen supplier leverage.
Concentrated beverage inputs
Coffee, syrups and branded beverages for Alsea largely come from approved or captive suppliers, creating high switching costs due to strict quality specifications and limited substitutes. Currency swings across LATAM and Europe amplify input-price volatility for imported concentrates and raw beans. Volume rebates reduce billed costs but do not fully offset supplier leverage. Net bargaining power remains skewed toward suppliers.
Food commodities volatility
Dairy, wheat, proteins and produce come from fragmented suppliers yet remain exposed to global price shocks; the FAO Food Price Index stayed elevated in 2024, keeping input volatility high. Hedging and multi-sourcing reduce risk but persistent inflation cycles have compressed store-level EBITDA for operators like Alsea. Stricter safety and traceability rules narrow eligible vendors, and cost pass-through is often infeasible in price-sensitive markets.
Equipment and tech dependencies
Brand-specific ovens, POS and loyalty systems for Alsea come from a short list of approved vendors, and 2024 integration and certification processes cement supplier lock-in across banners. Recurring spend on upgrades and maintenance raises operating costs and creates downtime risk that can depress store-level margins. Vendor lead-times and contractual terms directly affect rollout speed and unit economics.
- Approved-vendor concentration increases switching costs
- Certification ties tech to long-term spend
- Upgrades/maintenance = recurring cost and downtime risk
- Vendor terms influence rollout pace and margins
Real estate and delivery platforms
Prime landlords and delivery aggregators act as gatekeepers to Alsea's traffic: delivery platforms commonly charge 20–30% commissions and prime retail rents often represent a high single-digit to low-double-digit share of sales, compressing margins and elevating operating leverage; co-marketing and exclusivity deals boost reach but reduce flexibility, while dependence on footfall and delivery volumes gives these suppliers clear negotiation leverage.
- Platform commissions: 20–30%
- Rents: high single-digit to low-double-digit % of sales
- Co-marketing trades flexibility for reach
- Footfall/delivery dependence increases supplier leverage
Margin squeeze:6–10%/20–30%/≈8–12%
Global licensors (Starbucks 36,000 stores 2024; Domino’s 20,000; Burger King 19,000) set royalties/standards (6–10% of sales) that limit Alsea’s margin flexibility. Approved/captive suppliers create high switching costs amid input-price volatility across LATAM/Europe. Delivery platforms (20–30% commission) and rents (≈8–12% of sales) further compress store-level EBITDA and increase supplier leverage.
| Item | Metric | Impact |
|---|---|---|
| Royalties | 6–10% sales | Margin squeeze |
| Platform fees | 20–30% commission | Lower net sales |
| Rents | ≈8–12% sales | Higher fixed costs |
What is included in the product
Detailed Word Document
Tailored Porter's Five Forces analysis of Alsea that uncovers key drivers of competition, buyer and supplier power, and the threat of substitutes and new entrants impacting pricing and profitability. Identifies disruptive forces, emerging threats, and strategic levers to defend market share and inform investor and management decisions.
Customizable Excel Spreadsheet
Clear one-sheet Porter's Five Forces for Alsea—condenses competitive pressures into a single view for fast strategic and investment decisions. Customize force intensities or export the accompanying radar chart for pitch decks or boardroom discussions.
Customers Bargaining Power
Many alternatives, low switching
Alsea’s ~5,000 points of sale in 2024 face consumers who can easily switch among QSR, casual dining, street food and convenience stores, so minimal switching costs heighten price sensitivity; promotions and bundles (frequent in-store and digital offers) materially drive traffic, while loyalty programs—despite ~30% churn in typical QSR loyalty cohorts—reduce but do not eliminate switching risk.
Price transparency via apps
Delivery marketplaces display prices and ratings side-by-side, making Alsea customers compare options instantly; dynamic promotions on platforms condition customers to expect discounts and inflate price sensitivity. Real-time visibility into delivery fees and prep times increases switching and negotiation power. This transparency elevates buyer leverage over menu pricing and margin management.
Segment-specific loyalty
Starbucks (≈34 million US Rewards members by 2024) and Domino’s (digital sales ≈70% of sales) generate strong brand loyalty that dampens buyer power for Alsea, but loyalty varies widely across banners and markets. Program generosity and rewards economics materially affect retention and margin dilution. Weaker banners show more elastic demand and greater sensitivity to price and promotions.
Health and quality expectations
Rising demand for healthier, local and sustainable options forces Alsea into menu reformulations and third-party certifications that raise COGS and operational complexity; 2024 surveys show sustainability and health claims drive purchase decisions, and negative reviews or social media spikes can rapidly divert traffic, with inconsistent standards across markets punished by buyers.
Macroeconomic sensitivity
In LATAM, wide real-income swings and material FX pass-through in 2024 raise price elasticity: IMF WEO 2024 projects LAC growth ~2.4% while inflation remains elevated, squeezing real incomes. Consumers trade down or cook at home during downturns, so small price moves can drive 5–10% volume volatility across quick-service segments. Value menus were decisive for traffic in 2024, shifting share to discount offerings.
- IMF WEO 2024: LAC GDP ~2.4%
- Elevated inflation in 2024 tightened real incomes
- Value menus drove traffic and market share shifts
Low switching costs and promo-driven volatility; loyalty and digital mix shield premium banners
Alsea’s ~5,000 points of sale face low switching costs and high promotion-driven price sensitivity; delivery marketplaces and visible fees/ratings amplify buyer leverage. Loyalty effects vary—Starbucks ≈34m US Rewards and Domino’s ≈70% digital sales protect premium banners, while weaker banners see ~30% churn and 5–10% volume swings in downturns. Sustainability demands increase COGS and complexity.
| Metric | 2024 value | Impact |
|---|---|---|
| Points of sale | ~5,000 | Broad exposure to switching |
| Starbucks Rewards (US) | ≈34m | Loyalty buffer |
| Domino’s digital | ≈70% | Digital expectations |
| LAC GDP (IMF WEO) | ≈2.4% | Price elasticity |
| Volume volatility | 5–10% | Sensitivity to price |
| Loyalty churn | ≈30% | Retention risk |
Preview the Actual Deliverable
Alsea Porter's Five Forces Analysis
This preview shows the exact Alsea Porter's Five Forces Analysis you'll receive immediately after purchase—no surprises, no placeholders. The document is fully formatted, professional, and ready for download and use the moment you buy. You're viewing the final deliverable.
Description
A Must-Have Tool for Decision-Makers
Alsea faces moderate supplier power, strong buyer expectations, intense rivalry among global brands and modest new-entrant threats due to scale and franchising. Digital channels and multi-brand scale are strategic advantages. This brief highlights key tensions. Unlock the full Porter's Five Forces Analysis to get force-by-force ratings, visuals and actionable strategy for Alsea.
Suppliers Bargaining Power
Franchisors control key terms
Global licensors like Starbucks (~36,000 stores in 2024), Domino’s (~20,000) and Burger King (~19,000) set standards, royalties and sourcing rules, concentrating IP and supply control; royalty and marketing fees commonly total 6–10% of sales. Contract renewals and territory limits can compress Alsea’s margins, while compliance costs and limited operational flexibility strengthen supplier leverage.
Concentrated beverage inputs
Coffee, syrups and branded beverages for Alsea largely come from approved or captive suppliers, creating high switching costs due to strict quality specifications and limited substitutes. Currency swings across LATAM and Europe amplify input-price volatility for imported concentrates and raw beans. Volume rebates reduce billed costs but do not fully offset supplier leverage. Net bargaining power remains skewed toward suppliers.
Food commodities volatility
Dairy, wheat, proteins and produce come from fragmented suppliers yet remain exposed to global price shocks; the FAO Food Price Index stayed elevated in 2024, keeping input volatility high. Hedging and multi-sourcing reduce risk but persistent inflation cycles have compressed store-level EBITDA for operators like Alsea. Stricter safety and traceability rules narrow eligible vendors, and cost pass-through is often infeasible in price-sensitive markets.
Equipment and tech dependencies
Brand-specific ovens, POS and loyalty systems for Alsea come from a short list of approved vendors, and 2024 integration and certification processes cement supplier lock-in across banners. Recurring spend on upgrades and maintenance raises operating costs and creates downtime risk that can depress store-level margins. Vendor lead-times and contractual terms directly affect rollout speed and unit economics.
- Approved-vendor concentration increases switching costs
- Certification ties tech to long-term spend
- Upgrades/maintenance = recurring cost and downtime risk
- Vendor terms influence rollout pace and margins
Real estate and delivery platforms
Prime landlords and delivery aggregators act as gatekeepers to Alsea's traffic: delivery platforms commonly charge 20–30% commissions and prime retail rents often represent a high single-digit to low-double-digit share of sales, compressing margins and elevating operating leverage; co-marketing and exclusivity deals boost reach but reduce flexibility, while dependence on footfall and delivery volumes gives these suppliers clear negotiation leverage.
- Platform commissions: 20–30%
- Rents: high single-digit to low-double-digit % of sales
- Co-marketing trades flexibility for reach
- Footfall/delivery dependence increases supplier leverage
Margin squeeze:6–10%/20–30%/≈8–12%
Global licensors (Starbucks 36,000 stores 2024; Domino’s 20,000; Burger King 19,000) set royalties/standards (6–10% of sales) that limit Alsea’s margin flexibility. Approved/captive suppliers create high switching costs amid input-price volatility across LATAM/Europe. Delivery platforms (20–30% commission) and rents (≈8–12% of sales) further compress store-level EBITDA and increase supplier leverage.
| Item | Metric | Impact |
|---|---|---|
| Royalties | 6–10% sales | Margin squeeze |
| Platform fees | 20–30% commission | Lower net sales |
| Rents | ≈8–12% sales | Higher fixed costs |
What is included in the product
Detailed Word Document
Tailored Porter's Five Forces analysis of Alsea that uncovers key drivers of competition, buyer and supplier power, and the threat of substitutes and new entrants impacting pricing and profitability. Identifies disruptive forces, emerging threats, and strategic levers to defend market share and inform investor and management decisions.
Customizable Excel Spreadsheet
Clear one-sheet Porter's Five Forces for Alsea—condenses competitive pressures into a single view for fast strategic and investment decisions. Customize force intensities or export the accompanying radar chart for pitch decks or boardroom discussions.
Customers Bargaining Power
Many alternatives, low switching
Alsea’s ~5,000 points of sale in 2024 face consumers who can easily switch among QSR, casual dining, street food and convenience stores, so minimal switching costs heighten price sensitivity; promotions and bundles (frequent in-store and digital offers) materially drive traffic, while loyalty programs—despite ~30% churn in typical QSR loyalty cohorts—reduce but do not eliminate switching risk.
Price transparency via apps
Delivery marketplaces display prices and ratings side-by-side, making Alsea customers compare options instantly; dynamic promotions on platforms condition customers to expect discounts and inflate price sensitivity. Real-time visibility into delivery fees and prep times increases switching and negotiation power. This transparency elevates buyer leverage over menu pricing and margin management.
Segment-specific loyalty
Starbucks (≈34 million US Rewards members by 2024) and Domino’s (digital sales ≈70% of sales) generate strong brand loyalty that dampens buyer power for Alsea, but loyalty varies widely across banners and markets. Program generosity and rewards economics materially affect retention and margin dilution. Weaker banners show more elastic demand and greater sensitivity to price and promotions.
Health and quality expectations
Rising demand for healthier, local and sustainable options forces Alsea into menu reformulations and third-party certifications that raise COGS and operational complexity; 2024 surveys show sustainability and health claims drive purchase decisions, and negative reviews or social media spikes can rapidly divert traffic, with inconsistent standards across markets punished by buyers.
Macroeconomic sensitivity
In LATAM, wide real-income swings and material FX pass-through in 2024 raise price elasticity: IMF WEO 2024 projects LAC growth ~2.4% while inflation remains elevated, squeezing real incomes. Consumers trade down or cook at home during downturns, so small price moves can drive 5–10% volume volatility across quick-service segments. Value menus were decisive for traffic in 2024, shifting share to discount offerings.
- IMF WEO 2024: LAC GDP ~2.4%
- Elevated inflation in 2024 tightened real incomes
- Value menus drove traffic and market share shifts
Low switching costs and promo-driven volatility; loyalty and digital mix shield premium banners
Alsea’s ~5,000 points of sale face low switching costs and high promotion-driven price sensitivity; delivery marketplaces and visible fees/ratings amplify buyer leverage. Loyalty effects vary—Starbucks ≈34m US Rewards and Domino’s ≈70% digital sales protect premium banners, while weaker banners see ~30% churn and 5–10% volume swings in downturns. Sustainability demands increase COGS and complexity.
| Metric | 2024 value | Impact |
|---|---|---|
| Points of sale | ~5,000 | Broad exposure to switching |
| Starbucks Rewards (US) | ≈34m | Loyalty buffer |
| Domino’s digital | ≈70% | Digital expectations |
| LAC GDP (IMF WEO) | ≈2.4% | Price elasticity |
| Volume volatility | 5–10% | Sensitivity to price |
| Loyalty churn | ≈30% | Retention risk |
Preview the Actual Deliverable
Alsea Porter's Five Forces Analysis
This preview shows the exact Alsea Porter's Five Forces Analysis you'll receive immediately after purchase—no surprises, no placeholders. The document is fully formatted, professional, and ready for download and use the moment you buy. You're viewing the final deliverable.











