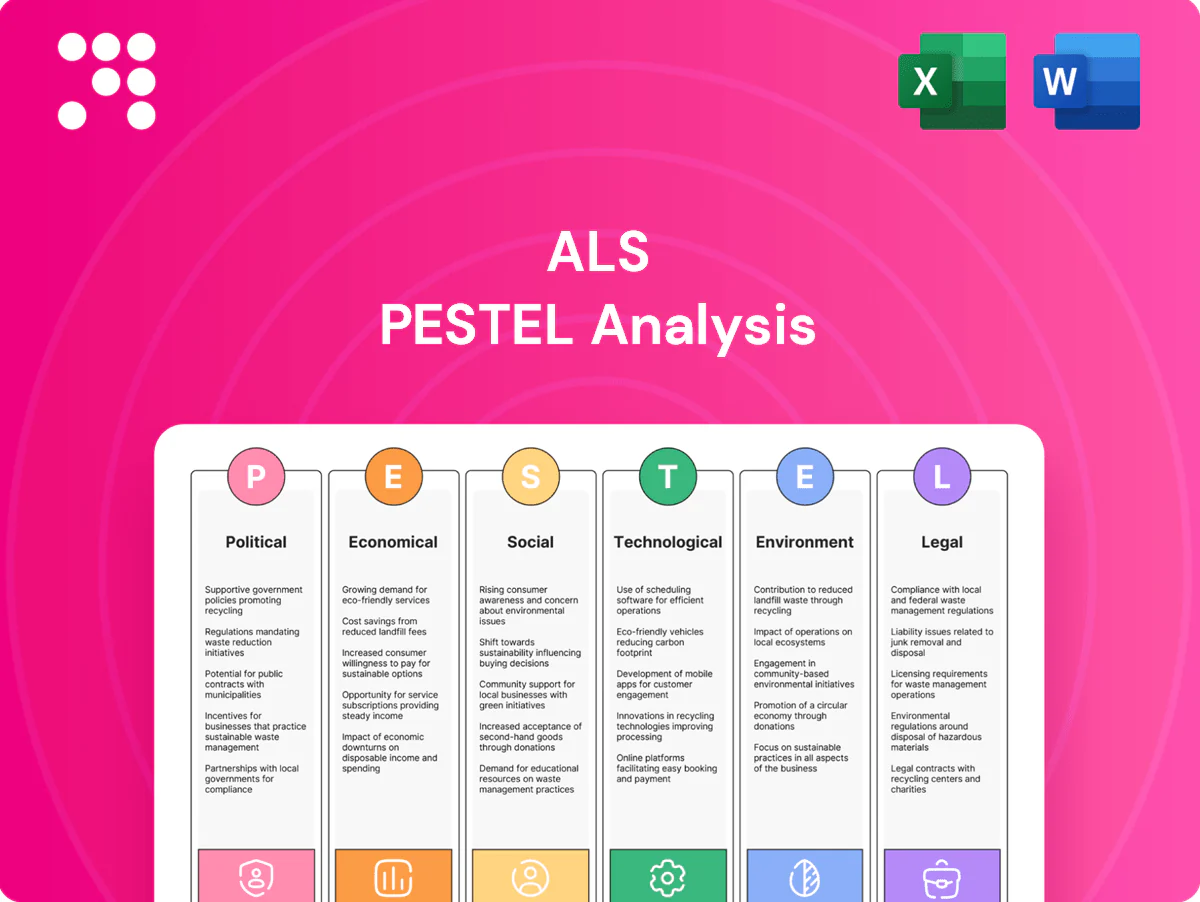
ALS PESTLE Analysis

Your Shortcut to Market Insight Starts Here
Unlock strategic clarity with our ALS PESTLE Analysis—concise, research-backed insights into political, economic, social, technological, legal, and environmental forces shaping the company. Ideal for investors and strategists, it highlights risks and opportunities you can act on now. Purchase the full report to access the complete, editable analysis and start making smarter decisions today.
Political factors

Geopolitical stability and trade policy
Operating across continents exposes ALS to sanctions, tariffs and export controls that can disrupt sample flows and client projects; shifts in trade relations affect cross-border shipment of test materials and equipment. Around 80% of global trade by volume moves by sea (UNCTAD), so border delays and customs uncertainty materially impact logistics. Diversified lab footprints and customs expertise help mitigate border friction. Monitoring geopolitical hotspots supports continuity planning.
Government infrastructure and public health spending
Budgets for water quality, environmental monitoring, food safety and pharmaceuticals are driven by stimulus and infrastructure packages such as the US Infrastructure Investment and Jobs Act (about 1.2 trillion USD), the American Rescue Plan (1.9 trillion USD) and EU NextGenerationEU (~800 billion EUR), which boost compliance and remediation testing demand; election cycles and shifting fiscal priorities can accelerate or delay program rollouts, so ALS can align capacity with funded national initiatives.

Resource sector policies and permitting
Resource-sector policies and permitting directly affect exploration activity and assay volumes; ALS reported FY2024 revenue of AUD 1.96 billion, with assay demand closely tied to mining capex cycles. Changes to permitting timelines, royalties or local-content rules shift client spend patterns and can defer field programs. Stable regimes encourage multi-year lab contracts while advocacy and local partnerships reduce policy risk.

Standards harmonization and international bodies
- ISO 167 membership drives global alignment
- Codex 189 facilitates food testing harmonization
- WHO 194 supports public-health lab standards
Public procurement and localization mandates
Many governments prefer accredited domestic labs or impose 30–50% localization targets in health and infrastructure tenders, shaping ALS site placement, hiring and JV decisions; public procurement represents about 12% of GDP (OECD) so winning local contracts materially affects revenue and growth. Transparent bidding and compliance documentation are strategic capabilities, and local political relationships support contract renewals and extensions.
Cross-border risks hit samples; sea trade ~80%, stimulus lifts testing; FY2024 revenue AUD 1.96bn
Cross-border risks (sanctions, tariffs, export controls) threaten sample flows; ~80% of global trade moves by sea (UNCTAD) increasing logistics exposure. Stimulus and infrastructure packages (US IIJA, ARP; EU NextGenerationEU) underpin testing demand; ALS FY2024 revenue AUD 1.96bn and public procurement ≈12% GDP (OECD) matter for contract wins. Localization targets 30–50% and alignment with ISO (≈167), Codex (189), WHO (194) shape site strategy.
| Metric | Value |
|---|---|
| FY2024 revenue | AUD 1.96bn |
| Sea trade | ~80% (UNCTAD) |
| Public procurement | ~12% GDP (OECD) |
| Localization targets | 30–50% |
| Standards bodies | ISO 167 / Codex 189 / WHO 194 |
What is included in the product
 Detailed Word Document
Explores how macro-environmental factors uniquely affect ALS across Political, Economic, Social, Technological, Environmental and Legal dimensions, with data-backed trends, region-specific regulatory context, forward-looking insights and actionable implications to help executives, consultants and investors identify risks and opportunities.

 Customizable Excel Spreadsheet
A concise, visually segmented ALS PESTLE summary that clarifies regulatory, technological and market risks for quick decision-making in meetings or presentations. Easily editable and shareable for team alignment, it supports strategy sessions by highlighting external threats and opportunities in plain language.
Economic factors

Commodity cycles and exploration spend
Assay volumes track metal prices and junior financing cycles, with lab workloads spiking in upturns and tightening capacity—industry reports showed sample volumes rising over 20% during recent metal rallies. Upswings expand margins while downturns compress pricing pressure. ALS diversification into life sciences and food (contributing about 25% of 2024 revenues) cushions cyclicality. Flexible staffing and automation reduce peak turnaround times by roughly 30%.
Global GDP and industrial production
Global GDP growth slowed to roughly 3.0% in 2024 with industrial production up modestly (~2–3%), lifting demand for TIC as manufacturing and trade expansion extends supply‑chain testing and inspection needs. Economic slowdowns trim routine batch testing and discretionary project work, while counter‑cyclical regulatory testing—often mandated during downturns—partially offsets volume declines. Regional growth mixes, with faster expansion in Asia vs. Europe/North America, drive lab consolidation and targeted network optimization to match volume and margin dynamics.

Inflation, labor, and energy costs
Input cost inflation has pushed reagent and consumable prices up an estimated 8-10% in 2023–24 and skilled technician wages rose ~4–5%, squeezing margins. Pricing power hinges on scarce accreditations and critical services, allowing selective pass-throughs. Energy-intensive labs saw energy costs down ~15–20% from 2022 peaks (IEA 2024) and benefit from efficiency upgrades and long-term PPAs. Index-linked contracts tied to ~3–4% CPI help defend margins.

Currency volatility
Revenue and costs in multiple currencies create translation and transaction risk for ALS; local revenues provide natural hedges but equipment and spare-part imports remain exposed. Robust hedging policies and diversified cash flows reduce earnings volatility, while contract pricing clauses (FX pass-through or indexation) can protect margins against extreme moves.
- Multi-currency exposure: translation + transaction risk
- Natural hedge: local cost bases vs import exposure
- Mitigants: hedging policies, diversified cash flows
- Contracts: FX pass-through/pricing clauses
M&A valuations and capital access
Industry fragmentation supports bolt-on acquisitions to add capabilities and geographies; policy rates around 5.25% (July 2025) and shifting risk appetite materially affect deal pipelines and multiples. Strong cash generation and free-cash-flow-backed discipline enable roll-ups and capex in labs targeting ROICs above 10%. Faster integration accelerates synergy capture and valuation uplift.
- Fragmentation: enables bolt-ons
- Rates: ~5.25% impact multiples
- Cash: supports disciplined roll-ups
- ROIC: >10% target for high-value labs
- Integration: speed = faster synergies
Cross-border risks hit samples; sea trade ~80%, stimulus lifts testing; FY2024 revenue AUD 1.96bn
Assay volumes track metal prices and junior financing cycles, driving >20% swings in sample volumes during rallies; life-sciences/food now ~25% of 2024 revenue, cushioning cyclicality. Global GDP ~3.0% (2024) and industrial output +2–3% support TIC demand, while reagent inflation ~8–10% and tech wages +4–5% squeeze margins; policy rates ~5.25% (Jul 2025) affect M&A multiples.
| Metric | Value |
|---|---|
| Life-sciences/food rev | ~25% (2024) |
| GDP growth | ~3.0% (2024) |
| Reagent inflation | 8–10% (2023–24) |
| Tech wage rise | 4–5% |
| Energy costs | -15–20% vs 2022 |
| Policy rate | ~5.25% (Jul 2025) |
Preview the Actual Deliverable
ALS PESTLE Analysis
The preview shown here is the exact ALS PESTLE Analysis document you’ll receive after purchase—fully formatted and ready to use. It contains the full political, economic, social, technological, legal and environmental assessment with professional structure. No placeholders or teasers—delivered exactly as displayed.

Your Shortcut to Market Insight Starts Here
Unlock strategic clarity with our ALS PESTLE Analysis—concise, research-backed insights into political, economic, social, technological, legal, and environmental forces shaping the company. Ideal for investors and strategists, it highlights risks and opportunities you can act on now. Purchase the full report to access the complete, editable analysis and start making smarter decisions today.
Political factors
Geopolitical stability and trade policy
Operating across continents exposes ALS to sanctions, tariffs and export controls that can disrupt sample flows and client projects; shifts in trade relations affect cross-border shipment of test materials and equipment. Around 80% of global trade by volume moves by sea (UNCTAD), so border delays and customs uncertainty materially impact logistics. Diversified lab footprints and customs expertise help mitigate border friction. Monitoring geopolitical hotspots supports continuity planning.
Government infrastructure and public health spending
Budgets for water quality, environmental monitoring, food safety and pharmaceuticals are driven by stimulus and infrastructure packages such as the US Infrastructure Investment and Jobs Act (about 1.2 trillion USD), the American Rescue Plan (1.9 trillion USD) and EU NextGenerationEU (~800 billion EUR), which boost compliance and remediation testing demand; election cycles and shifting fiscal priorities can accelerate or delay program rollouts, so ALS can align capacity with funded national initiatives.
Resource sector policies and permitting
Resource-sector policies and permitting directly affect exploration activity and assay volumes; ALS reported FY2024 revenue of AUD 1.96 billion, with assay demand closely tied to mining capex cycles. Changes to permitting timelines, royalties or local-content rules shift client spend patterns and can defer field programs. Stable regimes encourage multi-year lab contracts while advocacy and local partnerships reduce policy risk.
Standards harmonization and international bodies
- ISO 167 membership drives global alignment
- Codex 189 facilitates food testing harmonization
- WHO 194 supports public-health lab standards
Public procurement and localization mandates
Many governments prefer accredited domestic labs or impose 30–50% localization targets in health and infrastructure tenders, shaping ALS site placement, hiring and JV decisions; public procurement represents about 12% of GDP (OECD) so winning local contracts materially affects revenue and growth. Transparent bidding and compliance documentation are strategic capabilities, and local political relationships support contract renewals and extensions.
Cross-border risks hit samples; sea trade ~80%, stimulus lifts testing; FY2024 revenue AUD 1.96bn
Cross-border risks (sanctions, tariffs, export controls) threaten sample flows; ~80% of global trade moves by sea (UNCTAD) increasing logistics exposure. Stimulus and infrastructure packages (US IIJA, ARP; EU NextGenerationEU) underpin testing demand; ALS FY2024 revenue AUD 1.96bn and public procurement ≈12% GDP (OECD) matter for contract wins. Localization targets 30–50% and alignment with ISO (≈167), Codex (189), WHO (194) shape site strategy.
| Metric | Value |
|---|---|
| FY2024 revenue | AUD 1.96bn |
| Sea trade | ~80% (UNCTAD) |
| Public procurement | ~12% GDP (OECD) |
| Localization targets | 30–50% |
| Standards bodies | ISO 167 / Codex 189 / WHO 194 |
What is included in the product
Detailed Word Document
Explores how macro-environmental factors uniquely affect ALS across Political, Economic, Social, Technological, Environmental and Legal dimensions, with data-backed trends, region-specific regulatory context, forward-looking insights and actionable implications to help executives, consultants and investors identify risks and opportunities.
Customizable Excel Spreadsheet
A concise, visually segmented ALS PESTLE summary that clarifies regulatory, technological and market risks for quick decision-making in meetings or presentations. Easily editable and shareable for team alignment, it supports strategy sessions by highlighting external threats and opportunities in plain language.
Economic factors
Commodity cycles and exploration spend
Assay volumes track metal prices and junior financing cycles, with lab workloads spiking in upturns and tightening capacity—industry reports showed sample volumes rising over 20% during recent metal rallies. Upswings expand margins while downturns compress pricing pressure. ALS diversification into life sciences and food (contributing about 25% of 2024 revenues) cushions cyclicality. Flexible staffing and automation reduce peak turnaround times by roughly 30%.
Global GDP and industrial production
Global GDP growth slowed to roughly 3.0% in 2024 with industrial production up modestly (~2–3%), lifting demand for TIC as manufacturing and trade expansion extends supply‑chain testing and inspection needs. Economic slowdowns trim routine batch testing and discretionary project work, while counter‑cyclical regulatory testing—often mandated during downturns—partially offsets volume declines. Regional growth mixes, with faster expansion in Asia vs. Europe/North America, drive lab consolidation and targeted network optimization to match volume and margin dynamics.
Inflation, labor, and energy costs
Input cost inflation has pushed reagent and consumable prices up an estimated 8-10% in 2023–24 and skilled technician wages rose ~4–5%, squeezing margins. Pricing power hinges on scarce accreditations and critical services, allowing selective pass-throughs. Energy-intensive labs saw energy costs down ~15–20% from 2022 peaks (IEA 2024) and benefit from efficiency upgrades and long-term PPAs. Index-linked contracts tied to ~3–4% CPI help defend margins.
Currency volatility
Revenue and costs in multiple currencies create translation and transaction risk for ALS; local revenues provide natural hedges but equipment and spare-part imports remain exposed. Robust hedging policies and diversified cash flows reduce earnings volatility, while contract pricing clauses (FX pass-through or indexation) can protect margins against extreme moves.
- Multi-currency exposure: translation + transaction risk
- Natural hedge: local cost bases vs import exposure
- Mitigants: hedging policies, diversified cash flows
- Contracts: FX pass-through/pricing clauses
M&A valuations and capital access
Industry fragmentation supports bolt-on acquisitions to add capabilities and geographies; policy rates around 5.25% (July 2025) and shifting risk appetite materially affect deal pipelines and multiples. Strong cash generation and free-cash-flow-backed discipline enable roll-ups and capex in labs targeting ROICs above 10%. Faster integration accelerates synergy capture and valuation uplift.
- Fragmentation: enables bolt-ons
- Rates: ~5.25% impact multiples
- Cash: supports disciplined roll-ups
- ROIC: >10% target for high-value labs
- Integration: speed = faster synergies
Cross-border risks hit samples; sea trade ~80%, stimulus lifts testing; FY2024 revenue AUD 1.96bn
Assay volumes track metal prices and junior financing cycles, driving >20% swings in sample volumes during rallies; life-sciences/food now ~25% of 2024 revenue, cushioning cyclicality. Global GDP ~3.0% (2024) and industrial output +2–3% support TIC demand, while reagent inflation ~8–10% and tech wages +4–5% squeeze margins; policy rates ~5.25% (Jul 2025) affect M&A multiples.
| Metric | Value |
|---|---|
| Life-sciences/food rev | ~25% (2024) |
| GDP growth | ~3.0% (2024) |
| Reagent inflation | 8–10% (2023–24) |
| Tech wage rise | 4–5% |
| Energy costs | -15–20% vs 2022 |
| Policy rate | ~5.25% (Jul 2025) |
Preview the Actual Deliverable
ALS PESTLE Analysis
The preview shown here is the exact ALS PESTLE Analysis document you’ll receive after purchase—fully formatted and ready to use. It contains the full political, economic, social, technological, legal and environmental assessment with professional structure. No placeholders or teasers—delivered exactly as displayed.
Original: $10.00
-65%$10.00
$3.50Description
Your Shortcut to Market Insight Starts Here
Unlock strategic clarity with our ALS PESTLE Analysis—concise, research-backed insights into political, economic, social, technological, legal, and environmental forces shaping the company. Ideal for investors and strategists, it highlights risks and opportunities you can act on now. Purchase the full report to access the complete, editable analysis and start making smarter decisions today.
Political factors
Geopolitical stability and trade policy
Operating across continents exposes ALS to sanctions, tariffs and export controls that can disrupt sample flows and client projects; shifts in trade relations affect cross-border shipment of test materials and equipment. Around 80% of global trade by volume moves by sea (UNCTAD), so border delays and customs uncertainty materially impact logistics. Diversified lab footprints and customs expertise help mitigate border friction. Monitoring geopolitical hotspots supports continuity planning.
Government infrastructure and public health spending
Budgets for water quality, environmental monitoring, food safety and pharmaceuticals are driven by stimulus and infrastructure packages such as the US Infrastructure Investment and Jobs Act (about 1.2 trillion USD), the American Rescue Plan (1.9 trillion USD) and EU NextGenerationEU (~800 billion EUR), which boost compliance and remediation testing demand; election cycles and shifting fiscal priorities can accelerate or delay program rollouts, so ALS can align capacity with funded national initiatives.
Resource sector policies and permitting
Resource-sector policies and permitting directly affect exploration activity and assay volumes; ALS reported FY2024 revenue of AUD 1.96 billion, with assay demand closely tied to mining capex cycles. Changes to permitting timelines, royalties or local-content rules shift client spend patterns and can defer field programs. Stable regimes encourage multi-year lab contracts while advocacy and local partnerships reduce policy risk.
Standards harmonization and international bodies
- ISO 167 membership drives global alignment
- Codex 189 facilitates food testing harmonization
- WHO 194 supports public-health lab standards
Public procurement and localization mandates
Many governments prefer accredited domestic labs or impose 30–50% localization targets in health and infrastructure tenders, shaping ALS site placement, hiring and JV decisions; public procurement represents about 12% of GDP (OECD) so winning local contracts materially affects revenue and growth. Transparent bidding and compliance documentation are strategic capabilities, and local political relationships support contract renewals and extensions.
Cross-border risks hit samples; sea trade ~80%, stimulus lifts testing; FY2024 revenue AUD 1.96bn
Cross-border risks (sanctions, tariffs, export controls) threaten sample flows; ~80% of global trade moves by sea (UNCTAD) increasing logistics exposure. Stimulus and infrastructure packages (US IIJA, ARP; EU NextGenerationEU) underpin testing demand; ALS FY2024 revenue AUD 1.96bn and public procurement ≈12% GDP (OECD) matter for contract wins. Localization targets 30–50% and alignment with ISO (≈167), Codex (189), WHO (194) shape site strategy.
| Metric | Value |
|---|---|
| FY2024 revenue | AUD 1.96bn |
| Sea trade | ~80% (UNCTAD) |
| Public procurement | ~12% GDP (OECD) |
| Localization targets | 30–50% |
| Standards bodies | ISO 167 / Codex 189 / WHO 194 |
What is included in the product
Detailed Word Document
Explores how macro-environmental factors uniquely affect ALS across Political, Economic, Social, Technological, Environmental and Legal dimensions, with data-backed trends, region-specific regulatory context, forward-looking insights and actionable implications to help executives, consultants and investors identify risks and opportunities.
Customizable Excel Spreadsheet
A concise, visually segmented ALS PESTLE summary that clarifies regulatory, technological and market risks for quick decision-making in meetings or presentations. Easily editable and shareable for team alignment, it supports strategy sessions by highlighting external threats and opportunities in plain language.
Economic factors
Commodity cycles and exploration spend
Assay volumes track metal prices and junior financing cycles, with lab workloads spiking in upturns and tightening capacity—industry reports showed sample volumes rising over 20% during recent metal rallies. Upswings expand margins while downturns compress pricing pressure. ALS diversification into life sciences and food (contributing about 25% of 2024 revenues) cushions cyclicality. Flexible staffing and automation reduce peak turnaround times by roughly 30%.
Global GDP and industrial production
Global GDP growth slowed to roughly 3.0% in 2024 with industrial production up modestly (~2–3%), lifting demand for TIC as manufacturing and trade expansion extends supply‑chain testing and inspection needs. Economic slowdowns trim routine batch testing and discretionary project work, while counter‑cyclical regulatory testing—often mandated during downturns—partially offsets volume declines. Regional growth mixes, with faster expansion in Asia vs. Europe/North America, drive lab consolidation and targeted network optimization to match volume and margin dynamics.
Inflation, labor, and energy costs
Input cost inflation has pushed reagent and consumable prices up an estimated 8-10% in 2023–24 and skilled technician wages rose ~4–5%, squeezing margins. Pricing power hinges on scarce accreditations and critical services, allowing selective pass-throughs. Energy-intensive labs saw energy costs down ~15–20% from 2022 peaks (IEA 2024) and benefit from efficiency upgrades and long-term PPAs. Index-linked contracts tied to ~3–4% CPI help defend margins.
Currency volatility
Revenue and costs in multiple currencies create translation and transaction risk for ALS; local revenues provide natural hedges but equipment and spare-part imports remain exposed. Robust hedging policies and diversified cash flows reduce earnings volatility, while contract pricing clauses (FX pass-through or indexation) can protect margins against extreme moves.
- Multi-currency exposure: translation + transaction risk
- Natural hedge: local cost bases vs import exposure
- Mitigants: hedging policies, diversified cash flows
- Contracts: FX pass-through/pricing clauses
M&A valuations and capital access
Industry fragmentation supports bolt-on acquisitions to add capabilities and geographies; policy rates around 5.25% (July 2025) and shifting risk appetite materially affect deal pipelines and multiples. Strong cash generation and free-cash-flow-backed discipline enable roll-ups and capex in labs targeting ROICs above 10%. Faster integration accelerates synergy capture and valuation uplift.
- Fragmentation: enables bolt-ons
- Rates: ~5.25% impact multiples
- Cash: supports disciplined roll-ups
- ROIC: >10% target for high-value labs
- Integration: speed = faster synergies
Cross-border risks hit samples; sea trade ~80%, stimulus lifts testing; FY2024 revenue AUD 1.96bn
Assay volumes track metal prices and junior financing cycles, driving >20% swings in sample volumes during rallies; life-sciences/food now ~25% of 2024 revenue, cushioning cyclicality. Global GDP ~3.0% (2024) and industrial output +2–3% support TIC demand, while reagent inflation ~8–10% and tech wages +4–5% squeeze margins; policy rates ~5.25% (Jul 2025) affect M&A multiples.
| Metric | Value |
|---|---|
| Life-sciences/food rev | ~25% (2024) |
| GDP growth | ~3.0% (2024) |
| Reagent inflation | 8–10% (2023–24) |
| Tech wage rise | 4–5% |
| Energy costs | -15–20% vs 2022 |
| Policy rate | ~5.25% (Jul 2025) |
Preview the Actual Deliverable
ALS PESTLE Analysis
The preview shown here is the exact ALS PESTLE Analysis document you’ll receive after purchase—fully formatted and ready to use. It contains the full political, economic, social, technological, legal and environmental assessment with professional structure. No placeholders or teasers—delivered exactly as displayed.











