Alstom Porter's Five Forces Analysis

From Overview to Strategy Blueprint
Alstom faces moderate bargaining power from large public transit buyers and strong rivalry from Siemens and CRRC, while high capital requirements and long project cycles limit new entrants. Supplier concentration and technology shifts raise strategic risks. This brief snapshot only scratches the surface—unlock the full Porter's Five Forces Analysis to explore Alstom’s competitive dynamics in detail.
Suppliers Bargaining Power

Specialized components concentration
Core subsystems such as traction, signaling and semiconductors are sourced from a narrow supplier pool, giving vendors notable leverage; Alstom reported revenue of about €17.6bn in 2024, illustrating scale exposed to supplier risk. Qualification and safety certifications typically take 12–18 months, making switching slow and costly. Semiconductor and power-electronics lead times averaged ~20 weeks in 2024, disrupting schedules and pricing; Alstom mitigates via dual-sourcing and long-term framework agreements.
Certification-driven switching costs
Any supplier change triggers redesign, validation and homologation, inflating time and cost and risking months of delay; suppliers hence stay embedded in multi-year programs (typically 5–10 years), strengthening their mid-contract position. Alstom’s scale, with about 71,000 employees (2024), enables negotiation of upfront concessions and framework terms. Lifecycle service commitments further align incentives toward supplier reliability and long-term performance.

Commodity input volatility
Steel, copper and energy swings feed directly into supplier quotes for Alstom; 2024 European hot-rolled coil averaged ~€800/tonne, LME copper ~$9,100/tonne and EU TTF gas ~€40/MWh, driving margin pressure. Indexation clauses in contracts transfer cost moves to customers but with typical 3–9 month timing lags. Corporate hedging and volume aggregation across tenders dampen price shock transmission. Local sourcing rules in some markets limit cross-border optimization and bargaining flexibility.

ESG and compliance burden
- Traceability: fewer qualified suppliers
- Cost: compliance priced into bids
- Mitigation: supplier development lowers risk
- Risk: delivery delays and fines
Scale leverage and vendor rationalization
Global volumes across trains, signaling and services give Alstom scale leverage—FY 2023/24 revenue ~€17.6bn and order book >€70bn let it consolidate supplier spend and platform parts, lowering unit costs; however single-sourcing of critical components (e.g., bespoke traction systems) increases dependency, so balanced supplier portfolios preserve leverage without overexposure.
- Scale: FY 2023/24 revenue ~€17.6bn
- Rationalization: platform parts cut unit costs
- Risk: single-source critical items heighten dependency
- Mitigation: diversified supplier mix retains leverage
Narrow supplier pool, long lead times and CSRD compliance amplify vendor leverage
Critical subsystems sourced from a narrow supplier pool give vendors leverage; Alstom revenue €17.6bn (2024) and order book >€70bn concentrate spend yet single-source traction components raise dependency. Lead times (semiconductors/power electronics) ~20 weeks in 2024; switching is slow (12–18 months validation). ESG/regulatory scope (CSRD from 2024) narrows eligible suppliers, increasing compliance costs.
| Metric | 2024 value | Impact |
|---|---|---|
| Revenue | €17.6bn | Negotiation leverage |
| Order book | >€70bn | Consolidated spend |
| Lead times | ~20 weeks | Schedule risk |
| Validation | 12–18 months | Switching cost |
What is included in the product
 Detailed Word Document
Tailored exclusively for Alstom, this Porter's Five Forces analysis uncovers key drivers of competition, supplier and buyer power, and market entry risks. It identifies disruptive substitutes and emerging threats while evaluating how industry dynamics influence Alstom’s pricing, profitability, and strategic positioning.

 Customizable Excel Spreadsheet
A concise one-sheet Porter's Five Forces for Alstom—visual radar and editable pressure levels simplify strategic decisions and stress-test scenarios, ready to drop into pitch decks or Excel dashboards.
Customers Bargaining Power

Governmental buyer dominance
National and city transport agencies run formal tenders with high transparency and price sensitivity, with public procurement representing about 14% of EU GDP and rail contracts frequently exceeding €100m. Procurement often bundles vehicles, signaling and services, raising ticket size toward €100m–€1bn and increasing buyer leverage. Political and budget cycles (typically 4–5 year terms) shape timing and contract terms. Offsets and local content requirements of 30–50% further amplify buyer bargaining power.
Winner-takes-most tenders
Competitive RFPs pit major OEMs head-to-head, driving winner-takes-most awards that compress margins to mid-to-low single digits (around 3–6% on reported deals in 2023–24); small spec differences can swing contracts worth hundreds of millions, and buyers leverage tech parity to extract extended warranties and liquidated damages often up to ~5% of contract value; multi-year framework agreements (typically 3–7 years) further cap pricing and margin expansion.

Customization vs. standardization
Custom specs raise switching costs and weaken buyer leverage post-award as bespoke Alstom systems lock in integrations and maintenance regimes; platform-based offerings like Coradia and Avelia let Alstom price standardized modules more competitively. Buyers increasingly seek common platforms to lower lifecycle costs, shifting procurement toward modular solutions, and Alstom’s scale (about 75,000 employees in 2024) helps balance negotiation power across deal phases.

Lifecycle service lock-in
Long-term maintenance and availability contracts shift post-delivery leverage to Alstom by tying operators to OEM spare parts, diagnostics and scheduling services. Performance-based payments give buyers usage-based levers but often lock fleets to a single supplier, reducing multi-sourcing. Data-driven remote monitoring deepens dependency through proprietary analytics and IP. Mid-life upgrades create recurring negotiation points and renewal leverage for Alstom.
- service lock-in
- performance payments constrain multi-sourcing
- data dependency via proprietary analytics
- mid-life upgrades = negotiation cycles
Financing and risk transfer
Buyers frequently demand financing, guarantees and performance bonds (commonly 5–10% of contract value), forcing Alstom to offer turnkey or PPP structures that transfer construction and revenue risk onto the company. A strong balance sheet and consortium partners mitigate these demands, while 2024 macro rates (ECB ~4%) squeeze affordability and shift deal mix toward shorter tenors or higher-priced financing.
Public tenders (~14% EU GDP) give buyers leverage; OEM margins ~3–6%
Buyers hold strong leverage via transparent, bundled public tenders (public procurement ~14% of EU GDP) and large ticket sizes (€100m–€1bn), compressing OEM margins to ~3–6% (2023–24). Post-award lock-in from bespoke systems, long-term maintenance and proprietary analytics shift lifecycle power toward Alstom. Financing and guarantees (5–10% CV) plus 2024 rates (~4% ECB) raise buyer demands, offset by Alstom scale (75,000 employees, 2024).
| Metric | Value | Impact |
|---|---|---|
| Public procurement | ~14% EU GDP | High buyer leverage |
| Contract size | €100m–€1bn | Winner-takes-most |
| OEM margins | ~3–6% (2023–24) | Price pressure |
| Guarantees | 5–10% CV | Financing burden |
| ECB rate (2024) | ~4% | Affordability squeeze |
| Alstom headcount | 75,000 (2024) | Scale mitigant |
What You See Is What You Get
Alstom Porter's Five Forces Analysis
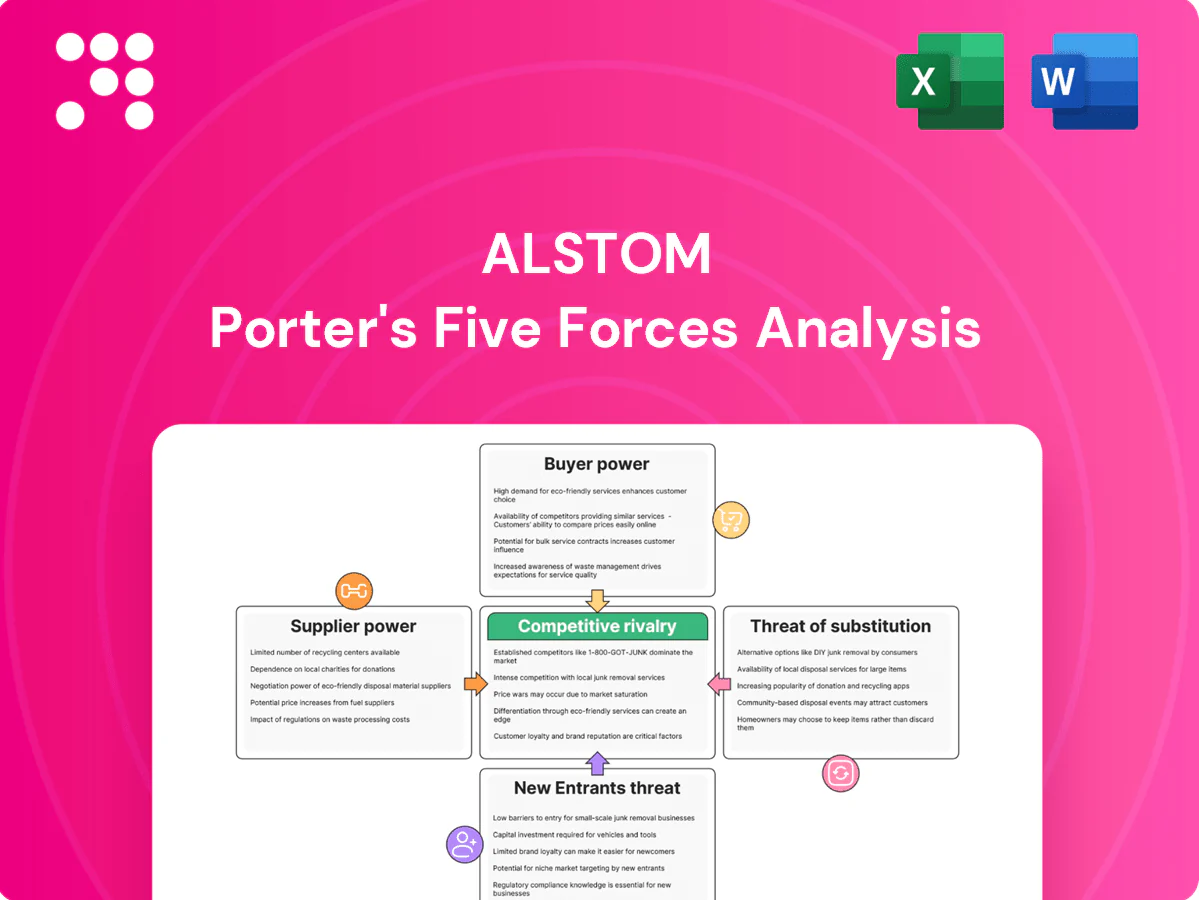
This preview displays the exact Alstom Porter’s Five Forces analysis you’ll receive after purchase—no placeholders or mockups. The document is the final, professionally formatted file covering competitive rivalry, supplier and buyer power, threats of new entrants and substitutes, and strategic implications. Buy once and get immediate access to this ready-to-use report.

From Overview to Strategy Blueprint
Alstom faces moderate bargaining power from large public transit buyers and strong rivalry from Siemens and CRRC, while high capital requirements and long project cycles limit new entrants. Supplier concentration and technology shifts raise strategic risks. This brief snapshot only scratches the surface—unlock the full Porter's Five Forces Analysis to explore Alstom’s competitive dynamics in detail.
Suppliers Bargaining Power
Specialized components concentration
Core subsystems such as traction, signaling and semiconductors are sourced from a narrow supplier pool, giving vendors notable leverage; Alstom reported revenue of about €17.6bn in 2024, illustrating scale exposed to supplier risk. Qualification and safety certifications typically take 12–18 months, making switching slow and costly. Semiconductor and power-electronics lead times averaged ~20 weeks in 2024, disrupting schedules and pricing; Alstom mitigates via dual-sourcing and long-term framework agreements.
Certification-driven switching costs
Any supplier change triggers redesign, validation and homologation, inflating time and cost and risking months of delay; suppliers hence stay embedded in multi-year programs (typically 5–10 years), strengthening their mid-contract position. Alstom’s scale, with about 71,000 employees (2024), enables negotiation of upfront concessions and framework terms. Lifecycle service commitments further align incentives toward supplier reliability and long-term performance.
Commodity input volatility
Steel, copper and energy swings feed directly into supplier quotes for Alstom; 2024 European hot-rolled coil averaged ~€800/tonne, LME copper ~$9,100/tonne and EU TTF gas ~€40/MWh, driving margin pressure. Indexation clauses in contracts transfer cost moves to customers but with typical 3–9 month timing lags. Corporate hedging and volume aggregation across tenders dampen price shock transmission. Local sourcing rules in some markets limit cross-border optimization and bargaining flexibility.
ESG and compliance burden
- Traceability: fewer qualified suppliers
- Cost: compliance priced into bids
- Mitigation: supplier development lowers risk
- Risk: delivery delays and fines
Scale leverage and vendor rationalization
Global volumes across trains, signaling and services give Alstom scale leverage—FY 2023/24 revenue ~€17.6bn and order book >€70bn let it consolidate supplier spend and platform parts, lowering unit costs; however single-sourcing of critical components (e.g., bespoke traction systems) increases dependency, so balanced supplier portfolios preserve leverage without overexposure.
- Scale: FY 2023/24 revenue ~€17.6bn
- Rationalization: platform parts cut unit costs
- Risk: single-source critical items heighten dependency
- Mitigation: diversified supplier mix retains leverage
Narrow supplier pool, long lead times and CSRD compliance amplify vendor leverage
Critical subsystems sourced from a narrow supplier pool give vendors leverage; Alstom revenue €17.6bn (2024) and order book >€70bn concentrate spend yet single-source traction components raise dependency. Lead times (semiconductors/power electronics) ~20 weeks in 2024; switching is slow (12–18 months validation). ESG/regulatory scope (CSRD from 2024) narrows eligible suppliers, increasing compliance costs.
| Metric | 2024 value | Impact |
|---|---|---|
| Revenue | €17.6bn | Negotiation leverage |
| Order book | >€70bn | Consolidated spend |
| Lead times | ~20 weeks | Schedule risk |
| Validation | 12–18 months | Switching cost |
What is included in the product
Detailed Word Document
Tailored exclusively for Alstom, this Porter's Five Forces analysis uncovers key drivers of competition, supplier and buyer power, and market entry risks. It identifies disruptive substitutes and emerging threats while evaluating how industry dynamics influence Alstom’s pricing, profitability, and strategic positioning.
Customizable Excel Spreadsheet
A concise one-sheet Porter's Five Forces for Alstom—visual radar and editable pressure levels simplify strategic decisions and stress-test scenarios, ready to drop into pitch decks or Excel dashboards.
Customers Bargaining Power
Governmental buyer dominance
National and city transport agencies run formal tenders with high transparency and price sensitivity, with public procurement representing about 14% of EU GDP and rail contracts frequently exceeding €100m. Procurement often bundles vehicles, signaling and services, raising ticket size toward €100m–€1bn and increasing buyer leverage. Political and budget cycles (typically 4–5 year terms) shape timing and contract terms. Offsets and local content requirements of 30–50% further amplify buyer bargaining power.
Winner-takes-most tenders
Competitive RFPs pit major OEMs head-to-head, driving winner-takes-most awards that compress margins to mid-to-low single digits (around 3–6% on reported deals in 2023–24); small spec differences can swing contracts worth hundreds of millions, and buyers leverage tech parity to extract extended warranties and liquidated damages often up to ~5% of contract value; multi-year framework agreements (typically 3–7 years) further cap pricing and margin expansion.
Customization vs. standardization
Custom specs raise switching costs and weaken buyer leverage post-award as bespoke Alstom systems lock in integrations and maintenance regimes; platform-based offerings like Coradia and Avelia let Alstom price standardized modules more competitively. Buyers increasingly seek common platforms to lower lifecycle costs, shifting procurement toward modular solutions, and Alstom’s scale (about 75,000 employees in 2024) helps balance negotiation power across deal phases.
Lifecycle service lock-in
Long-term maintenance and availability contracts shift post-delivery leverage to Alstom by tying operators to OEM spare parts, diagnostics and scheduling services. Performance-based payments give buyers usage-based levers but often lock fleets to a single supplier, reducing multi-sourcing. Data-driven remote monitoring deepens dependency through proprietary analytics and IP. Mid-life upgrades create recurring negotiation points and renewal leverage for Alstom.
- service lock-in
- performance payments constrain multi-sourcing
- data dependency via proprietary analytics
- mid-life upgrades = negotiation cycles
Financing and risk transfer
Buyers frequently demand financing, guarantees and performance bonds (commonly 5–10% of contract value), forcing Alstom to offer turnkey or PPP structures that transfer construction and revenue risk onto the company. A strong balance sheet and consortium partners mitigate these demands, while 2024 macro rates (ECB ~4%) squeeze affordability and shift deal mix toward shorter tenors or higher-priced financing.
Public tenders (~14% EU GDP) give buyers leverage; OEM margins ~3–6%
Buyers hold strong leverage via transparent, bundled public tenders (public procurement ~14% of EU GDP) and large ticket sizes (€100m–€1bn), compressing OEM margins to ~3–6% (2023–24). Post-award lock-in from bespoke systems, long-term maintenance and proprietary analytics shift lifecycle power toward Alstom. Financing and guarantees (5–10% CV) plus 2024 rates (~4% ECB) raise buyer demands, offset by Alstom scale (75,000 employees, 2024).
| Metric | Value | Impact |
|---|---|---|
| Public procurement | ~14% EU GDP | High buyer leverage |
| Contract size | €100m–€1bn | Winner-takes-most |
| OEM margins | ~3–6% (2023–24) | Price pressure |
| Guarantees | 5–10% CV | Financing burden |
| ECB rate (2024) | ~4% | Affordability squeeze |
| Alstom headcount | 75,000 (2024) | Scale mitigant |
What You See Is What You Get
Alstom Porter's Five Forces Analysis
This preview displays the exact Alstom Porter’s Five Forces analysis you’ll receive after purchase—no placeholders or mockups. The document is the final, professionally formatted file covering competitive rivalry, supplier and buyer power, threats of new entrants and substitutes, and strategic implications. Buy once and get immediate access to this ready-to-use report.
Original: $10.00
-65%$10.00
$3.50Description
From Overview to Strategy Blueprint
Alstom faces moderate bargaining power from large public transit buyers and strong rivalry from Siemens and CRRC, while high capital requirements and long project cycles limit new entrants. Supplier concentration and technology shifts raise strategic risks. This brief snapshot only scratches the surface—unlock the full Porter's Five Forces Analysis to explore Alstom’s competitive dynamics in detail.
Suppliers Bargaining Power
Specialized components concentration
Core subsystems such as traction, signaling and semiconductors are sourced from a narrow supplier pool, giving vendors notable leverage; Alstom reported revenue of about €17.6bn in 2024, illustrating scale exposed to supplier risk. Qualification and safety certifications typically take 12–18 months, making switching slow and costly. Semiconductor and power-electronics lead times averaged ~20 weeks in 2024, disrupting schedules and pricing; Alstom mitigates via dual-sourcing and long-term framework agreements.
Certification-driven switching costs
Any supplier change triggers redesign, validation and homologation, inflating time and cost and risking months of delay; suppliers hence stay embedded in multi-year programs (typically 5–10 years), strengthening their mid-contract position. Alstom’s scale, with about 71,000 employees (2024), enables negotiation of upfront concessions and framework terms. Lifecycle service commitments further align incentives toward supplier reliability and long-term performance.
Commodity input volatility
Steel, copper and energy swings feed directly into supplier quotes for Alstom; 2024 European hot-rolled coil averaged ~€800/tonne, LME copper ~$9,100/tonne and EU TTF gas ~€40/MWh, driving margin pressure. Indexation clauses in contracts transfer cost moves to customers but with typical 3–9 month timing lags. Corporate hedging and volume aggregation across tenders dampen price shock transmission. Local sourcing rules in some markets limit cross-border optimization and bargaining flexibility.
ESG and compliance burden
- Traceability: fewer qualified suppliers
- Cost: compliance priced into bids
- Mitigation: supplier development lowers risk
- Risk: delivery delays and fines
Scale leverage and vendor rationalization
Global volumes across trains, signaling and services give Alstom scale leverage—FY 2023/24 revenue ~€17.6bn and order book >€70bn let it consolidate supplier spend and platform parts, lowering unit costs; however single-sourcing of critical components (e.g., bespoke traction systems) increases dependency, so balanced supplier portfolios preserve leverage without overexposure.
- Scale: FY 2023/24 revenue ~€17.6bn
- Rationalization: platform parts cut unit costs
- Risk: single-source critical items heighten dependency
- Mitigation: diversified supplier mix retains leverage
Narrow supplier pool, long lead times and CSRD compliance amplify vendor leverage
Critical subsystems sourced from a narrow supplier pool give vendors leverage; Alstom revenue €17.6bn (2024) and order book >€70bn concentrate spend yet single-source traction components raise dependency. Lead times (semiconductors/power electronics) ~20 weeks in 2024; switching is slow (12–18 months validation). ESG/regulatory scope (CSRD from 2024) narrows eligible suppliers, increasing compliance costs.
| Metric | 2024 value | Impact |
|---|---|---|
| Revenue | €17.6bn | Negotiation leverage |
| Order book | >€70bn | Consolidated spend |
| Lead times | ~20 weeks | Schedule risk |
| Validation | 12–18 months | Switching cost |
What is included in the product
Detailed Word Document
Tailored exclusively for Alstom, this Porter's Five Forces analysis uncovers key drivers of competition, supplier and buyer power, and market entry risks. It identifies disruptive substitutes and emerging threats while evaluating how industry dynamics influence Alstom’s pricing, profitability, and strategic positioning.
Customizable Excel Spreadsheet
A concise one-sheet Porter's Five Forces for Alstom—visual radar and editable pressure levels simplify strategic decisions and stress-test scenarios, ready to drop into pitch decks or Excel dashboards.
Customers Bargaining Power
Governmental buyer dominance
National and city transport agencies run formal tenders with high transparency and price sensitivity, with public procurement representing about 14% of EU GDP and rail contracts frequently exceeding €100m. Procurement often bundles vehicles, signaling and services, raising ticket size toward €100m–€1bn and increasing buyer leverage. Political and budget cycles (typically 4–5 year terms) shape timing and contract terms. Offsets and local content requirements of 30–50% further amplify buyer bargaining power.
Winner-takes-most tenders
Competitive RFPs pit major OEMs head-to-head, driving winner-takes-most awards that compress margins to mid-to-low single digits (around 3–6% on reported deals in 2023–24); small spec differences can swing contracts worth hundreds of millions, and buyers leverage tech parity to extract extended warranties and liquidated damages often up to ~5% of contract value; multi-year framework agreements (typically 3–7 years) further cap pricing and margin expansion.
Customization vs. standardization
Custom specs raise switching costs and weaken buyer leverage post-award as bespoke Alstom systems lock in integrations and maintenance regimes; platform-based offerings like Coradia and Avelia let Alstom price standardized modules more competitively. Buyers increasingly seek common platforms to lower lifecycle costs, shifting procurement toward modular solutions, and Alstom’s scale (about 75,000 employees in 2024) helps balance negotiation power across deal phases.
Lifecycle service lock-in
Long-term maintenance and availability contracts shift post-delivery leverage to Alstom by tying operators to OEM spare parts, diagnostics and scheduling services. Performance-based payments give buyers usage-based levers but often lock fleets to a single supplier, reducing multi-sourcing. Data-driven remote monitoring deepens dependency through proprietary analytics and IP. Mid-life upgrades create recurring negotiation points and renewal leverage for Alstom.
- service lock-in
- performance payments constrain multi-sourcing
- data dependency via proprietary analytics
- mid-life upgrades = negotiation cycles
Financing and risk transfer
Buyers frequently demand financing, guarantees and performance bonds (commonly 5–10% of contract value), forcing Alstom to offer turnkey or PPP structures that transfer construction and revenue risk onto the company. A strong balance sheet and consortium partners mitigate these demands, while 2024 macro rates (ECB ~4%) squeeze affordability and shift deal mix toward shorter tenors or higher-priced financing.
Public tenders (~14% EU GDP) give buyers leverage; OEM margins ~3–6%
Buyers hold strong leverage via transparent, bundled public tenders (public procurement ~14% of EU GDP) and large ticket sizes (€100m–€1bn), compressing OEM margins to ~3–6% (2023–24). Post-award lock-in from bespoke systems, long-term maintenance and proprietary analytics shift lifecycle power toward Alstom. Financing and guarantees (5–10% CV) plus 2024 rates (~4% ECB) raise buyer demands, offset by Alstom scale (75,000 employees, 2024).
| Metric | Value | Impact |
|---|---|---|
| Public procurement | ~14% EU GDP | High buyer leverage |
| Contract size | €100m–€1bn | Winner-takes-most |
| OEM margins | ~3–6% (2023–24) | Price pressure |
| Guarantees | 5–10% CV | Financing burden |
| ECB rate (2024) | ~4% | Affordability squeeze |
| Alstom headcount | 75,000 (2024) | Scale mitigant |
What You See Is What You Get
Alstom Porter's Five Forces Analysis
This preview displays the exact Alstom Porter’s Five Forces analysis you’ll receive after purchase—no placeholders or mockups. The document is the final, professionally formatted file covering competitive rivalry, supplier and buyer power, threats of new entrants and substitutes, and strategic implications. Buy once and get immediate access to this ready-to-use report.











