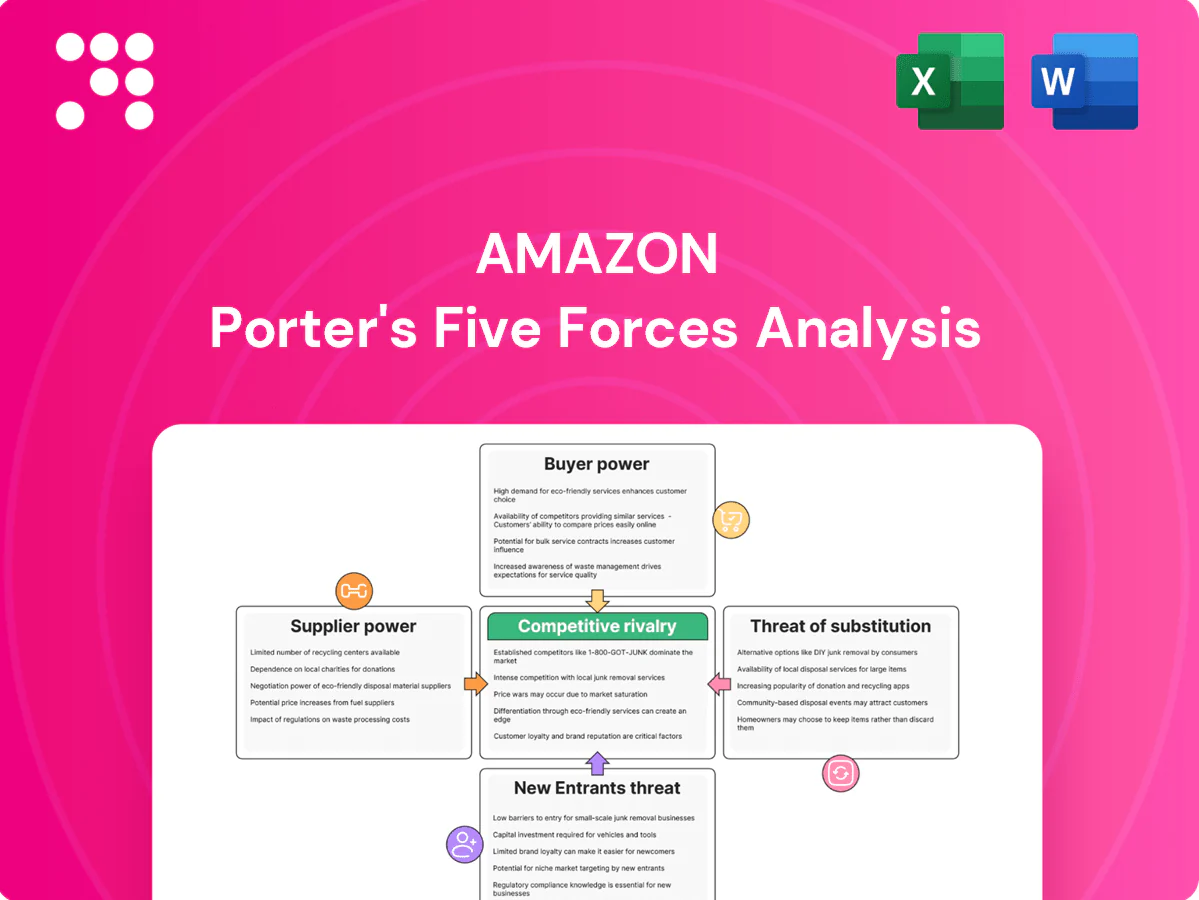
Amazon Porter's Five Forces Analysis

Go Beyond the Preview—Access the Full Strategic Report
Amazon's dominance rests on scale, logistics superiority, and ecosystem lock-in, but faces pressure from regulatory scrutiny, rising supplier costs, and nimble niche competitors. Buyer power is moderated by convenience; threat of substitutes varies by segment. Ready to move beyond the basics? Get a full strategic breakdown of Amazon’s market position, competitive intensity, and external threats—all in one powerful analysis.
Suppliers Bargaining Power

Diverse, fragmented vendor base
Amazon sources from over 9 million sellers, manufacturers, and publishers worldwide as of 2024, diluting individual supplier leverage. Switching among comparable vendors is easy in many categories, and Amazon’s scale purchasing plus real-time sales and inventory data reduce dependency on any single supplier. Exceptions remain for niche, branded or limited-run inventory where alternatives are scarce.
Concentrated tech and chip dependencies
AWS and Amazon devices depend on a handful of leading semiconductor and networking suppliers, with TSMC holding roughly 53% of pure‑play foundry revenue in 2024, concentrating supplier power. Capacity cycles and leading‑edge node tightness have historically pushed wafer and lead‑time-driven costs up by double digits in peak years. Long‑term contracts and multi‑sourcing lower risk, but bargaining power still favors critical component makers. Amazon’s custom silicon (Graviton) reduces but does not remove supplier exposure.

Logistics and last-mile partners
Despite a vast in-house network, Amazon still relies on carriers, airlines and regional couriers; Amazon Air operated over 80 cargo aircraft by 2024 and the company continues large-scale contracts with third-party carriers.
Peak-season capacity tightness and fuel-price volatility periodically boost partner leverage, with parcel spot-rate swings in recent years showing double-digit percentage volatility.
Amazon’s broad contracting and vertical integration—warehouses, fleet and drone pilots—incrementally curb supplier power, though labor constraints at logistics partners can reintroduce pressure during peaks.

Content and media rights holders
- concentrated-licensors: global paid subs ~1.2B (2023)
- pricing-power: live sports rights ~ $1B/year (NFL TNF)
- mitigation: multi-year deals + expanding originals
- pressure: intense streamer bidding keeps fees high
Cloud software and infrastructure inputs
AWS depends on data‑center hardware, power and real estate; as of 2024 AWS operates 31 regions and 99 Availability Zones, and had 400+ renewable energy projects, making utilities and landlords strategically important. Long‑term PPAs and self‑built facilities lower energy and capacity risk but tie up capital; local permitting and grid constraints amplify supplier leverage.
- Data centers: 31 regions / 99 AZs (2024)
- Renewables: 400+ projects (2024)
- Impact: PPAs cut energy risk but raise capital needs
- Regulation: permitting timelines increase local supplier power
Supplier power mixed: weak retail (9M+ sellers) vs strong chip & logistics leverage
Supplier power is mixed: retail suppliers weak given 9+ million sellers (2024) and easy switching, while semiconductors (TSMC ~53% foundry share, 2024) and premium content licensors hold strong leverage. Logistics partners (Amazon Air ~80 aircraft, 2024) and data‑center utilities/permits (AWS 31 regions/99 AZs, 2024) create periodic pressure. Vertical integration and long‑term contracts mitigate but do not eliminate supplier risk.
| Metric | 2024 Value |
|---|---|
| Marketplace sellers | 9M+ |
| TSMC foundry share | ~53% |
| Amazon Air fleet | ~80 aircraft |
| AWS regions / AZs | 31 / 99 |
| Renewable projects (AWS) | 400+ |
What is included in the product
 Detailed Word Document
Comprehensive Porter's Five Forces analysis of Amazon, uncovering competitive intensity, buyer and supplier power, threat of substitutes and new entrants, and regulatory or technological disruptors shaping margins and market share; strategic insights highlight Amazon's defensive moats and areas of vulnerability for investors and managers.

 Customizable Excel Spreadsheet
A concise one-sheet Porter's Five Forces for Amazon that visualizes competitive pressure with a spider chart, lets you tweak force intensities to model scenarios, and exports cleanly into decks—no macros or complex setup.
Customers Bargaining Power

Highly price-sensitive shoppers
Consumers can compare prices instantly across marketplaces, and low switching costs raise buyer leverage, squeezing take rates and margins. Amazon offsets with Prime (over 200 million members reported by analysts in 2024), fast shipping and broad assortment to boost stickiness. Price-matching dynamics intensify during promotions — Adobe reported about $12.4B in US Prime Day sales in 2023 — amplifying short-term margin pressure.
Enterprise cloud customers negotiate
Large AWS customers secure volume discounts and custom contracts via Enterprise Discount Programs; AWS held about 32% of the cloud market in 2024 (Synergy Research Group). High multi-cloud adoption — ~92% of firms in the 2024 Flexera report — boosts customer leverage. Deep integrations and proprietary value-added services raise switching costs, while pay-as-you-go pricing tempers but does not eliminate negotiation power.

Third-party sellers as customers
Third-party sellers—who account for over half of paid units on Amazon—buy fulfillment, advertising, and services from Amazon, creating dependency on its traffic and logistics. Many multi-home across eBay, Walmart, and Shopify, and fee sensitivity (commissions plus FBA often in the ~15–30% range) can drive mix shifts or off-Amazon fulfillment. Transparency in policy and seller tooling materially shapes sellers’ perceived bargaining power.

Advertising buyers optimize ROI
Advertising buyers on Amazon reallocate budgets rapidly to highest-performing SKUs; auction dynamics compress publisher take-rates when ROI falls, while Amazon’s rich first-party retail data—supporting an annualized ad revenue run-rate of ~40 billion in 2024—increases advertiser reliance. Improving attribution tools can either strengthen buyer leverage or justify higher ad spend by proving incremental sales.
- rapid-shifts: budget reallocation in days
- auctions: lower take-rates as ROI weakens
- data-dependency: 2024 ad run-rate ~40B
- attribution: empowers buyers or validates spend
Churn risk despite ecosystem lock-in
Prime, devices, and subscriptions create strong ecosystem lock-in—Amazon estimated ~200 million Prime members worldwide in 2024—yet outages, price hikes or policy shifts have repeatedly triggered pockets of churn; customer reviews and ratings (over 100M product reviews) amplify collective bargaining by shaping purchase and exit decisions, so responsive CX and platform reliability are critical mitigants.
- Lock-in: Prime ~200M (2024 est)
- Risk drivers: outages, price hikes, policy changes
- Amplifiers: >100M reviews boosting collective power
- Mitigants: fast CX, high uptime, transparent policy
Ecosystem scale and subscriptions vs. margin pressure from price‑sensitive customers
Customers wield high price sensitivity and low switching costs across retail, ads and cloud, pressuring margins; Amazon counters with Prime (~200M members in 2024), fast shipping and ecosystem lock-in. AWS enterprise deals and integrations raise switching costs despite ~32% cloud share (2024). Sellers (>50% paid units) and advertisers (~$40B ad run‑rate 2024) retain negotiation leverage via multi‑home strategies.
| Metric | 2024 Value |
|---|---|
| Prime members | ~200M |
| AWS share | ~32% |
| Ad run‑rate | $40B |
| Seller paid units | >50% |
Same Document Delivered
Amazon Porter's Five Forces Analysis
This preview shows the exact Amazon Porter’s Five Forces Analysis you’ll receive after purchase—no placeholders or samples. It is the full, professionally formatted file, ready for immediate download. Once you buy, you get this identical document instantly.

Go Beyond the Preview—Access the Full Strategic Report
Amazon's dominance rests on scale, logistics superiority, and ecosystem lock-in, but faces pressure from regulatory scrutiny, rising supplier costs, and nimble niche competitors. Buyer power is moderated by convenience; threat of substitutes varies by segment. Ready to move beyond the basics? Get a full strategic breakdown of Amazon’s market position, competitive intensity, and external threats—all in one powerful analysis.
Suppliers Bargaining Power
Diverse, fragmented vendor base
Amazon sources from over 9 million sellers, manufacturers, and publishers worldwide as of 2024, diluting individual supplier leverage. Switching among comparable vendors is easy in many categories, and Amazon’s scale purchasing plus real-time sales and inventory data reduce dependency on any single supplier. Exceptions remain for niche, branded or limited-run inventory where alternatives are scarce.
Concentrated tech and chip dependencies
AWS and Amazon devices depend on a handful of leading semiconductor and networking suppliers, with TSMC holding roughly 53% of pure‑play foundry revenue in 2024, concentrating supplier power. Capacity cycles and leading‑edge node tightness have historically pushed wafer and lead‑time-driven costs up by double digits in peak years. Long‑term contracts and multi‑sourcing lower risk, but bargaining power still favors critical component makers. Amazon’s custom silicon (Graviton) reduces but does not remove supplier exposure.
Logistics and last-mile partners
Despite a vast in-house network, Amazon still relies on carriers, airlines and regional couriers; Amazon Air operated over 80 cargo aircraft by 2024 and the company continues large-scale contracts with third-party carriers.
Peak-season capacity tightness and fuel-price volatility periodically boost partner leverage, with parcel spot-rate swings in recent years showing double-digit percentage volatility.
Amazon’s broad contracting and vertical integration—warehouses, fleet and drone pilots—incrementally curb supplier power, though labor constraints at logistics partners can reintroduce pressure during peaks.
Content and media rights holders
- concentrated-licensors: global paid subs ~1.2B (2023)
- pricing-power: live sports rights ~ $1B/year (NFL TNF)
- mitigation: multi-year deals + expanding originals
- pressure: intense streamer bidding keeps fees high
Cloud software and infrastructure inputs
AWS depends on data‑center hardware, power and real estate; as of 2024 AWS operates 31 regions and 99 Availability Zones, and had 400+ renewable energy projects, making utilities and landlords strategically important. Long‑term PPAs and self‑built facilities lower energy and capacity risk but tie up capital; local permitting and grid constraints amplify supplier leverage.
- Data centers: 31 regions / 99 AZs (2024)
- Renewables: 400+ projects (2024)
- Impact: PPAs cut energy risk but raise capital needs
- Regulation: permitting timelines increase local supplier power
Supplier power mixed: weak retail (9M+ sellers) vs strong chip & logistics leverage
Supplier power is mixed: retail suppliers weak given 9+ million sellers (2024) and easy switching, while semiconductors (TSMC ~53% foundry share, 2024) and premium content licensors hold strong leverage. Logistics partners (Amazon Air ~80 aircraft, 2024) and data‑center utilities/permits (AWS 31 regions/99 AZs, 2024) create periodic pressure. Vertical integration and long‑term contracts mitigate but do not eliminate supplier risk.
| Metric | 2024 Value |
|---|---|
| Marketplace sellers | 9M+ |
| TSMC foundry share | ~53% |
| Amazon Air fleet | ~80 aircraft |
| AWS regions / AZs | 31 / 99 |
| Renewable projects (AWS) | 400+ |
What is included in the product
Detailed Word Document
Comprehensive Porter's Five Forces analysis of Amazon, uncovering competitive intensity, buyer and supplier power, threat of substitutes and new entrants, and regulatory or technological disruptors shaping margins and market share; strategic insights highlight Amazon's defensive moats and areas of vulnerability for investors and managers.
Customizable Excel Spreadsheet
A concise one-sheet Porter's Five Forces for Amazon that visualizes competitive pressure with a spider chart, lets you tweak force intensities to model scenarios, and exports cleanly into decks—no macros or complex setup.
Customers Bargaining Power
Highly price-sensitive shoppers
Consumers can compare prices instantly across marketplaces, and low switching costs raise buyer leverage, squeezing take rates and margins. Amazon offsets with Prime (over 200 million members reported by analysts in 2024), fast shipping and broad assortment to boost stickiness. Price-matching dynamics intensify during promotions — Adobe reported about $12.4B in US Prime Day sales in 2023 — amplifying short-term margin pressure.
Enterprise cloud customers negotiate
Large AWS customers secure volume discounts and custom contracts via Enterprise Discount Programs; AWS held about 32% of the cloud market in 2024 (Synergy Research Group). High multi-cloud adoption — ~92% of firms in the 2024 Flexera report — boosts customer leverage. Deep integrations and proprietary value-added services raise switching costs, while pay-as-you-go pricing tempers but does not eliminate negotiation power.
Third-party sellers as customers
Third-party sellers—who account for over half of paid units on Amazon—buy fulfillment, advertising, and services from Amazon, creating dependency on its traffic and logistics. Many multi-home across eBay, Walmart, and Shopify, and fee sensitivity (commissions plus FBA often in the ~15–30% range) can drive mix shifts or off-Amazon fulfillment. Transparency in policy and seller tooling materially shapes sellers’ perceived bargaining power.
Advertising buyers optimize ROI
Advertising buyers on Amazon reallocate budgets rapidly to highest-performing SKUs; auction dynamics compress publisher take-rates when ROI falls, while Amazon’s rich first-party retail data—supporting an annualized ad revenue run-rate of ~40 billion in 2024—increases advertiser reliance. Improving attribution tools can either strengthen buyer leverage or justify higher ad spend by proving incremental sales.
- rapid-shifts: budget reallocation in days
- auctions: lower take-rates as ROI weakens
- data-dependency: 2024 ad run-rate ~40B
- attribution: empowers buyers or validates spend
Churn risk despite ecosystem lock-in
Prime, devices, and subscriptions create strong ecosystem lock-in—Amazon estimated ~200 million Prime members worldwide in 2024—yet outages, price hikes or policy shifts have repeatedly triggered pockets of churn; customer reviews and ratings (over 100M product reviews) amplify collective bargaining by shaping purchase and exit decisions, so responsive CX and platform reliability are critical mitigants.
- Lock-in: Prime ~200M (2024 est)
- Risk drivers: outages, price hikes, policy changes
- Amplifiers: >100M reviews boosting collective power
- Mitigants: fast CX, high uptime, transparent policy
Ecosystem scale and subscriptions vs. margin pressure from price‑sensitive customers
Customers wield high price sensitivity and low switching costs across retail, ads and cloud, pressuring margins; Amazon counters with Prime (~200M members in 2024), fast shipping and ecosystem lock-in. AWS enterprise deals and integrations raise switching costs despite ~32% cloud share (2024). Sellers (>50% paid units) and advertisers (~$40B ad run‑rate 2024) retain negotiation leverage via multi‑home strategies.
| Metric | 2024 Value |
|---|---|
| Prime members | ~200M |
| AWS share | ~32% |
| Ad run‑rate | $40B |
| Seller paid units | >50% |
Same Document Delivered
Amazon Porter's Five Forces Analysis
This preview shows the exact Amazon Porter’s Five Forces Analysis you’ll receive after purchase—no placeholders or samples. It is the full, professionally formatted file, ready for immediate download. Once you buy, you get this identical document instantly.
Original: $10.00
-65%$10.00
$3.50Description
Go Beyond the Preview—Access the Full Strategic Report
Amazon's dominance rests on scale, logistics superiority, and ecosystem lock-in, but faces pressure from regulatory scrutiny, rising supplier costs, and nimble niche competitors. Buyer power is moderated by convenience; threat of substitutes varies by segment. Ready to move beyond the basics? Get a full strategic breakdown of Amazon’s market position, competitive intensity, and external threats—all in one powerful analysis.
Suppliers Bargaining Power
Diverse, fragmented vendor base
Amazon sources from over 9 million sellers, manufacturers, and publishers worldwide as of 2024, diluting individual supplier leverage. Switching among comparable vendors is easy in many categories, and Amazon’s scale purchasing plus real-time sales and inventory data reduce dependency on any single supplier. Exceptions remain for niche, branded or limited-run inventory where alternatives are scarce.
Concentrated tech and chip dependencies
AWS and Amazon devices depend on a handful of leading semiconductor and networking suppliers, with TSMC holding roughly 53% of pure‑play foundry revenue in 2024, concentrating supplier power. Capacity cycles and leading‑edge node tightness have historically pushed wafer and lead‑time-driven costs up by double digits in peak years. Long‑term contracts and multi‑sourcing lower risk, but bargaining power still favors critical component makers. Amazon’s custom silicon (Graviton) reduces but does not remove supplier exposure.
Logistics and last-mile partners
Despite a vast in-house network, Amazon still relies on carriers, airlines and regional couriers; Amazon Air operated over 80 cargo aircraft by 2024 and the company continues large-scale contracts with third-party carriers.
Peak-season capacity tightness and fuel-price volatility periodically boost partner leverage, with parcel spot-rate swings in recent years showing double-digit percentage volatility.
Amazon’s broad contracting and vertical integration—warehouses, fleet and drone pilots—incrementally curb supplier power, though labor constraints at logistics partners can reintroduce pressure during peaks.
Content and media rights holders
- concentrated-licensors: global paid subs ~1.2B (2023)
- pricing-power: live sports rights ~ $1B/year (NFL TNF)
- mitigation: multi-year deals + expanding originals
- pressure: intense streamer bidding keeps fees high
Cloud software and infrastructure inputs
AWS depends on data‑center hardware, power and real estate; as of 2024 AWS operates 31 regions and 99 Availability Zones, and had 400+ renewable energy projects, making utilities and landlords strategically important. Long‑term PPAs and self‑built facilities lower energy and capacity risk but tie up capital; local permitting and grid constraints amplify supplier leverage.
- Data centers: 31 regions / 99 AZs (2024)
- Renewables: 400+ projects (2024)
- Impact: PPAs cut energy risk but raise capital needs
- Regulation: permitting timelines increase local supplier power
Supplier power mixed: weak retail (9M+ sellers) vs strong chip & logistics leverage
Supplier power is mixed: retail suppliers weak given 9+ million sellers (2024) and easy switching, while semiconductors (TSMC ~53% foundry share, 2024) and premium content licensors hold strong leverage. Logistics partners (Amazon Air ~80 aircraft, 2024) and data‑center utilities/permits (AWS 31 regions/99 AZs, 2024) create periodic pressure. Vertical integration and long‑term contracts mitigate but do not eliminate supplier risk.
| Metric | 2024 Value |
|---|---|
| Marketplace sellers | 9M+ |
| TSMC foundry share | ~53% |
| Amazon Air fleet | ~80 aircraft |
| AWS regions / AZs | 31 / 99 |
| Renewable projects (AWS) | 400+ |
What is included in the product
Detailed Word Document
Comprehensive Porter's Five Forces analysis of Amazon, uncovering competitive intensity, buyer and supplier power, threat of substitutes and new entrants, and regulatory or technological disruptors shaping margins and market share; strategic insights highlight Amazon's defensive moats and areas of vulnerability for investors and managers.
Customizable Excel Spreadsheet
A concise one-sheet Porter's Five Forces for Amazon that visualizes competitive pressure with a spider chart, lets you tweak force intensities to model scenarios, and exports cleanly into decks—no macros or complex setup.
Customers Bargaining Power
Highly price-sensitive shoppers
Consumers can compare prices instantly across marketplaces, and low switching costs raise buyer leverage, squeezing take rates and margins. Amazon offsets with Prime (over 200 million members reported by analysts in 2024), fast shipping and broad assortment to boost stickiness. Price-matching dynamics intensify during promotions — Adobe reported about $12.4B in US Prime Day sales in 2023 — amplifying short-term margin pressure.
Enterprise cloud customers negotiate
Large AWS customers secure volume discounts and custom contracts via Enterprise Discount Programs; AWS held about 32% of the cloud market in 2024 (Synergy Research Group). High multi-cloud adoption — ~92% of firms in the 2024 Flexera report — boosts customer leverage. Deep integrations and proprietary value-added services raise switching costs, while pay-as-you-go pricing tempers but does not eliminate negotiation power.
Third-party sellers as customers
Third-party sellers—who account for over half of paid units on Amazon—buy fulfillment, advertising, and services from Amazon, creating dependency on its traffic and logistics. Many multi-home across eBay, Walmart, and Shopify, and fee sensitivity (commissions plus FBA often in the ~15–30% range) can drive mix shifts or off-Amazon fulfillment. Transparency in policy and seller tooling materially shapes sellers’ perceived bargaining power.
Advertising buyers optimize ROI
Advertising buyers on Amazon reallocate budgets rapidly to highest-performing SKUs; auction dynamics compress publisher take-rates when ROI falls, while Amazon’s rich first-party retail data—supporting an annualized ad revenue run-rate of ~40 billion in 2024—increases advertiser reliance. Improving attribution tools can either strengthen buyer leverage or justify higher ad spend by proving incremental sales.
- rapid-shifts: budget reallocation in days
- auctions: lower take-rates as ROI weakens
- data-dependency: 2024 ad run-rate ~40B
- attribution: empowers buyers or validates spend
Churn risk despite ecosystem lock-in
Prime, devices, and subscriptions create strong ecosystem lock-in—Amazon estimated ~200 million Prime members worldwide in 2024—yet outages, price hikes or policy shifts have repeatedly triggered pockets of churn; customer reviews and ratings (over 100M product reviews) amplify collective bargaining by shaping purchase and exit decisions, so responsive CX and platform reliability are critical mitigants.
- Lock-in: Prime ~200M (2024 est)
- Risk drivers: outages, price hikes, policy changes
- Amplifiers: >100M reviews boosting collective power
- Mitigants: fast CX, high uptime, transparent policy
Ecosystem scale and subscriptions vs. margin pressure from price‑sensitive customers
Customers wield high price sensitivity and low switching costs across retail, ads and cloud, pressuring margins; Amazon counters with Prime (~200M members in 2024), fast shipping and ecosystem lock-in. AWS enterprise deals and integrations raise switching costs despite ~32% cloud share (2024). Sellers (>50% paid units) and advertisers (~$40B ad run‑rate 2024) retain negotiation leverage via multi‑home strategies.
| Metric | 2024 Value |
|---|---|
| Prime members | ~200M |
| AWS share | ~32% |
| Ad run‑rate | $40B |
| Seller paid units | >50% |
Same Document Delivered
Amazon Porter's Five Forces Analysis
This preview shows the exact Amazon Porter’s Five Forces Analysis you’ll receive after purchase—no placeholders or samples. It is the full, professionally formatted file, ready for immediate download. Once you buy, you get this identical document instantly.











