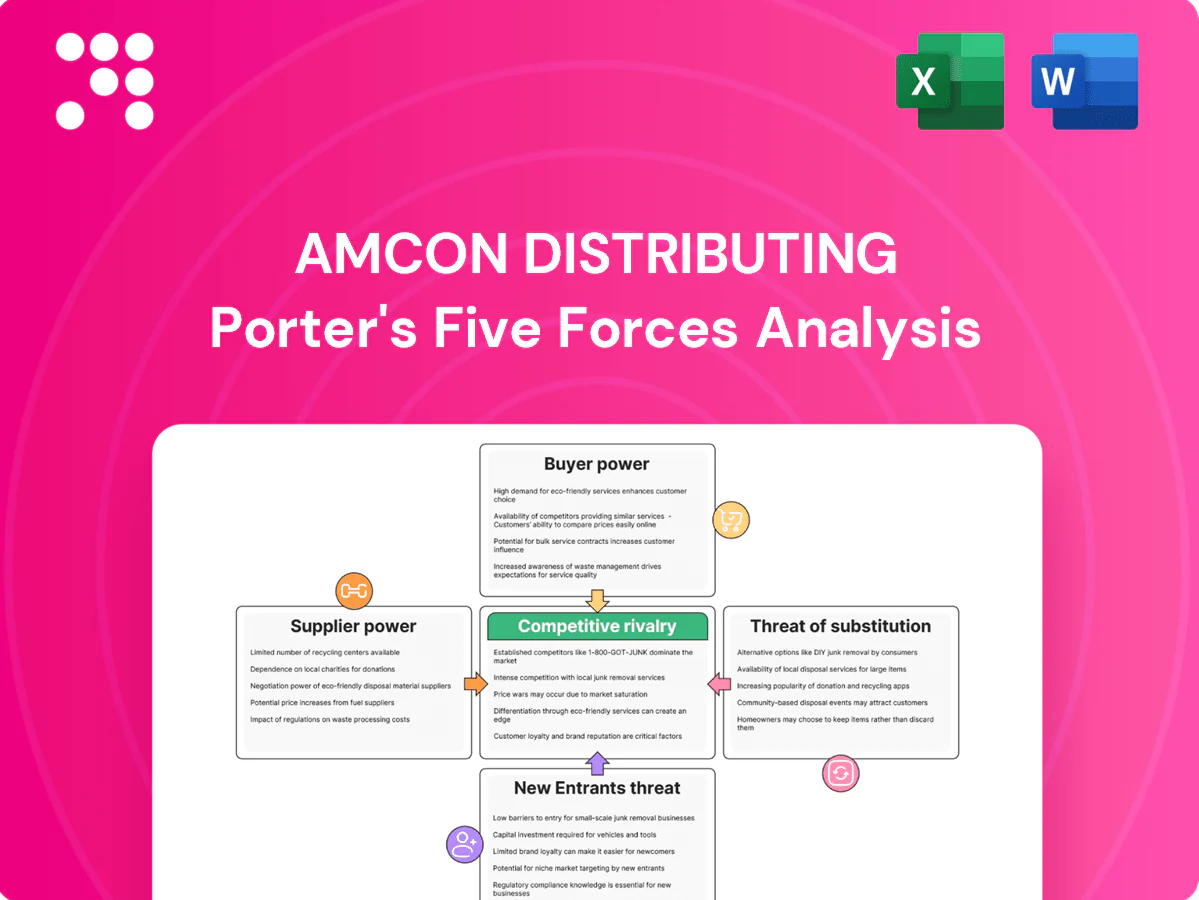
AMCON Distributing Porter's Five Forces Analysis

Elevate Your Analysis with the Complete Porter's Five Forces Analysis
AMCON Distributing faces moderate supplier leverage, fragmented buyers with price sensitivity, and steady threat from substitutes and new entrants driven by logistics innovation; rivalry among distributors remains intense. This brief snapshot only scratches the surface—unlock the full Porter's Five Forces Analysis for force-by-force ratings, visuals, and actionable strategy.
Suppliers Bargaining Power

Concentrated tobacco and beverage brands
Major tobacco and beverage manufacturers are few and control must-carry brands, elevating their leverage on pricing and terms. Coca-Cola and PepsiCo held about 68% of U.S. carbonated soft drink retail value share in 2024, and tobacco SKUs remain must-haves for retailers, limiting AMCON’s ability to delist or switch. This concentration compresses distributor margins—industry distributor EBITDA averaged ~5% in 2024—partially mitigated by AMCON’s multi-category mix and volume rebates.
Regulatory-driven compliance costs
Regulatory-driven compliance—tobacco excise, track-and-trace and age-verification—has tightened supply, with 65+ countries enforcing track-and-trace by 2024, boosting supplier bargaining power. Suppliers pass compliance costs downstream through higher fees or stricter terms, compressing distributor margins. AMCON must invest in certification and reporting systems to remain in programs, reducing negotiation latitude. Strong compliance proficiency can still win better allocations.

Rebate and incentive dependency
Program rebates, slotting fees and promotional funds shape category economics, with US CPG trade-promotion spend around $85 billion in 2024, directing merchandising priorities. Suppliers tie rebates to volume, mix and shelf programs, directly shaping AMCON’s assortment and merchandising choices. This rebate dependency raises switching costs as lost funds can exceed margin on a SKU. Strong POS data and execution can win higher rebate tiers and partially offset supplier leverage.

Private label and secondary brands
In groceries, candy and sundries, fragmented suppliers and private label reduce individual supplier power; private label held about 19% of US grocery dollar sales in 2024, enabling AMCON to switch sources to manage costs and availability. This supplier diversification balances pressure from concentrated categories, but private label programs require working capital and QA investments, which temper operational flexibility.
- private_label_share_2024: 19%
- fragmented_suppliers: lower_individual_power
- sourcing_flexibility: allows_cost_availability_management
- private_label_constraints: working_capital_and_QA
Logistics and capacity constraints
Supply chain tightness, highlighted by the American Trucking Associations 2023 estimate of an 80,000 driver shortfall, lets suppliers prioritize higher-margin channels and allocate capacity to large, predictable customers during peaks. AMCON’s route density and forecast accuracy help secure allocations, yet elevated spot freight and input volatility continue to erode margins. Multi-sourcing and inventory buffers remain essential countermeasures.
- Supply tightness: ATA 2023 — 80,000 driver shortfall
- Allocation favors large, consistent distributors
- Route density & planning = allocation edge for AMCON
- Spot costs still pressure margins
- Mitigants: multi-sourcing; safety stock
Beverage duopoly and tobacco pressures squeeze distributors; private label and route density help
Concentrated tobacco and beverage suppliers (Coke/Pepsi ~68% US CSD retail share in 2024) and heavy trade-promo spend tighten pricing and terms, compressing distributor EBITDA (~5% avg 2024). Regulatory compliance and supplier-funded programs shift costs downstream; private label (19% grocery dollar share 2024) and AMCON’s route density offer partial leverage.
| Metric | Value |
|---|---|
| CSD share (Coke+Pepsi) | 68% (2024) |
| Distributor EBITDA | ~5% (2024) |
| Trade-promo spend | $85B (2024) |
| Private label | 19% (2024) |
| Driver shortfall | 80,000 (ATA 2023) |
What is included in the product
 Detailed Word Document
Comprehensive Porter’s Five Forces analysis tailored to AMCON Distributing, revealing competitive intensity, supplier and buyer leverage, threat of substitutes, and barriers to entry with strategic implications.

 Customizable Excel Spreadsheet
Clear one-sheet Porter's Five Forces for AMCON Distributing—instantly visualize supplier, buyer, entrant, substitute and rivalry pressures with an editable spider chart to guide quick strategic moves. No macros, easy to customize and drop into decks or dashboards for immediate boardroom-ready insight.
Customers Bargaining Power

Fragmented convenience retail base
Many of the roughly 150,000 US convenience stores in 2024 are independent, diluting individual buyer power; AMCON counters this by offering frequent delivery, supplier credit and category-management services that shift decisions from price alone. Independents remain price-sensitive with typical net margins around 1–3%, so AMCONs service reliability often secures loyalty despite small price gaps.
Consolidating chains and buying groups
Large chains and co-ops negotiate national pricing, rebates and data-sharing, increasing leverage and pressuring distributors like AMCON; these customers influence purchasing across roughly 150,000 US convenience stores (NACS 2024). They can threaten to dual-source or switch to rivals such as McLane or Core-Mark, forcing AMCON to match SLAs and integrated EDI. Scale-based pricing and tailored programs help defend share by aligning margin and service.

Low switching costs among distributors
Low switching costs among distributors mean product overlap across wholesalers enables rapid switching on core SKUs, with buyers in 2024 routinely benchmarking weekly price lists and delivery fees. AMCON counters through bundled services, higher-frequency multi-drop options and actionable category insights. Stronger contractual terms and tailored credit support further raise customer stickiness.

Direct-to-store delivery alternatives
Manufacturers’ DSD (beverages, snacks) increasingly bypass wholesalers to anchor planograms, shrinking AMCON’s basket share and raising buyer leverage; industry reports in 2024 show DSD dominance in core beverage/snack shelving in many retail channels. Retailers leverage DSD for promos and equipment, squeezing distributor margins on remaining categories, while AMCON can plug DSD gaps with complementary SKUs and cross-category deals to preserve primary-vendor status.
- DSD anchor planograms — reduces basket share
- Retailer promo/equipment reliance — pricing pressure
- Cross-category bundling — retention strategy
Omnichannel expectations
Retailers demand online ordering, real-time inventory visibility and flexible delivery windows; 68% of B2B buyers preferred digital self-service in 2024, raising churn risk if AMCON fails to match convenience.
- Real-time SKU visibility reduces switching appeal
- eCommerce portals + IT lower perceived benefits of competitors
- Data-driven recommendations add value beyond price
Buyers wield power: 150,000 independents; 68% B2B digital
Customers hold moderate-to-high bargaining power: 150,000 US convenience stores in 2024 are largely independent, keeping buyer fragmentation but high price sensitivity (typical net margins 1–3%), while large chains/co‑ops and DSD programs exert strong leverage. Low switching costs and 68% B2B digital self‑service preference (2024) increase churn risk; AMCON offsets with service, credit and e‑tools.
| Metric | Value |
|---|---|
| US c‑stores (2024) | 150,000 |
| Independent net margins | 1–3% |
| B2B digital preference (2024) | 68% |
Preview the Actual Deliverable
AMCON Distributing Porter's Five Forces Analysis
This preview shows the exact Porter’s Five Forces analysis of AMCON Distributing you will receive immediately after purchase—no placeholders or samples. The file is professionally formatted, ready to download and use, and contains the full competitive-force evaluation and actionable insights.

Elevate Your Analysis with the Complete Porter's Five Forces Analysis
AMCON Distributing faces moderate supplier leverage, fragmented buyers with price sensitivity, and steady threat from substitutes and new entrants driven by logistics innovation; rivalry among distributors remains intense. This brief snapshot only scratches the surface—unlock the full Porter's Five Forces Analysis for force-by-force ratings, visuals, and actionable strategy.
Suppliers Bargaining Power
Concentrated tobacco and beverage brands
Major tobacco and beverage manufacturers are few and control must-carry brands, elevating their leverage on pricing and terms. Coca-Cola and PepsiCo held about 68% of U.S. carbonated soft drink retail value share in 2024, and tobacco SKUs remain must-haves for retailers, limiting AMCON’s ability to delist or switch. This concentration compresses distributor margins—industry distributor EBITDA averaged ~5% in 2024—partially mitigated by AMCON’s multi-category mix and volume rebates.
Regulatory-driven compliance costs
Regulatory-driven compliance—tobacco excise, track-and-trace and age-verification—has tightened supply, with 65+ countries enforcing track-and-trace by 2024, boosting supplier bargaining power. Suppliers pass compliance costs downstream through higher fees or stricter terms, compressing distributor margins. AMCON must invest in certification and reporting systems to remain in programs, reducing negotiation latitude. Strong compliance proficiency can still win better allocations.
Rebate and incentive dependency
Program rebates, slotting fees and promotional funds shape category economics, with US CPG trade-promotion spend around $85 billion in 2024, directing merchandising priorities. Suppliers tie rebates to volume, mix and shelf programs, directly shaping AMCON’s assortment and merchandising choices. This rebate dependency raises switching costs as lost funds can exceed margin on a SKU. Strong POS data and execution can win higher rebate tiers and partially offset supplier leverage.
Private label and secondary brands
In groceries, candy and sundries, fragmented suppliers and private label reduce individual supplier power; private label held about 19% of US grocery dollar sales in 2024, enabling AMCON to switch sources to manage costs and availability. This supplier diversification balances pressure from concentrated categories, but private label programs require working capital and QA investments, which temper operational flexibility.
- private_label_share_2024: 19%
- fragmented_suppliers: lower_individual_power
- sourcing_flexibility: allows_cost_availability_management
- private_label_constraints: working_capital_and_QA
Logistics and capacity constraints
Supply chain tightness, highlighted by the American Trucking Associations 2023 estimate of an 80,000 driver shortfall, lets suppliers prioritize higher-margin channels and allocate capacity to large, predictable customers during peaks. AMCON’s route density and forecast accuracy help secure allocations, yet elevated spot freight and input volatility continue to erode margins. Multi-sourcing and inventory buffers remain essential countermeasures.
- Supply tightness: ATA 2023 — 80,000 driver shortfall
- Allocation favors large, consistent distributors
- Route density & planning = allocation edge for AMCON
- Spot costs still pressure margins
- Mitigants: multi-sourcing; safety stock
Beverage duopoly and tobacco pressures squeeze distributors; private label and route density help
Concentrated tobacco and beverage suppliers (Coke/Pepsi ~68% US CSD retail share in 2024) and heavy trade-promo spend tighten pricing and terms, compressing distributor EBITDA (~5% avg 2024). Regulatory compliance and supplier-funded programs shift costs downstream; private label (19% grocery dollar share 2024) and AMCON’s route density offer partial leverage.
| Metric | Value |
|---|---|
| CSD share (Coke+Pepsi) | 68% (2024) |
| Distributor EBITDA | ~5% (2024) |
| Trade-promo spend | $85B (2024) |
| Private label | 19% (2024) |
| Driver shortfall | 80,000 (ATA 2023) |
What is included in the product
Detailed Word Document
Comprehensive Porter’s Five Forces analysis tailored to AMCON Distributing, revealing competitive intensity, supplier and buyer leverage, threat of substitutes, and barriers to entry with strategic implications.
Customizable Excel Spreadsheet
Clear one-sheet Porter's Five Forces for AMCON Distributing—instantly visualize supplier, buyer, entrant, substitute and rivalry pressures with an editable spider chart to guide quick strategic moves. No macros, easy to customize and drop into decks or dashboards for immediate boardroom-ready insight.
Customers Bargaining Power
Fragmented convenience retail base
Many of the roughly 150,000 US convenience stores in 2024 are independent, diluting individual buyer power; AMCON counters this by offering frequent delivery, supplier credit and category-management services that shift decisions from price alone. Independents remain price-sensitive with typical net margins around 1–3%, so AMCONs service reliability often secures loyalty despite small price gaps.
Consolidating chains and buying groups
Large chains and co-ops negotiate national pricing, rebates and data-sharing, increasing leverage and pressuring distributors like AMCON; these customers influence purchasing across roughly 150,000 US convenience stores (NACS 2024). They can threaten to dual-source or switch to rivals such as McLane or Core-Mark, forcing AMCON to match SLAs and integrated EDI. Scale-based pricing and tailored programs help defend share by aligning margin and service.
Low switching costs among distributors
Low switching costs among distributors mean product overlap across wholesalers enables rapid switching on core SKUs, with buyers in 2024 routinely benchmarking weekly price lists and delivery fees. AMCON counters through bundled services, higher-frequency multi-drop options and actionable category insights. Stronger contractual terms and tailored credit support further raise customer stickiness.
Direct-to-store delivery alternatives
Manufacturers’ DSD (beverages, snacks) increasingly bypass wholesalers to anchor planograms, shrinking AMCON’s basket share and raising buyer leverage; industry reports in 2024 show DSD dominance in core beverage/snack shelving in many retail channels. Retailers leverage DSD for promos and equipment, squeezing distributor margins on remaining categories, while AMCON can plug DSD gaps with complementary SKUs and cross-category deals to preserve primary-vendor status.
- DSD anchor planograms — reduces basket share
- Retailer promo/equipment reliance — pricing pressure
- Cross-category bundling — retention strategy
Omnichannel expectations
Retailers demand online ordering, real-time inventory visibility and flexible delivery windows; 68% of B2B buyers preferred digital self-service in 2024, raising churn risk if AMCON fails to match convenience.
- Real-time SKU visibility reduces switching appeal
- eCommerce portals + IT lower perceived benefits of competitors
- Data-driven recommendations add value beyond price
Buyers wield power: 150,000 independents; 68% B2B digital
Customers hold moderate-to-high bargaining power: 150,000 US convenience stores in 2024 are largely independent, keeping buyer fragmentation but high price sensitivity (typical net margins 1–3%), while large chains/co‑ops and DSD programs exert strong leverage. Low switching costs and 68% B2B digital self‑service preference (2024) increase churn risk; AMCON offsets with service, credit and e‑tools.
| Metric | Value |
|---|---|
| US c‑stores (2024) | 150,000 |
| Independent net margins | 1–3% |
| B2B digital preference (2024) | 68% |
Preview the Actual Deliverable
AMCON Distributing Porter's Five Forces Analysis
This preview shows the exact Porter’s Five Forces analysis of AMCON Distributing you will receive immediately after purchase—no placeholders or samples. The file is professionally formatted, ready to download and use, and contains the full competitive-force evaluation and actionable insights.
Description
Elevate Your Analysis with the Complete Porter's Five Forces Analysis
AMCON Distributing faces moderate supplier leverage, fragmented buyers with price sensitivity, and steady threat from substitutes and new entrants driven by logistics innovation; rivalry among distributors remains intense. This brief snapshot only scratches the surface—unlock the full Porter's Five Forces Analysis for force-by-force ratings, visuals, and actionable strategy.
Suppliers Bargaining Power
Concentrated tobacco and beverage brands
Major tobacco and beverage manufacturers are few and control must-carry brands, elevating their leverage on pricing and terms. Coca-Cola and PepsiCo held about 68% of U.S. carbonated soft drink retail value share in 2024, and tobacco SKUs remain must-haves for retailers, limiting AMCON’s ability to delist or switch. This concentration compresses distributor margins—industry distributor EBITDA averaged ~5% in 2024—partially mitigated by AMCON’s multi-category mix and volume rebates.
Regulatory-driven compliance costs
Regulatory-driven compliance—tobacco excise, track-and-trace and age-verification—has tightened supply, with 65+ countries enforcing track-and-trace by 2024, boosting supplier bargaining power. Suppliers pass compliance costs downstream through higher fees or stricter terms, compressing distributor margins. AMCON must invest in certification and reporting systems to remain in programs, reducing negotiation latitude. Strong compliance proficiency can still win better allocations.
Rebate and incentive dependency
Program rebates, slotting fees and promotional funds shape category economics, with US CPG trade-promotion spend around $85 billion in 2024, directing merchandising priorities. Suppliers tie rebates to volume, mix and shelf programs, directly shaping AMCON’s assortment and merchandising choices. This rebate dependency raises switching costs as lost funds can exceed margin on a SKU. Strong POS data and execution can win higher rebate tiers and partially offset supplier leverage.
Private label and secondary brands
In groceries, candy and sundries, fragmented suppliers and private label reduce individual supplier power; private label held about 19% of US grocery dollar sales in 2024, enabling AMCON to switch sources to manage costs and availability. This supplier diversification balances pressure from concentrated categories, but private label programs require working capital and QA investments, which temper operational flexibility.
- private_label_share_2024: 19%
- fragmented_suppliers: lower_individual_power
- sourcing_flexibility: allows_cost_availability_management
- private_label_constraints: working_capital_and_QA
Logistics and capacity constraints
Supply chain tightness, highlighted by the American Trucking Associations 2023 estimate of an 80,000 driver shortfall, lets suppliers prioritize higher-margin channels and allocate capacity to large, predictable customers during peaks. AMCON’s route density and forecast accuracy help secure allocations, yet elevated spot freight and input volatility continue to erode margins. Multi-sourcing and inventory buffers remain essential countermeasures.
- Supply tightness: ATA 2023 — 80,000 driver shortfall
- Allocation favors large, consistent distributors
- Route density & planning = allocation edge for AMCON
- Spot costs still pressure margins
- Mitigants: multi-sourcing; safety stock
Beverage duopoly and tobacco pressures squeeze distributors; private label and route density help
Concentrated tobacco and beverage suppliers (Coke/Pepsi ~68% US CSD retail share in 2024) and heavy trade-promo spend tighten pricing and terms, compressing distributor EBITDA (~5% avg 2024). Regulatory compliance and supplier-funded programs shift costs downstream; private label (19% grocery dollar share 2024) and AMCON’s route density offer partial leverage.
| Metric | Value |
|---|---|
| CSD share (Coke+Pepsi) | 68% (2024) |
| Distributor EBITDA | ~5% (2024) |
| Trade-promo spend | $85B (2024) |
| Private label | 19% (2024) |
| Driver shortfall | 80,000 (ATA 2023) |
What is included in the product
Detailed Word Document
Comprehensive Porter’s Five Forces analysis tailored to AMCON Distributing, revealing competitive intensity, supplier and buyer leverage, threat of substitutes, and barriers to entry with strategic implications.
Customizable Excel Spreadsheet
Clear one-sheet Porter's Five Forces for AMCON Distributing—instantly visualize supplier, buyer, entrant, substitute and rivalry pressures with an editable spider chart to guide quick strategic moves. No macros, easy to customize and drop into decks or dashboards for immediate boardroom-ready insight.
Customers Bargaining Power
Fragmented convenience retail base
Many of the roughly 150,000 US convenience stores in 2024 are independent, diluting individual buyer power; AMCON counters this by offering frequent delivery, supplier credit and category-management services that shift decisions from price alone. Independents remain price-sensitive with typical net margins around 1–3%, so AMCONs service reliability often secures loyalty despite small price gaps.
Consolidating chains and buying groups
Large chains and co-ops negotiate national pricing, rebates and data-sharing, increasing leverage and pressuring distributors like AMCON; these customers influence purchasing across roughly 150,000 US convenience stores (NACS 2024). They can threaten to dual-source or switch to rivals such as McLane or Core-Mark, forcing AMCON to match SLAs and integrated EDI. Scale-based pricing and tailored programs help defend share by aligning margin and service.
Low switching costs among distributors
Low switching costs among distributors mean product overlap across wholesalers enables rapid switching on core SKUs, with buyers in 2024 routinely benchmarking weekly price lists and delivery fees. AMCON counters through bundled services, higher-frequency multi-drop options and actionable category insights. Stronger contractual terms and tailored credit support further raise customer stickiness.
Direct-to-store delivery alternatives
Manufacturers’ DSD (beverages, snacks) increasingly bypass wholesalers to anchor planograms, shrinking AMCON’s basket share and raising buyer leverage; industry reports in 2024 show DSD dominance in core beverage/snack shelving in many retail channels. Retailers leverage DSD for promos and equipment, squeezing distributor margins on remaining categories, while AMCON can plug DSD gaps with complementary SKUs and cross-category deals to preserve primary-vendor status.
- DSD anchor planograms — reduces basket share
- Retailer promo/equipment reliance — pricing pressure
- Cross-category bundling — retention strategy
Omnichannel expectations
Retailers demand online ordering, real-time inventory visibility and flexible delivery windows; 68% of B2B buyers preferred digital self-service in 2024, raising churn risk if AMCON fails to match convenience.
- Real-time SKU visibility reduces switching appeal
- eCommerce portals + IT lower perceived benefits of competitors
- Data-driven recommendations add value beyond price
Buyers wield power: 150,000 independents; 68% B2B digital
Customers hold moderate-to-high bargaining power: 150,000 US convenience stores in 2024 are largely independent, keeping buyer fragmentation but high price sensitivity (typical net margins 1–3%), while large chains/co‑ops and DSD programs exert strong leverage. Low switching costs and 68% B2B digital self‑service preference (2024) increase churn risk; AMCON offsets with service, credit and e‑tools.
| Metric | Value |
|---|---|
| US c‑stores (2024) | 150,000 |
| Independent net margins | 1–3% |
| B2B digital preference (2024) | 68% |
Preview the Actual Deliverable
AMCON Distributing Porter's Five Forces Analysis
This preview shows the exact Porter’s Five Forces analysis of AMCON Distributing you will receive immediately after purchase—no placeholders or samples. The file is professionally formatted, ready to download and use, and contains the full competitive-force evaluation and actionable insights.











