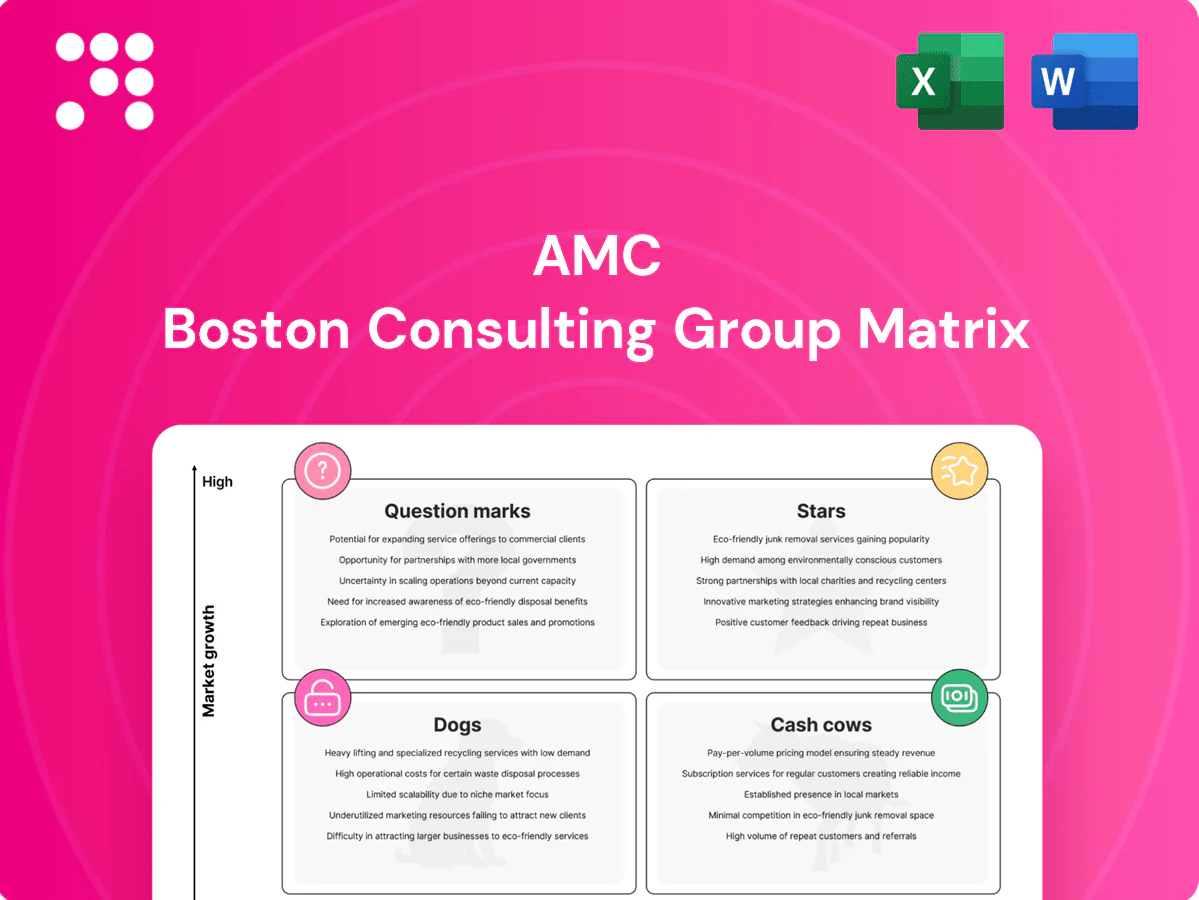
AMC Boston Consulting Group Matrix

See the Bigger Picture
Curious where this company’s products sit—Stars, Cash Cows, Dogs, or Question Marks? This preview scratches the surface; buy the full BCG Matrix for quadrant-by-quadrant placement, data-backed recommendations, and tactical moves you can implement now. You’ll get a polished Word report plus an Excel summary for quick presentations and decision-making. Skip the guesswork—purchase the full matrix and turn messy signals into clear investment priorities.
Stars

Premium formats (IMAX, Dolby, PLF)
Premium formats (IMAX, Dolby, PLF) sit in Stars due to high-growth demand and AMC’s clear market lead in 2024, with the premium experience consistently outperforming standard offerings. AMC’s partnerships and owned PLF screens command materially higher ticket prices and drive repeat visits, supporting box-office resilience even as overall attendance normalizes. These venues require elevated capex, but cash churn is offset by sustained traffic and pricing power, so continued investment is needed to lock in share.
AMC Stubs & A‑List subscriptions
AMC Stubs & A‑List operate as a membership flywheel—collecting customer data, driving higher visit frequency and producing predictable subscription cash; as of 2024 AMC reports over 1 million A‑List subscribers. It’s a leader product aiding moviegoing recovery but requires meaningful promo and perks spend to scale; churn management is the primary cash out. Net effect: share gain, and as growth cools it can graduate into a Cash Cow.

Event cinema & concert films
Event cinema and concert films are Stars for AMC: blockbuster-adjacent surges (concerts, anime events, one-night specials) are driving outsized box office — Taylor Swift: The Eras Tour grossed about 261 million USD in the U.S., illustrating potential upside. AMC’s ~4,800-screen footprint and national marketing muscle give clear distribution leverage to capture these windows. High variability exists, but wins produce multipliers on per-screen revenue; maintain investment as the category expands.

Dine‑in and premium F&B
Dine-in and premium F&B lift check averages by roughly 20–30% versus grab-and-go, but require higher labor and kitchen CAPEX, pushing ramp-period cash burn as labor-to-sales can spike 8–15% initially (2024 trade benchmarks). In scaled markets the margin mix can contribute 15–25% incremental EBITDA, creating a defensible revenue moat; prioritize high-fit sites and menu optimization to accelerate payback.
- Check uplift: ~20–30% (2024)
- Ramp labor pressure: +8–15% labor-to-sales
- Scaled incremental EBITDA: ~15–25%
- Action: open high-fit locations; optimize menus
Flagship multiplexes in major metros
Flagship multiplexes in major metros are Stars in AMC’s BCG matrix: Tier‑A sites capture the tentpole crowd and drive disproportionate revenue, often delivering roughly half of chain box‑office on peak releases. They need constant capital refresh — premium seats, PLF audio, lobby tech and F&B upgrades — which raise per‑capita spend and occupancy.
- Market share: Tier‑A ≈ 40–60% of peak box office
- Upgrade ROI: PLF/F&B lift per‑capita spend ~20–30%
- Strategy: protect, upgrade, and upsell
PLF, A-List subs & dine-in lift per-capita 20-30%; event peaks hit $261M
Stars: premium formats (IMAX/PLF) and Tier‑A multiplexes drive high-growth revenue with PLF/ F&B lifting per‑capita spend ~20–30% in 2024; A‑List/ Stubs exceed 1.0M subs fueling repeat visits; event cinema (e.g., Taylor Swift: The Eras Tour ~$261M US) shows outsized box office spikes; dine‑in boosts checks ~20–30% but raises labor by ~8–15% during ramp.
| Metric | 2024 |
|---|---|
| A‑List subs | ~1.0M+ |
| PLF/F&B lift | 20–30% |
| Event peak | $261M (Swift) |
| Labor ramp | +8–15% |
What is included in the product
 Detailed Word Document
AMC BCG Matrix overview: evaluates each unit as Star, Cash Cow, Question Mark or Dog and recommends invest, hold or divest.

 Customizable Excel Spreadsheet
One-page AMC BCG Matrix mapping units into quadrants to spot stars and drains fast
Cash Cows

Core weekend blockbuster runs
Core weekend blockbuster runs sit in a mature category, yet AMC captures outsized attendance when the slate lands, backed by over 1,000 theatres and roughly 11,000 screens in 2024. The playbook—scheduling, staffing, throughput—is standardized across locations, keeping incremental promo low and margins steady. Milk these runs, keep operations tight, and let Star titles fund the periodic revenue spikes.
Classic concessions (popcorn, soda, candy)
Classic concessions (popcorn, soda, candy) remain AMC’s margin engine, with industry gross margins typically in the 70–90% range in 2024; demand is stable and upsell is trained behavior. Supply chains are predictable, yielding minimal growth but maximum cash generation. Proceeds are routinely deployed to fund auditorium upgrades, premium seating installations, and debt service.

On‑screen ads and preshow media
As of 2024 advertisers seek captive audiences and AMC’s on‑screen ads and preshow media deliver that reach in a controlled environment. With infrastructure already in place, adding spots carries largely incremental margin, supporting steady free cash flow despite tepid demand growth. Inventory quality and disciplined rate cards are critical to sustain yields and advertiser ROI.

Private auditorium rentals
Private auditorium rentals remain a cash cow post‑pandemic, with many markets keeping steady demand for small-group screenings and events; chains report these fills often during off‑peak hours and require minimal marketing. Not hyper‑growth, but in 2024 rentals commonly contribute ~5–7% of ancillary revenue and lift idle‑hour yield when automated. Packaging and booking automation can boost realized yield and utilization.
- Low marketing needs
- Easy to schedule off‑peak
- Steady cash generator (2024: ~5–7% ancillary)
- Package + automate to raise yield
Established European circuits
Established European circuits (Odeon & UCI under AMC) show stable attendance patterns in 2024 versus 2023, with AMC maintaining meaningful market share; cash flows are steady and less volatile, driving predictable EBITDA contribution. Capital requirements are modest outside periodic refresh cycles, so disciplined cost control and harvest strategy are appropriate.
- Stable 2024 admissions vs 2023
- Meaningful market share (Odeon & UCI)
- Predictable cash generation
- Low capex outside refreshes
- Harvest and maintain discipline
Blockbusters + concessions drive steady FCF; 70-90% concession margins
Core weekend blockbusters and concessions are AMC’s cash cows in 2024, leveraging ~1,000 theatres and ~11,000 screens and concession margins of 70–90% to produce steady free cash flow. On‑screen ads and private rentals (≈5–7% of ancillary revenue) add incremental margin with low capex. European circuits (Odeon & UCI) deliver stable admissions vs 2023, supporting predictable EBITDA.
| Metric | 2024 |
|---|---|
| Theatres / Screens | ~1,000 / ~11,000 |
| Concession margins | 70–90% |
| Rentals (ancillary) | ≈5–7% |
| Europe admissions | Stable vs 2023 |
What You See Is What You Get
AMC BCG Matrix
The AMC BCG Matrix you’re previewing on this page is the exact file you’ll receive after purchase. No watermarks, no demo notes—just a polished, fully formatted strategic matrix ready for immediate use. It’s editable, print-ready and built for clear decision-making, so you can plug it straight into presentations or planning sessions. Buy once and download the final document—no surprises, no extra edits needed.

See the Bigger Picture
Curious where this company’s products sit—Stars, Cash Cows, Dogs, or Question Marks? This preview scratches the surface; buy the full BCG Matrix for quadrant-by-quadrant placement, data-backed recommendations, and tactical moves you can implement now. You’ll get a polished Word report plus an Excel summary for quick presentations and decision-making. Skip the guesswork—purchase the full matrix and turn messy signals into clear investment priorities.
Stars
Premium formats (IMAX, Dolby, PLF)
Premium formats (IMAX, Dolby, PLF) sit in Stars due to high-growth demand and AMC’s clear market lead in 2024, with the premium experience consistently outperforming standard offerings. AMC’s partnerships and owned PLF screens command materially higher ticket prices and drive repeat visits, supporting box-office resilience even as overall attendance normalizes. These venues require elevated capex, but cash churn is offset by sustained traffic and pricing power, so continued investment is needed to lock in share.
AMC Stubs & A‑List subscriptions
AMC Stubs & A‑List operate as a membership flywheel—collecting customer data, driving higher visit frequency and producing predictable subscription cash; as of 2024 AMC reports over 1 million A‑List subscribers. It’s a leader product aiding moviegoing recovery but requires meaningful promo and perks spend to scale; churn management is the primary cash out. Net effect: share gain, and as growth cools it can graduate into a Cash Cow.
Event cinema & concert films
Event cinema and concert films are Stars for AMC: blockbuster-adjacent surges (concerts, anime events, one-night specials) are driving outsized box office — Taylor Swift: The Eras Tour grossed about 261 million USD in the U.S., illustrating potential upside. AMC’s ~4,800-screen footprint and national marketing muscle give clear distribution leverage to capture these windows. High variability exists, but wins produce multipliers on per-screen revenue; maintain investment as the category expands.
Dine‑in and premium F&B
Dine-in and premium F&B lift check averages by roughly 20–30% versus grab-and-go, but require higher labor and kitchen CAPEX, pushing ramp-period cash burn as labor-to-sales can spike 8–15% initially (2024 trade benchmarks). In scaled markets the margin mix can contribute 15–25% incremental EBITDA, creating a defensible revenue moat; prioritize high-fit sites and menu optimization to accelerate payback.
- Check uplift: ~20–30% (2024)
- Ramp labor pressure: +8–15% labor-to-sales
- Scaled incremental EBITDA: ~15–25%
- Action: open high-fit locations; optimize menus
Flagship multiplexes in major metros
Flagship multiplexes in major metros are Stars in AMC’s BCG matrix: Tier‑A sites capture the tentpole crowd and drive disproportionate revenue, often delivering roughly half of chain box‑office on peak releases. They need constant capital refresh — premium seats, PLF audio, lobby tech and F&B upgrades — which raise per‑capita spend and occupancy.
- Market share: Tier‑A ≈ 40–60% of peak box office
- Upgrade ROI: PLF/F&B lift per‑capita spend ~20–30%
- Strategy: protect, upgrade, and upsell
PLF, A-List subs & dine-in lift per-capita 20-30%; event peaks hit $261M
Stars: premium formats (IMAX/PLF) and Tier‑A multiplexes drive high-growth revenue with PLF/ F&B lifting per‑capita spend ~20–30% in 2024; A‑List/ Stubs exceed 1.0M subs fueling repeat visits; event cinema (e.g., Taylor Swift: The Eras Tour ~$261M US) shows outsized box office spikes; dine‑in boosts checks ~20–30% but raises labor by ~8–15% during ramp.
| Metric | 2024 |
|---|---|
| A‑List subs | ~1.0M+ |
| PLF/F&B lift | 20–30% |
| Event peak | $261M (Swift) |
| Labor ramp | +8–15% |
What is included in the product
Detailed Word Document
AMC BCG Matrix overview: evaluates each unit as Star, Cash Cow, Question Mark or Dog and recommends invest, hold or divest.
Customizable Excel Spreadsheet
One-page AMC BCG Matrix mapping units into quadrants to spot stars and drains fast
Cash Cows
Core weekend blockbuster runs
Core weekend blockbuster runs sit in a mature category, yet AMC captures outsized attendance when the slate lands, backed by over 1,000 theatres and roughly 11,000 screens in 2024. The playbook—scheduling, staffing, throughput—is standardized across locations, keeping incremental promo low and margins steady. Milk these runs, keep operations tight, and let Star titles fund the periodic revenue spikes.
Classic concessions (popcorn, soda, candy)
Classic concessions (popcorn, soda, candy) remain AMC’s margin engine, with industry gross margins typically in the 70–90% range in 2024; demand is stable and upsell is trained behavior. Supply chains are predictable, yielding minimal growth but maximum cash generation. Proceeds are routinely deployed to fund auditorium upgrades, premium seating installations, and debt service.
On‑screen ads and preshow media
As of 2024 advertisers seek captive audiences and AMC’s on‑screen ads and preshow media deliver that reach in a controlled environment. With infrastructure already in place, adding spots carries largely incremental margin, supporting steady free cash flow despite tepid demand growth. Inventory quality and disciplined rate cards are critical to sustain yields and advertiser ROI.
Private auditorium rentals
Private auditorium rentals remain a cash cow post‑pandemic, with many markets keeping steady demand for small-group screenings and events; chains report these fills often during off‑peak hours and require minimal marketing. Not hyper‑growth, but in 2024 rentals commonly contribute ~5–7% of ancillary revenue and lift idle‑hour yield when automated. Packaging and booking automation can boost realized yield and utilization.
- Low marketing needs
- Easy to schedule off‑peak
- Steady cash generator (2024: ~5–7% ancillary)
- Package + automate to raise yield
Established European circuits
Established European circuits (Odeon & UCI under AMC) show stable attendance patterns in 2024 versus 2023, with AMC maintaining meaningful market share; cash flows are steady and less volatile, driving predictable EBITDA contribution. Capital requirements are modest outside periodic refresh cycles, so disciplined cost control and harvest strategy are appropriate.
- Stable 2024 admissions vs 2023
- Meaningful market share (Odeon & UCI)
- Predictable cash generation
- Low capex outside refreshes
- Harvest and maintain discipline
Blockbusters + concessions drive steady FCF; 70-90% concession margins
Core weekend blockbusters and concessions are AMC’s cash cows in 2024, leveraging ~1,000 theatres and ~11,000 screens and concession margins of 70–90% to produce steady free cash flow. On‑screen ads and private rentals (≈5–7% of ancillary revenue) add incremental margin with low capex. European circuits (Odeon & UCI) deliver stable admissions vs 2023, supporting predictable EBITDA.
| Metric | 2024 |
|---|---|
| Theatres / Screens | ~1,000 / ~11,000 |
| Concession margins | 70–90% |
| Rentals (ancillary) | ≈5–7% |
| Europe admissions | Stable vs 2023 |
What You See Is What You Get
AMC BCG Matrix
The AMC BCG Matrix you’re previewing on this page is the exact file you’ll receive after purchase. No watermarks, no demo notes—just a polished, fully formatted strategic matrix ready for immediate use. It’s editable, print-ready and built for clear decision-making, so you can plug it straight into presentations or planning sessions. Buy once and download the final document—no surprises, no extra edits needed.
Original: $10.00
-65%$10.00
$3.50Description
See the Bigger Picture
Curious where this company’s products sit—Stars, Cash Cows, Dogs, or Question Marks? This preview scratches the surface; buy the full BCG Matrix for quadrant-by-quadrant placement, data-backed recommendations, and tactical moves you can implement now. You’ll get a polished Word report plus an Excel summary for quick presentations and decision-making. Skip the guesswork—purchase the full matrix and turn messy signals into clear investment priorities.
Stars
Premium formats (IMAX, Dolby, PLF)
Premium formats (IMAX, Dolby, PLF) sit in Stars due to high-growth demand and AMC’s clear market lead in 2024, with the premium experience consistently outperforming standard offerings. AMC’s partnerships and owned PLF screens command materially higher ticket prices and drive repeat visits, supporting box-office resilience even as overall attendance normalizes. These venues require elevated capex, but cash churn is offset by sustained traffic and pricing power, so continued investment is needed to lock in share.
AMC Stubs & A‑List subscriptions
AMC Stubs & A‑List operate as a membership flywheel—collecting customer data, driving higher visit frequency and producing predictable subscription cash; as of 2024 AMC reports over 1 million A‑List subscribers. It’s a leader product aiding moviegoing recovery but requires meaningful promo and perks spend to scale; churn management is the primary cash out. Net effect: share gain, and as growth cools it can graduate into a Cash Cow.
Event cinema & concert films
Event cinema and concert films are Stars for AMC: blockbuster-adjacent surges (concerts, anime events, one-night specials) are driving outsized box office — Taylor Swift: The Eras Tour grossed about 261 million USD in the U.S., illustrating potential upside. AMC’s ~4,800-screen footprint and national marketing muscle give clear distribution leverage to capture these windows. High variability exists, but wins produce multipliers on per-screen revenue; maintain investment as the category expands.
Dine‑in and premium F&B
Dine-in and premium F&B lift check averages by roughly 20–30% versus grab-and-go, but require higher labor and kitchen CAPEX, pushing ramp-period cash burn as labor-to-sales can spike 8–15% initially (2024 trade benchmarks). In scaled markets the margin mix can contribute 15–25% incremental EBITDA, creating a defensible revenue moat; prioritize high-fit sites and menu optimization to accelerate payback.
- Check uplift: ~20–30% (2024)
- Ramp labor pressure: +8–15% labor-to-sales
- Scaled incremental EBITDA: ~15–25%
- Action: open high-fit locations; optimize menus
Flagship multiplexes in major metros
Flagship multiplexes in major metros are Stars in AMC’s BCG matrix: Tier‑A sites capture the tentpole crowd and drive disproportionate revenue, often delivering roughly half of chain box‑office on peak releases. They need constant capital refresh — premium seats, PLF audio, lobby tech and F&B upgrades — which raise per‑capita spend and occupancy.
- Market share: Tier‑A ≈ 40–60% of peak box office
- Upgrade ROI: PLF/F&B lift per‑capita spend ~20–30%
- Strategy: protect, upgrade, and upsell
PLF, A-List subs & dine-in lift per-capita 20-30%; event peaks hit $261M
Stars: premium formats (IMAX/PLF) and Tier‑A multiplexes drive high-growth revenue with PLF/ F&B lifting per‑capita spend ~20–30% in 2024; A‑List/ Stubs exceed 1.0M subs fueling repeat visits; event cinema (e.g., Taylor Swift: The Eras Tour ~$261M US) shows outsized box office spikes; dine‑in boosts checks ~20–30% but raises labor by ~8–15% during ramp.
| Metric | 2024 |
|---|---|
| A‑List subs | ~1.0M+ |
| PLF/F&B lift | 20–30% |
| Event peak | $261M (Swift) |
| Labor ramp | +8–15% |
What is included in the product
Detailed Word Document
AMC BCG Matrix overview: evaluates each unit as Star, Cash Cow, Question Mark or Dog and recommends invest, hold or divest.
Customizable Excel Spreadsheet
One-page AMC BCG Matrix mapping units into quadrants to spot stars and drains fast
Cash Cows
Core weekend blockbuster runs
Core weekend blockbuster runs sit in a mature category, yet AMC captures outsized attendance when the slate lands, backed by over 1,000 theatres and roughly 11,000 screens in 2024. The playbook—scheduling, staffing, throughput—is standardized across locations, keeping incremental promo low and margins steady. Milk these runs, keep operations tight, and let Star titles fund the periodic revenue spikes.
Classic concessions (popcorn, soda, candy)
Classic concessions (popcorn, soda, candy) remain AMC’s margin engine, with industry gross margins typically in the 70–90% range in 2024; demand is stable and upsell is trained behavior. Supply chains are predictable, yielding minimal growth but maximum cash generation. Proceeds are routinely deployed to fund auditorium upgrades, premium seating installations, and debt service.
On‑screen ads and preshow media
As of 2024 advertisers seek captive audiences and AMC’s on‑screen ads and preshow media deliver that reach in a controlled environment. With infrastructure already in place, adding spots carries largely incremental margin, supporting steady free cash flow despite tepid demand growth. Inventory quality and disciplined rate cards are critical to sustain yields and advertiser ROI.
Private auditorium rentals
Private auditorium rentals remain a cash cow post‑pandemic, with many markets keeping steady demand for small-group screenings and events; chains report these fills often during off‑peak hours and require minimal marketing. Not hyper‑growth, but in 2024 rentals commonly contribute ~5–7% of ancillary revenue and lift idle‑hour yield when automated. Packaging and booking automation can boost realized yield and utilization.
- Low marketing needs
- Easy to schedule off‑peak
- Steady cash generator (2024: ~5–7% ancillary)
- Package + automate to raise yield
Established European circuits
Established European circuits (Odeon & UCI under AMC) show stable attendance patterns in 2024 versus 2023, with AMC maintaining meaningful market share; cash flows are steady and less volatile, driving predictable EBITDA contribution. Capital requirements are modest outside periodic refresh cycles, so disciplined cost control and harvest strategy are appropriate.
- Stable 2024 admissions vs 2023
- Meaningful market share (Odeon & UCI)
- Predictable cash generation
- Low capex outside refreshes
- Harvest and maintain discipline
Blockbusters + concessions drive steady FCF; 70-90% concession margins
Core weekend blockbusters and concessions are AMC’s cash cows in 2024, leveraging ~1,000 theatres and ~11,000 screens and concession margins of 70–90% to produce steady free cash flow. On‑screen ads and private rentals (≈5–7% of ancillary revenue) add incremental margin with low capex. European circuits (Odeon & UCI) deliver stable admissions vs 2023, supporting predictable EBITDA.
| Metric | 2024 |
|---|---|
| Theatres / Screens | ~1,000 / ~11,000 |
| Concession margins | 70–90% |
| Rentals (ancillary) | ≈5–7% |
| Europe admissions | Stable vs 2023 |
What You See Is What You Get
AMC BCG Matrix
The AMC BCG Matrix you’re previewing on this page is the exact file you’ll receive after purchase. No watermarks, no demo notes—just a polished, fully formatted strategic matrix ready for immediate use. It’s editable, print-ready and built for clear decision-making, so you can plug it straight into presentations or planning sessions. Buy once and download the final document—no surprises, no extra edits needed.











