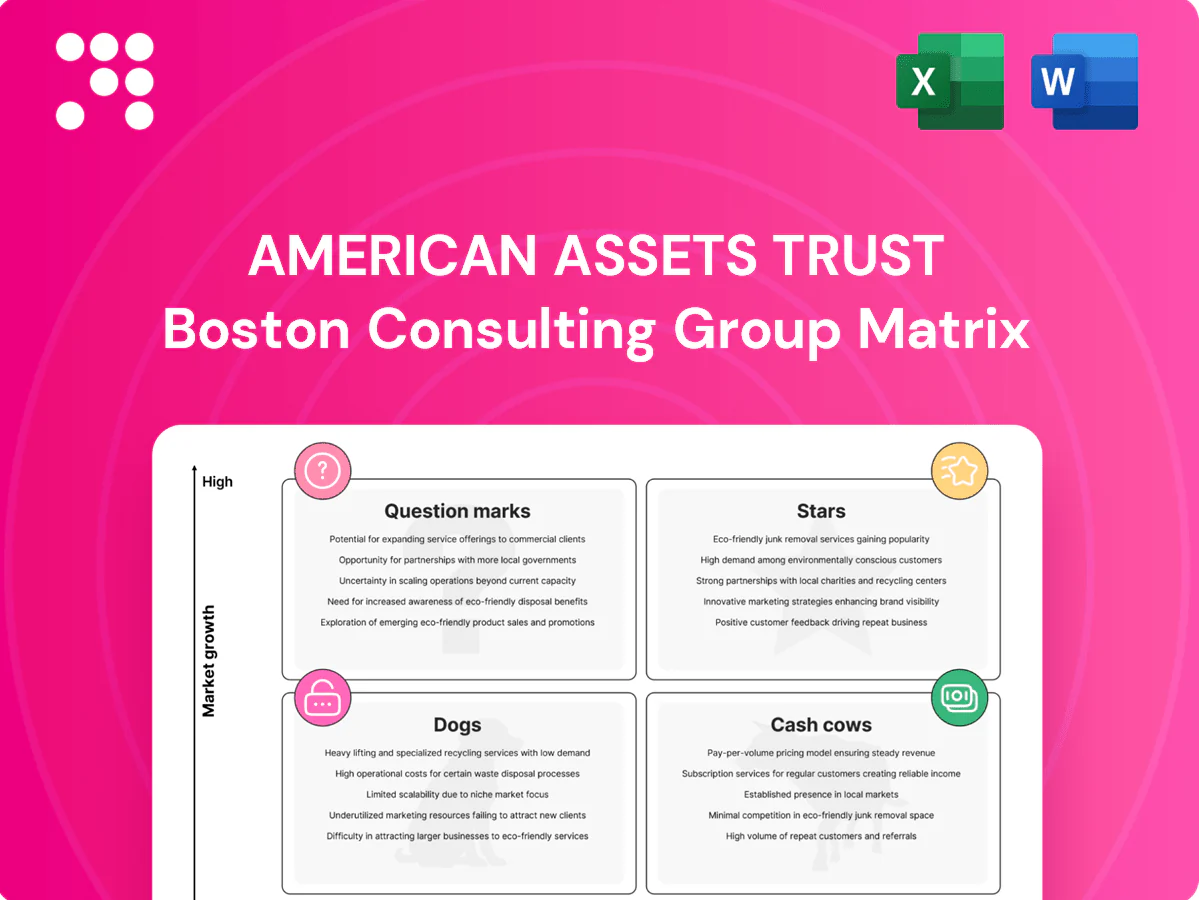
American Assets Trust Boston Consulting Group Matrix

Download Your Competitive Advantage
American Assets Trust’s BCG Matrix preview shows where key assets sit—market leaders, cash generators, or potential drainers—and why those placements matter for short- and long-term capital moves. Want the full picture? Purchase the complete BCG Matrix for quadrant-by-quadrant analysis, data-driven recommendations, and ready-to-use Word and Excel files that let you act fast. Skip the guesswork—get the strategic roadmap that makes allocation decisions obvious and defensible.
Stars

Coastal Class‑A Multifamily (San Diego & Hawaii)
Coastal Class-A multifamily in San Diego and Hawaii posts high occupancy in the mid-90s, limited new supply in supply-constrained submarkets, and steady in-migration, giving AAT clear pricing power. AAT’s concentrated footprint delivers outsized share where it matters, letting rents rise faster than broader market averages (often by 200–300 bps). Even with conservative turns, targeted livability capex sustains rent growth and defends the lead.
Prime Grocery‑Anchored Retail (High‑barrier submarkets)
Daily‑needs centers in dense, affluent trade areas sustain high traffic and tenant sales, with grocery e‑commerce penetration near 9% in 2024 (Brick Meets Click), keeping in‑store volumes stable. Occupancy for grocery‑anchored centers ran about 95–97% in 2024 (CBRE/CoStar), driving positive renewal spreads and minimal downtime. As e‑comm resistant retail, this is a defensible growth pocket—double down on merchandising and parking/curbside ops to retain No.1 market share momentum.

Destination Urban Mixed‑Use (Live‑work‑shop nodes)
Destination Urban Mixed‑Use (Live‑work‑shop nodes) bundles residential above curated retail to capture multiple wallets per visit, with leasing synergy driving both occupancy and rent growth; American Assets Trust saw portfolio occupancy above 90% in 2024 and same‑store NOI growth in the mid single digits. In tight coastal markets these nodes outpace the comp set on rent and traffic; invest in experience upgrades to convert 2024 growth into durable dominance.

Hawaii High‑Street/Tourism‑Driven Retail
When travel rebounds, tenant sales in Hawaii high‑street/tourism retail surged, with visitor arrivals reaching about 9.6 million in 2024 per Hawaii Tourism Authority, lifting percentage rents and spreads across flagship locations.
Extreme barriers to entry—limited frontage and zoning—concentrate share among incumbents; brand demand for flagship frontage remains strong even in choppy cycles.
Active placemaking and tourism recovery keep these assets in the BCG Stars/growth bucket with sustained high occupancy and rent premiums.
- Visitor arrivals 2024: ~9.6M
- High occupancy; premium rents for frontage
- Strong percentage‑rent upside when travel rebounds
- High entry barriers concentrate incumbent share
Redeveloped Lifestyle Centers with Leasing Tailwinds
Recent re-merchandising and amenity upgrades have flipped several American Assets Trust lifestyle centers into high-growth Stars, with early 2024 lease-up momentum averaging about 70% within 12 months and occupancy lifting toward best‑in‑class levels. As foot traffic recovers, top operators capture the lion’s share of expanding experiential concepts, driving same‑asset NOI and rent growth. Continued investment in tenant mix and digital engagement will compound gains.
- Tag: lease-up 70% (12 months)
- Tag: occupancy rising
- Tag: NOI/rent growth
- Tag: tenant mix & digital
Coastal Class-A: mid-90s occ, 9.6M visitors, grocery 95–97%
Coastal Class-A multifamily and high-street retail show mid-90s occupancy and 200–300 bps rent outperformance; Hawaii visitor arrivals ~9.6M (2024) boost percentage rents; grocery-anchored centers 95–97% occ (2024) with mid-single-digit same-store NOI growth; recent lifestyle lease-ups hit ~70% within 12 months, sustaining Star status.
| Metric | 2024 |
|---|---|
| Occupancy | mid-90s% |
| Visitor arrivals | 9.6M |
| Grocery occ | 95–97% |
| Lease-up | ~70% (12mo) |
| NOI growth | mid-single-digit% |
What is included in the product
 Detailed Word Document
BCG Matrix for American Assets Trust: assesses Stars, Cash Cows, Question Marks and Dogs with clear invest, hold or divest guidance.

 Customizable Excel Spreadsheet
One-page American Assets Trust BCG Matrix placing each asset in a quadrant to simplify decisions and ease reporting
Cash Cows

Stabilized Class‑A Office with Long WALE (Credit tenancy)
Stabilized Class-A office assets deliver dependable cash via long leases, strong tenant covenants and limited near-term rollover, underpinning 2024 cash flow stability for American Assets Trust.
Growth is muted but margins remain healthy with modest TI/LC burn, allowing these towers to pay the bills and fund optionality elsewhere.
Strategy: maintain operations, refinance smartly to lock low rates, and harvest surplus cash for higher-return redevelopment or acquisition options.
Mature Grocery‑Anchored Centers (Near‑full occupancy)
Mature grocery-anchored centers at American Assets Trust show near-full occupancy (96–98%) with low capex and sticky tenants, delivering predictable rent bumps of roughly 2–3% annually in 2024 — the trifecta driving steady cash flow. Minimal promotional spend and disciplined operations lifted NOI margins in 2024, so prioritize milking cash while tightening opex and extracting parking yield.

Ground Leases and Pad Sites
Ground leases and pad sites deliver landlord-friendly structures with CPI or fixed 2%–3% rent escalators, keeping cash net and clean. Growth is low and risk is low, fitting the Cash Cows quadrant. Administrative load is tiny relative to income, often below typical asset-management intensity. Hold these assets and deploy proceeds into higher-beta developments or acquisitions.

Parking and Ancillary Income at Core Assets
Parking and ancillary income at core assets delivers steady, high‑margin cash from office, residential and retail users, acting as a low‑volatility earnings stream for American Assets Trust.
- Reliable cash flow
- Low growth, high margin
- Upside via dynamic pricing
- Maintenance-light yield
Stabilized Coastal Multifamily (Mid‑market units)
Stabilized coastal multifamily (mid‑market units) in American Assets Trust delivered consistent NOI in 2024 driven by occupancy near 95% and rent growth of roughly 3% year‑over‑year; turn costs remained predictable and marketing needs were minimal beyond standard churn.
- Optimize utilities: reduce operating expense ratio
- Renewals: target +2–3% bumps
- Turn cost predictability: plan 30–45 days
- Low marketing: focus on retention
Stable Class-A office & grocery centers: ~55% NOI, occ 95-98%
Stabilized Class-A office and grocery-anchored centers generated predictable 2024 cash: NOI contribution ~55% of portfolio NOI, occupancy 95–98%, rent growth 2–3% and NOI margin +6–8 pts vs. developments.
| Metric | 2024 |
|---|---|
| NOI share | ~55% |
| Occupancy | 95–98% |
| Rent growth | 2–3% |
| NOI margin uplift | +6–8 pts |
Preview = Final Product
American Assets Trust BCG Matrix
The file you're previewing is the exact American Assets Trust BCG Matrix you'll receive after purchase. No watermarks, no demo content—just a fully formatted, ready-to-use report built for strategic clarity. After purchase the full document is immediately downloadable and editable for presentations, planning, or client delivery. No surprises, just usable analysis.

Download Your Competitive Advantage
American Assets Trust’s BCG Matrix preview shows where key assets sit—market leaders, cash generators, or potential drainers—and why those placements matter for short- and long-term capital moves. Want the full picture? Purchase the complete BCG Matrix for quadrant-by-quadrant analysis, data-driven recommendations, and ready-to-use Word and Excel files that let you act fast. Skip the guesswork—get the strategic roadmap that makes allocation decisions obvious and defensible.
Stars
Coastal Class‑A Multifamily (San Diego & Hawaii)
Coastal Class-A multifamily in San Diego and Hawaii posts high occupancy in the mid-90s, limited new supply in supply-constrained submarkets, and steady in-migration, giving AAT clear pricing power. AAT’s concentrated footprint delivers outsized share where it matters, letting rents rise faster than broader market averages (often by 200–300 bps). Even with conservative turns, targeted livability capex sustains rent growth and defends the lead.
Prime Grocery‑Anchored Retail (High‑barrier submarkets)
Daily‑needs centers in dense, affluent trade areas sustain high traffic and tenant sales, with grocery e‑commerce penetration near 9% in 2024 (Brick Meets Click), keeping in‑store volumes stable. Occupancy for grocery‑anchored centers ran about 95–97% in 2024 (CBRE/CoStar), driving positive renewal spreads and minimal downtime. As e‑comm resistant retail, this is a defensible growth pocket—double down on merchandising and parking/curbside ops to retain No.1 market share momentum.
Destination Urban Mixed‑Use (Live‑work‑shop nodes)
Destination Urban Mixed‑Use (Live‑work‑shop nodes) bundles residential above curated retail to capture multiple wallets per visit, with leasing synergy driving both occupancy and rent growth; American Assets Trust saw portfolio occupancy above 90% in 2024 and same‑store NOI growth in the mid single digits. In tight coastal markets these nodes outpace the comp set on rent and traffic; invest in experience upgrades to convert 2024 growth into durable dominance.
Hawaii High‑Street/Tourism‑Driven Retail
When travel rebounds, tenant sales in Hawaii high‑street/tourism retail surged, with visitor arrivals reaching about 9.6 million in 2024 per Hawaii Tourism Authority, lifting percentage rents and spreads across flagship locations.
Extreme barriers to entry—limited frontage and zoning—concentrate share among incumbents; brand demand for flagship frontage remains strong even in choppy cycles.
Active placemaking and tourism recovery keep these assets in the BCG Stars/growth bucket with sustained high occupancy and rent premiums.
- Visitor arrivals 2024: ~9.6M
- High occupancy; premium rents for frontage
- Strong percentage‑rent upside when travel rebounds
- High entry barriers concentrate incumbent share
Redeveloped Lifestyle Centers with Leasing Tailwinds
Recent re-merchandising and amenity upgrades have flipped several American Assets Trust lifestyle centers into high-growth Stars, with early 2024 lease-up momentum averaging about 70% within 12 months and occupancy lifting toward best‑in‑class levels. As foot traffic recovers, top operators capture the lion’s share of expanding experiential concepts, driving same‑asset NOI and rent growth. Continued investment in tenant mix and digital engagement will compound gains.
- Tag: lease-up 70% (12 months)
- Tag: occupancy rising
- Tag: NOI/rent growth
- Tag: tenant mix & digital
Coastal Class-A: mid-90s occ, 9.6M visitors, grocery 95–97%
Coastal Class-A multifamily and high-street retail show mid-90s occupancy and 200–300 bps rent outperformance; Hawaii visitor arrivals ~9.6M (2024) boost percentage rents; grocery-anchored centers 95–97% occ (2024) with mid-single-digit same-store NOI growth; recent lifestyle lease-ups hit ~70% within 12 months, sustaining Star status.
| Metric | 2024 |
|---|---|
| Occupancy | mid-90s% |
| Visitor arrivals | 9.6M |
| Grocery occ | 95–97% |
| Lease-up | ~70% (12mo) |
| NOI growth | mid-single-digit% |
What is included in the product
Detailed Word Document
BCG Matrix for American Assets Trust: assesses Stars, Cash Cows, Question Marks and Dogs with clear invest, hold or divest guidance.
Customizable Excel Spreadsheet
One-page American Assets Trust BCG Matrix placing each asset in a quadrant to simplify decisions and ease reporting
Cash Cows
Stabilized Class‑A Office with Long WALE (Credit tenancy)
Stabilized Class-A office assets deliver dependable cash via long leases, strong tenant covenants and limited near-term rollover, underpinning 2024 cash flow stability for American Assets Trust.
Growth is muted but margins remain healthy with modest TI/LC burn, allowing these towers to pay the bills and fund optionality elsewhere.
Strategy: maintain operations, refinance smartly to lock low rates, and harvest surplus cash for higher-return redevelopment or acquisition options.
Mature Grocery‑Anchored Centers (Near‑full occupancy)
Mature grocery-anchored centers at American Assets Trust show near-full occupancy (96–98%) with low capex and sticky tenants, delivering predictable rent bumps of roughly 2–3% annually in 2024 — the trifecta driving steady cash flow. Minimal promotional spend and disciplined operations lifted NOI margins in 2024, so prioritize milking cash while tightening opex and extracting parking yield.
Ground Leases and Pad Sites
Ground leases and pad sites deliver landlord-friendly structures with CPI or fixed 2%–3% rent escalators, keeping cash net and clean. Growth is low and risk is low, fitting the Cash Cows quadrant. Administrative load is tiny relative to income, often below typical asset-management intensity. Hold these assets and deploy proceeds into higher-beta developments or acquisitions.
Parking and Ancillary Income at Core Assets
Parking and ancillary income at core assets delivers steady, high‑margin cash from office, residential and retail users, acting as a low‑volatility earnings stream for American Assets Trust.
- Reliable cash flow
- Low growth, high margin
- Upside via dynamic pricing
- Maintenance-light yield
Stabilized Coastal Multifamily (Mid‑market units)
Stabilized coastal multifamily (mid‑market units) in American Assets Trust delivered consistent NOI in 2024 driven by occupancy near 95% and rent growth of roughly 3% year‑over‑year; turn costs remained predictable and marketing needs were minimal beyond standard churn.
- Optimize utilities: reduce operating expense ratio
- Renewals: target +2–3% bumps
- Turn cost predictability: plan 30–45 days
- Low marketing: focus on retention
Stable Class-A office & grocery centers: ~55% NOI, occ 95-98%
Stabilized Class-A office and grocery-anchored centers generated predictable 2024 cash: NOI contribution ~55% of portfolio NOI, occupancy 95–98%, rent growth 2–3% and NOI margin +6–8 pts vs. developments.
| Metric | 2024 |
|---|---|
| NOI share | ~55% |
| Occupancy | 95–98% |
| Rent growth | 2–3% |
| NOI margin uplift | +6–8 pts |
Preview = Final Product
American Assets Trust BCG Matrix
The file you're previewing is the exact American Assets Trust BCG Matrix you'll receive after purchase. No watermarks, no demo content—just a fully formatted, ready-to-use report built for strategic clarity. After purchase the full document is immediately downloadable and editable for presentations, planning, or client delivery. No surprises, just usable analysis.
Original: $10.00
-65%$10.00
$3.50Description
Download Your Competitive Advantage
American Assets Trust’s BCG Matrix preview shows where key assets sit—market leaders, cash generators, or potential drainers—and why those placements matter for short- and long-term capital moves. Want the full picture? Purchase the complete BCG Matrix for quadrant-by-quadrant analysis, data-driven recommendations, and ready-to-use Word and Excel files that let you act fast. Skip the guesswork—get the strategic roadmap that makes allocation decisions obvious and defensible.
Stars
Coastal Class‑A Multifamily (San Diego & Hawaii)
Coastal Class-A multifamily in San Diego and Hawaii posts high occupancy in the mid-90s, limited new supply in supply-constrained submarkets, and steady in-migration, giving AAT clear pricing power. AAT’s concentrated footprint delivers outsized share where it matters, letting rents rise faster than broader market averages (often by 200–300 bps). Even with conservative turns, targeted livability capex sustains rent growth and defends the lead.
Prime Grocery‑Anchored Retail (High‑barrier submarkets)
Daily‑needs centers in dense, affluent trade areas sustain high traffic and tenant sales, with grocery e‑commerce penetration near 9% in 2024 (Brick Meets Click), keeping in‑store volumes stable. Occupancy for grocery‑anchored centers ran about 95–97% in 2024 (CBRE/CoStar), driving positive renewal spreads and minimal downtime. As e‑comm resistant retail, this is a defensible growth pocket—double down on merchandising and parking/curbside ops to retain No.1 market share momentum.
Destination Urban Mixed‑Use (Live‑work‑shop nodes)
Destination Urban Mixed‑Use (Live‑work‑shop nodes) bundles residential above curated retail to capture multiple wallets per visit, with leasing synergy driving both occupancy and rent growth; American Assets Trust saw portfolio occupancy above 90% in 2024 and same‑store NOI growth in the mid single digits. In tight coastal markets these nodes outpace the comp set on rent and traffic; invest in experience upgrades to convert 2024 growth into durable dominance.
Hawaii High‑Street/Tourism‑Driven Retail
When travel rebounds, tenant sales in Hawaii high‑street/tourism retail surged, with visitor arrivals reaching about 9.6 million in 2024 per Hawaii Tourism Authority, lifting percentage rents and spreads across flagship locations.
Extreme barriers to entry—limited frontage and zoning—concentrate share among incumbents; brand demand for flagship frontage remains strong even in choppy cycles.
Active placemaking and tourism recovery keep these assets in the BCG Stars/growth bucket with sustained high occupancy and rent premiums.
- Visitor arrivals 2024: ~9.6M
- High occupancy; premium rents for frontage
- Strong percentage‑rent upside when travel rebounds
- High entry barriers concentrate incumbent share
Redeveloped Lifestyle Centers with Leasing Tailwinds
Recent re-merchandising and amenity upgrades have flipped several American Assets Trust lifestyle centers into high-growth Stars, with early 2024 lease-up momentum averaging about 70% within 12 months and occupancy lifting toward best‑in‑class levels. As foot traffic recovers, top operators capture the lion’s share of expanding experiential concepts, driving same‑asset NOI and rent growth. Continued investment in tenant mix and digital engagement will compound gains.
- Tag: lease-up 70% (12 months)
- Tag: occupancy rising
- Tag: NOI/rent growth
- Tag: tenant mix & digital
Coastal Class-A: mid-90s occ, 9.6M visitors, grocery 95–97%
Coastal Class-A multifamily and high-street retail show mid-90s occupancy and 200–300 bps rent outperformance; Hawaii visitor arrivals ~9.6M (2024) boost percentage rents; grocery-anchored centers 95–97% occ (2024) with mid-single-digit same-store NOI growth; recent lifestyle lease-ups hit ~70% within 12 months, sustaining Star status.
| Metric | 2024 |
|---|---|
| Occupancy | mid-90s% |
| Visitor arrivals | 9.6M |
| Grocery occ | 95–97% |
| Lease-up | ~70% (12mo) |
| NOI growth | mid-single-digit% |
What is included in the product
Detailed Word Document
BCG Matrix for American Assets Trust: assesses Stars, Cash Cows, Question Marks and Dogs with clear invest, hold or divest guidance.
Customizable Excel Spreadsheet
One-page American Assets Trust BCG Matrix placing each asset in a quadrant to simplify decisions and ease reporting
Cash Cows
Stabilized Class‑A Office with Long WALE (Credit tenancy)
Stabilized Class-A office assets deliver dependable cash via long leases, strong tenant covenants and limited near-term rollover, underpinning 2024 cash flow stability for American Assets Trust.
Growth is muted but margins remain healthy with modest TI/LC burn, allowing these towers to pay the bills and fund optionality elsewhere.
Strategy: maintain operations, refinance smartly to lock low rates, and harvest surplus cash for higher-return redevelopment or acquisition options.
Mature Grocery‑Anchored Centers (Near‑full occupancy)
Mature grocery-anchored centers at American Assets Trust show near-full occupancy (96–98%) with low capex and sticky tenants, delivering predictable rent bumps of roughly 2–3% annually in 2024 — the trifecta driving steady cash flow. Minimal promotional spend and disciplined operations lifted NOI margins in 2024, so prioritize milking cash while tightening opex and extracting parking yield.
Ground Leases and Pad Sites
Ground leases and pad sites deliver landlord-friendly structures with CPI or fixed 2%–3% rent escalators, keeping cash net and clean. Growth is low and risk is low, fitting the Cash Cows quadrant. Administrative load is tiny relative to income, often below typical asset-management intensity. Hold these assets and deploy proceeds into higher-beta developments or acquisitions.
Parking and Ancillary Income at Core Assets
Parking and ancillary income at core assets delivers steady, high‑margin cash from office, residential and retail users, acting as a low‑volatility earnings stream for American Assets Trust.
- Reliable cash flow
- Low growth, high margin
- Upside via dynamic pricing
- Maintenance-light yield
Stabilized Coastal Multifamily (Mid‑market units)
Stabilized coastal multifamily (mid‑market units) in American Assets Trust delivered consistent NOI in 2024 driven by occupancy near 95% and rent growth of roughly 3% year‑over‑year; turn costs remained predictable and marketing needs were minimal beyond standard churn.
- Optimize utilities: reduce operating expense ratio
- Renewals: target +2–3% bumps
- Turn cost predictability: plan 30–45 days
- Low marketing: focus on retention
Stable Class-A office & grocery centers: ~55% NOI, occ 95-98%
Stabilized Class-A office and grocery-anchored centers generated predictable 2024 cash: NOI contribution ~55% of portfolio NOI, occupancy 95–98%, rent growth 2–3% and NOI margin +6–8 pts vs. developments.
| Metric | 2024 |
|---|---|
| NOI share | ~55% |
| Occupancy | 95–98% |
| Rent growth | 2–3% |
| NOI margin uplift | +6–8 pts |
Preview = Final Product
American Assets Trust BCG Matrix
The file you're previewing is the exact American Assets Trust BCG Matrix you'll receive after purchase. No watermarks, no demo content—just a fully formatted, ready-to-use report built for strategic clarity. After purchase the full document is immediately downloadable and editable for presentations, planning, or client delivery. No surprises, just usable analysis.











